


Somerford House & Place Frederick
Assisted Living, Memory Care & Respite Care · Frederick, MD
Somerford House & Place Frederick
Assisted Living, Memory Care & Respite Care · Frederick, MD
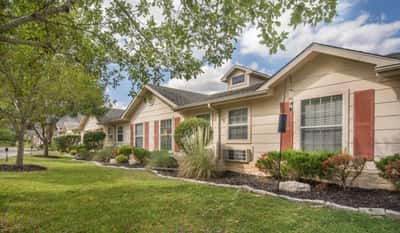
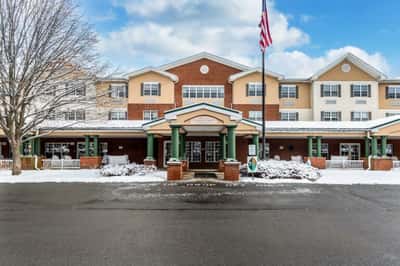
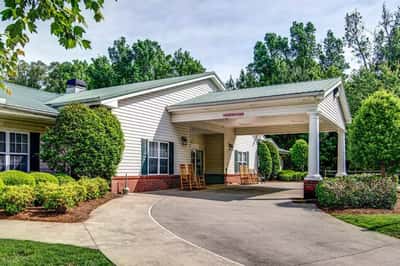
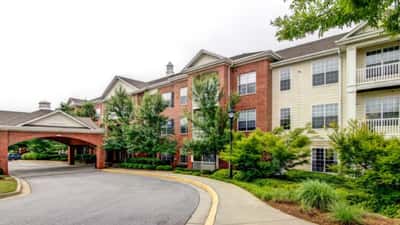
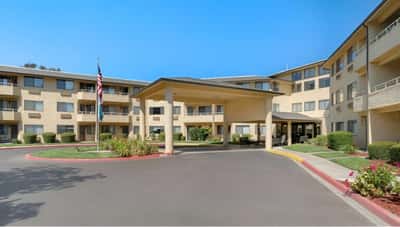
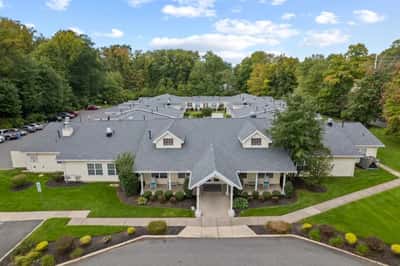
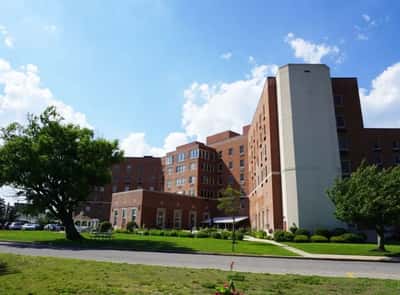
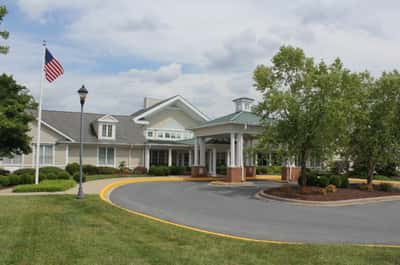
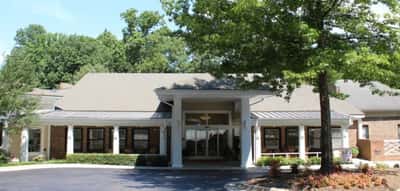
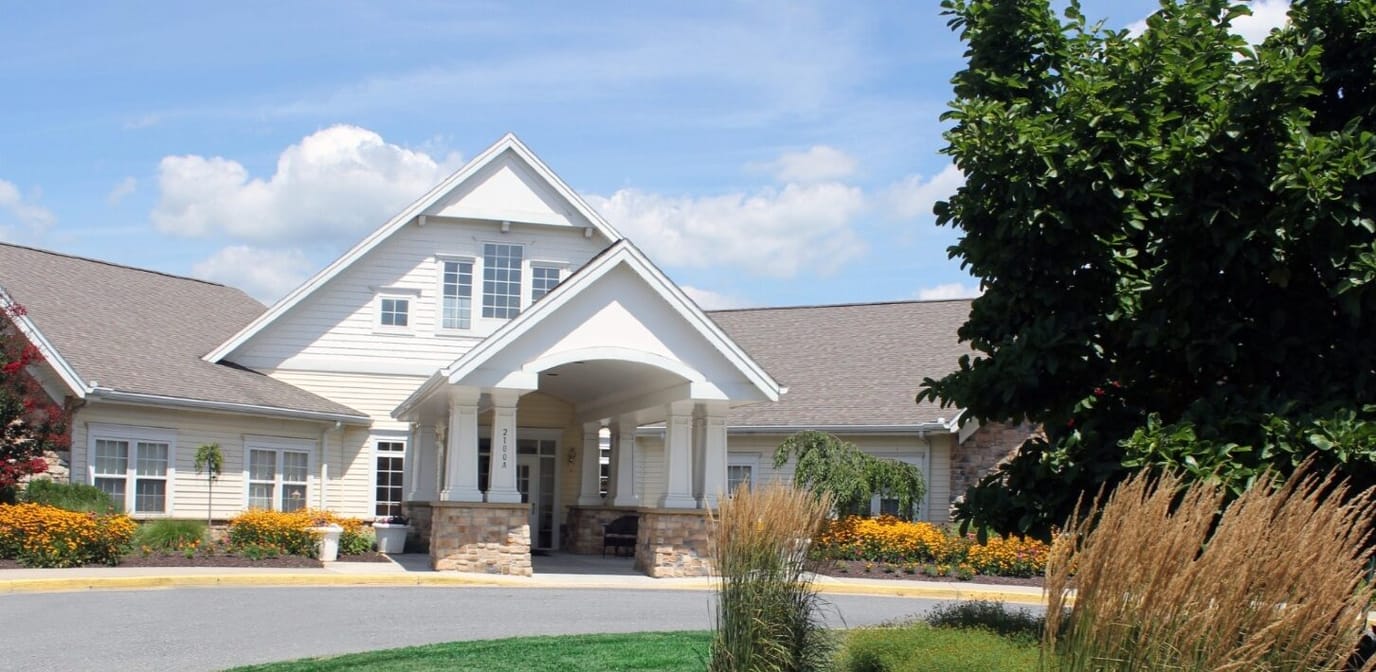
Tucked away beside a serene lake with stunning mountain views in Frederick, MD, Somerford House & Place Frederick is a peaceful senior living community that offers various living options, including Assisted Living, Memory Care, and Respite Care & Short-Term Stays. Residents can enjoy natural beauty right outside their door and engage in a vibrant community with friends. Popular activities include happy hour, card games, and arts and crafts, ensuring there’s always something fun and engaging to do.
Committed to providing its residents with fulfilling and enriching lifestyle, the community
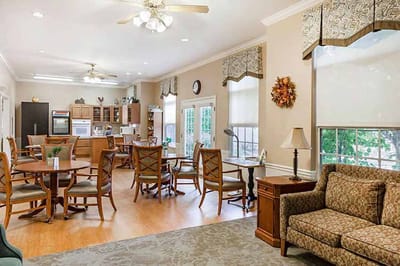
offers excellent amenities such as Ageility Physical Therapy Solutions, a beauty salon, a gazebo, and a private dining room. Programs like gardening, live entertainment, and cultural excursions further enhance the residents’ quality of life, providing a supportive and enjoyable environment for everyone. Recognized as a 2023-2024 U.S. News & World Report Best Assisted Living facility, the community ensures quality care and services that warrants a comfortable living experience.
52-bed community Rank #221 / 697Bed count — State benchmarkedThis home is ranked 221st out of 697 homes in Maryland. Shows this facility's certified or reported bed count compared to other Maryland facilities. Larger communities may offer more amenities, programs, and on-site services for residents and families.Rankings are based only on facilities in Maryland that report data for that category. Facilities without available data are excluded from the ranking.Click the rank badge to see the full State ranking.Click here to see the full State ranking.
A moderately sized community that may balance personal attention with shared amenities and social activities.
25 years in operation Rank #83 / 208Years in operation — State benchmarkedThis home is ranked 83rd out of 208 homes in Maryland. Shows how long this facility has been in operation compared to other Maryland facilities. Longer operating histories may benefit residents, families, and staff.Rankings are based only on facilities in Maryland that report data for that category. Facilities without available data are excluded from the ranking.Click the rank badge to see the full State ranking.Click here to see the full State ranking.
A longer operating history, which may indicate experience navigating regulations and delivering ongoing care.
Walk Score: 40 / 100 Rank #523 / 985Walk Score — State benchmarkedThis home is ranked 523rd out of 985 homes in Maryland. Shows how walkable this facility's neighborhood is compared to the average Walk Score across Maryland facilities. Higher scores benefit residents, families, and staff.Rankings are based only on facilities in Maryland that report data for that category. Facilities without available data are excluded from the ranking.Click the rank badge to see the full State ranking.Click here to see the full State ranking.
Somewhat walkable. A few nearby services may be reachable on foot, but most trips require transportation.
About this community
CountyFrederick
Somerford House & Place Frederick is legally operated by Five Star Senior Living.
Profit StatusTrue
Private Room
$170 - $265 per day
Hospice Affiliations
Staffing
Key information about the people who lead and staff this community.
No CNA training program
Mild Alzheimer's Level
No moderate Alzheimer's level
No severe Alzheimer's level
Demographics
Resident demographic information for this facility.
Gender
- Female 78.9%
- Male 21.2%
Age Distribution
- 75-84 44.2%
- 85-94 23.1%
- 95+ 15.4%
- 65-74 13.5%
- ≤64 3.9%
Ethnicity
- White 90.4%
- Mixed Race 3.9%
- Other 3.9%
- Hispanic 1.9%
What does this home offer?
Pets Allowed
Housing Options: Studio / 1 Bed
Building Type: Single-story
Beauty Services
Transportation Services
Housekeeping Services
Recreational Activities
Exercise Programs
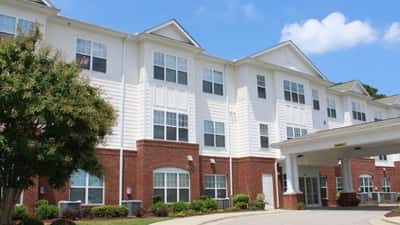
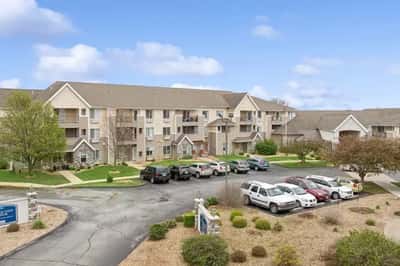
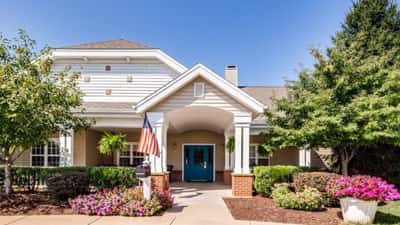
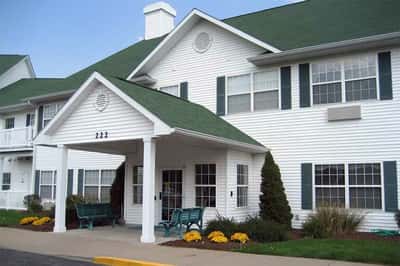
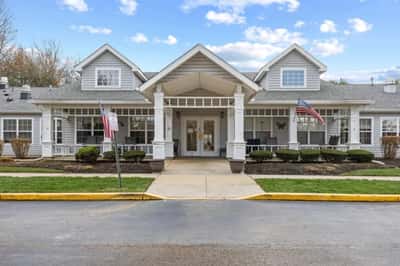
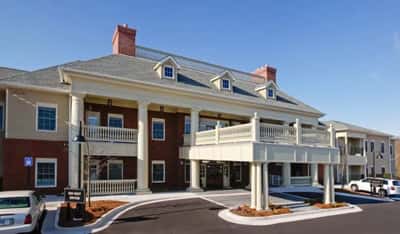
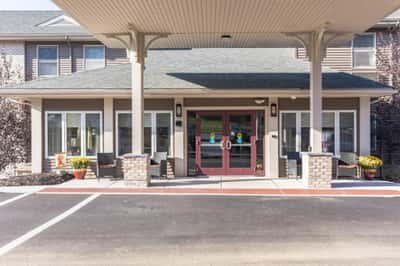
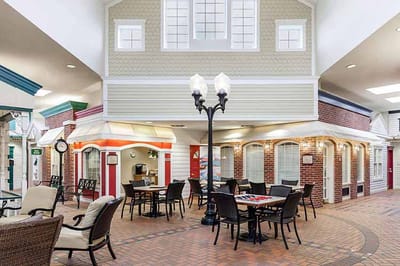
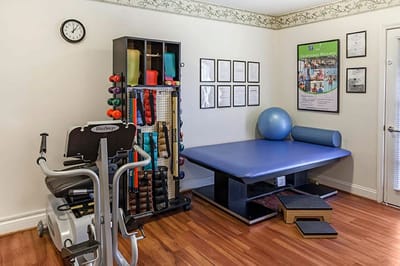
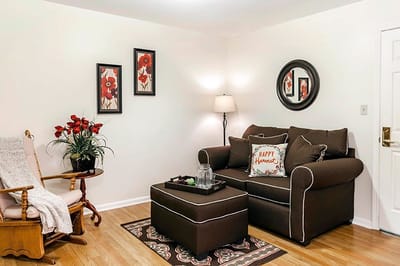
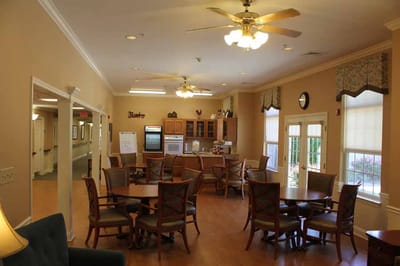
Living Spaces & Floor Plans for Somerford House & Place Frederick
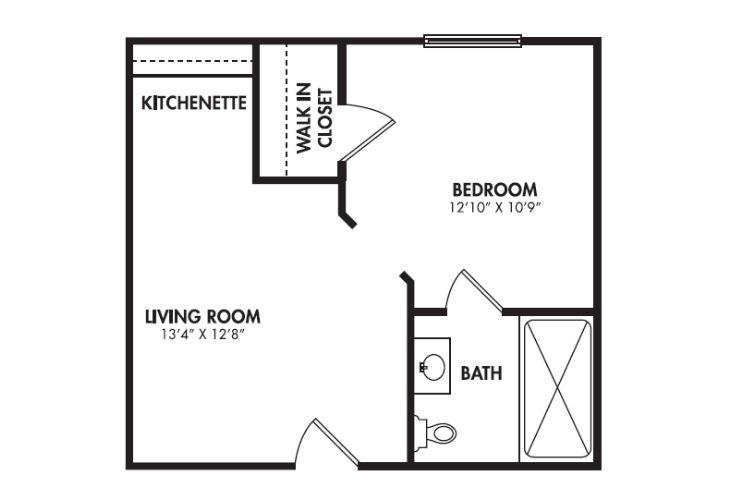
Somerford House Frederick Al Mc 3
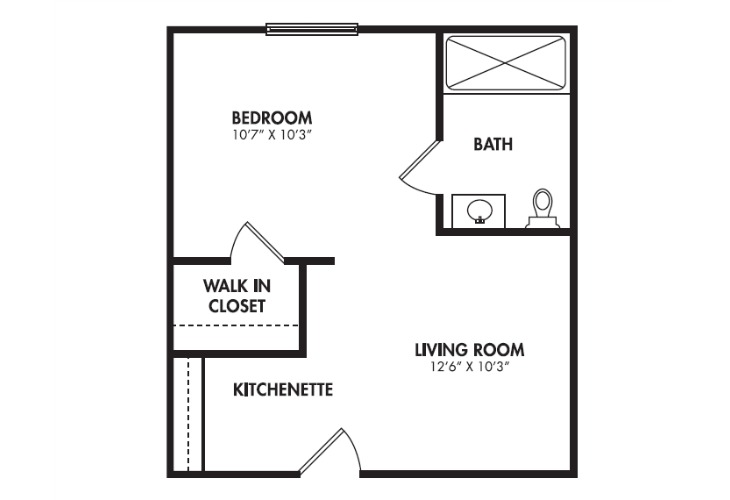
Somerford House Frederick Al Mc 2
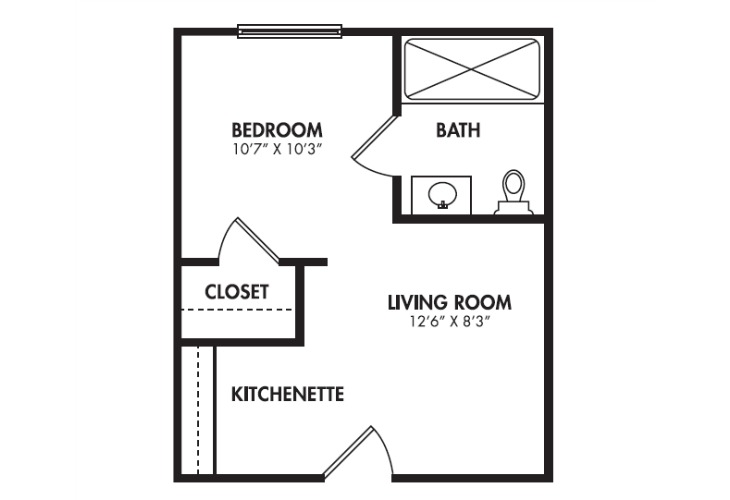
Somerford House Frederick Al Mc 1
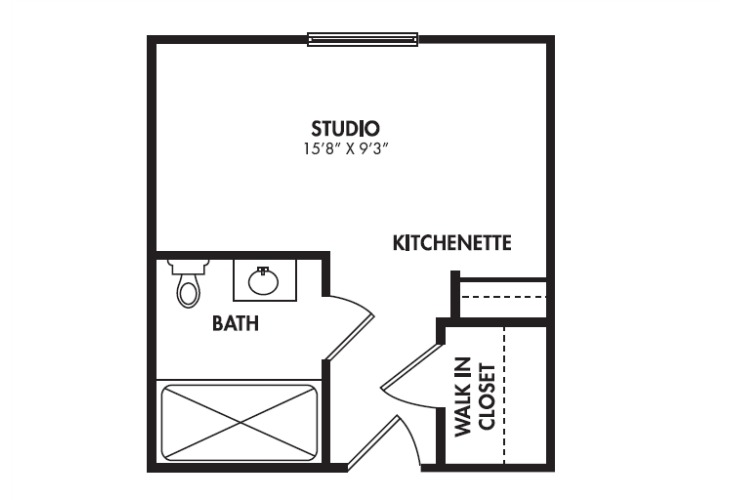
Somerford House Frederick Al Mc
Places of interest near Somerford House & Place Frederick
![]() 4.1 miles from city center
4.1 miles from city center
![]() Estimated distance in miles from Frederick's city center to Somerford House & Place Frederick's address, calculated via Google Maps.
— 16.23 miles to nearest hospital (Frederick Health Mt Airy)
Estimated distance in miles from Frederick's city center to Somerford House & Place Frederick's address, calculated via Google Maps.
— 16.23 miles to nearest hospital (Frederick Health Mt Airy)
Calculate Travel Distance to Somerford House & Place Frederick
Add your location
Compare Assisted Living around Frederick
The information below is reported by the Maryland Department of Health, Office of Health Care Quality.
| Spring Arbor of Frederick | AL MC | Frederick (Ballenger Creek) | 115
Facility
115
MD AVG
43
Rank
#90 / 697 | Yes |
25
Facility
25
MD AVG
43
Rank
#684 / 985 | Studio / 1 Bed / 2 Bed | 7
Facility
7
MD AVG
21
Rank
#172 / 208 | - |
31% Male Residents — State Benchmarked 31% of residents are male, compared to the Maryland average of 31%. This facility caters to a majority female resident pool (69% female), consistent with the broader assisted living trend where women significantly outnumber men. |
69% Female Residents — State Benchmarked 69% of residents are female, compared to the Maryland average of 69%. Women comprise the large majority, consistent with national assisted living demographics where women live longer and enter care facilities at higher rates. |
96% White Residents — State Benchmarked 96% of residents are reported as White, compared to the Maryland average of 81%. A higher White share than is typical for assisted living in Maryland in this dataset — compare with peer facilities for local context. |
0% African American Residents — State Benchmarked 0% of residents are reported as African American or Black, compared to the Maryland average of 13%. A lower African American share than is typical in Maryland; local markets still vary widely. |
4% Other Ethnicity Residents — State Benchmarked 4% of residents fall into categories other than White or African American (combined), compared to the Maryland average of 6%. This column aggregates Hispanic, Asian, multiracial, and any other labeled groups that are not classified as White or African American. Reported subgroups in this total: Asian (4%). |
3% Residents Age 65–74 — State Benchmarked 3% of residents are 65–74, compared to the Maryland average of 13%. Fewer younger seniors suggests the resident population skews older, likely requiring higher acuity care and more hands-on support. |
39% Residents Age 75–84 — State Benchmarked 39% of residents are 75–84, compared to the Maryland average of 31%. A high concentration in this mid-range bracket, where residents typically need moderate support with daily activities. |
34% Residents Age 85–94 — State Benchmarked 34% of residents are 85–94, compared to the Maryland average of 44%. The population here skews younger than the statewide norm, which may indicate a more active, lower-acuity community. |
25% Residents Age 95+ — State Benchmarked 25% of residents are 95 or older, compared to the Maryland average of 16%. A high proportion of the oldest-old suggests strong end-of-life care experience and very-high-acuity capabilities. |
| Village Crossing at Worman‘s Mill – SageLife Senior Living | AL MC RC | Frederick (Wormans Mill) | 100
Facility
100
MD AVG
43
Rank
#117 / 697 | No |
56
Facility
56
MD AVG
43
Rank
#357 / 985 | Studio / 1 Bed / 2 Bed | 3
Facility
3
MD AVG
21
Rank
#201 / 208 | - | - | - | - | - | - | - | - | - | - |
| Sunrise of Frederick | AL MC | Frederick (Waterford) | 88
Facility
88
MD AVG
43
Rank
#162 / 697 | Yes |
62
Facility
62
MD AVG
43
Rank
#286 / 985 | Studio / Suite / 2 Bed | 45
Facility
45
MD AVG
21
Rank
#4 / 208 | A- |
31% Male Residents — State Benchmarked 31% of residents are male, compared to the Maryland average of 31%. This facility caters to a majority female resident pool (69% female), consistent with the broader assisted living trend where women significantly outnumber men. |
69% Female Residents — State Benchmarked 69% of residents are female, compared to the Maryland average of 69%. Women comprise the large majority, consistent with national assisted living demographics where women live longer and enter care facilities at higher rates. |
97% White Residents — State Benchmarked 97% of residents are reported as White, compared to the Maryland average of 81%. A higher White share than is typical for assisted living in Maryland in this dataset — compare with peer facilities for local context. |
2% African American Residents — State Benchmarked 2% of residents are reported as African American or Black, compared to the Maryland average of 13%. A lower African American share than is typical in Maryland; local markets still vary widely. |
2% Other Ethnicity Residents — State Benchmarked 2% of residents fall into categories other than White or African American (combined), compared to the Maryland average of 6%. This column aggregates Hispanic, Asian, multiracial, and any other labeled groups that are not classified as White or African American. Reported subgroups in this total: Hispanic (2%). |
10% Residents Age 65–74 — State Benchmarked 10% of residents are 65–74, compared to the Maryland average of 13%. Fewer younger seniors suggests the resident population skews older, likely requiring higher acuity care and more hands-on support. |
34% Residents Age 75–84 — State Benchmarked 34% of residents are 75–84, compared to the Maryland average of 31%. This is the second most common age bracket in assisted living, representing residents with moderate care needs. |
48% Residents Age 85–94 — State Benchmarked 48% of residents are 85–94, compared to the Maryland average of 44%. This is typically the most common age bracket in assisted living — this facility is in line with the statewide norm. |
6% Residents Age 95+ — State Benchmarked 6% of residents are 95 or older, compared to the Maryland average of 16%. Most residents here have not yet reached the oldest-old bracket, suggesting a younger overall community. |
| Silverado Frederick Memory Care Community | AL MC RC | Frederick | 72
Facility
72
MD AVG
43
Rank
#189 / 697 | Yes |
20
Facility
20
MD AVG
43
Rank
#740 / 985 | Private Rooms / Semi-Private Rooms | 3
Facility
3
MD AVG
21
Rank
#201 / 208 | - | - | - | - | - | - | - | - | - | - |
| Somerford House & Place Frederick | AL MC RC | Frederick (Whittier) | 52
Facility
52
MD AVG
43
Rank
#221 / 697 | Yes |
40
Facility
40
MD AVG
43
Rank
#523 / 985 | Studio / 1 Bed | 25
Facility
25
MD AVG
21
Rank
#83 / 208 | - |
21% Male Residents — State Benchmarked 21% of residents are male, compared to the Maryland average of 31%. This facility caters to a majority female resident pool (79% female), consistent with the broader assisted living trend where women significantly outnumber men. |
79% Female Residents — State Benchmarked 79% of residents are female, compared to the Maryland average of 69%. Women comprise the large majority, consistent with national assisted living demographics where women live longer and enter care facilities at higher rates. |
90% White Residents — State Benchmarked 90% of residents are reported as White, compared to the Maryland average of 81%. A higher White share than is typical for assisted living in Maryland in this dataset — compare with peer facilities for local context. |
0% African American Residents — State Benchmarked 0% of residents are reported as African American or Black, compared to the Maryland average of 13%. A lower African American share than is typical in Maryland; local markets still vary widely. |
10% Other Ethnicity Residents — State Benchmarked 10% of residents fall into categories other than White or African American (combined), compared to the Maryland average of 6%. This column aggregates Hispanic, Asian, multiracial, and any other labeled groups that are not classified as White or African American. Reported subgroups in this total: Mixed Race (4%), Other (4%), Hispanic (2%). |
13% Residents Age 65–74 — State Benchmarked 13% of residents are 65–74, compared to the Maryland average of 13%. In line with the statewide profile for this youngest senior bracket in assisted living. |
44% Residents Age 75–84 — State Benchmarked 44% of residents are 75–84, compared to the Maryland average of 31%. A high concentration in this mid-range bracket, where residents typically need moderate support with daily activities. |
23% Residents Age 85–94 — State Benchmarked 23% of residents are 85–94, compared to the Maryland average of 44%. The population here skews younger than the statewide norm, which may indicate a more active, lower-acuity community. |
15% Residents Age 95+ — State Benchmarked 15% of residents are 95 or older, compared to the Maryland average of 16%. In line with the statewide profile for the oldest resident bracket. |
Financial Assistance for
Assisted Living in Maryland
Somerford House & Place Frederick is located in Frederick, Maryland.
Here are the financial assistance programs available to residents in Maryland.
More homes from the same operator
Operated by
Discovery Senior Living
Frequently Asked Questions about Somerford House & Place Frederick
What neighborhood is Somerford House & Place Frederick in?
Somerford House & Place Frederick is in the Whittier neighborhood of Frederick.
Who is the owner of Somerford House & Place Frederick?
The legal owner and operator of Somerford House & Place Frederick is Five Star Senior Living.
Is Somerford House & Place Frederick in a walkable area?
Somerford House & Place Frederick has a walk score of 40. Somewhat walkable. A few nearby services may be reachable on foot, but most trips require transportation.
How many beds does Somerford House & Place Frederick have?
Somerford House & Place Frederick has 52 beds.
Are there photos of Somerford House & Place Frederick?
Yes — there are 6 photos of Somerford House & Place Frederick in the photo gallery on this page.
What is the address of Somerford House & Place Frederick?
Somerford House & Place Frederick is located at 2100 Whittier Dr, Frederick, MD 21702.
What is the phone number of Somerford House & Place Frederick?
(301) 668-3930 will put you in contact with the team at Somerford House & Place Frederick.
Guides for Better Senior Living
Care Cost Calculator: See Prices in Your Area
Assisted Living Explorer
Don’t Wait Too Long: 7 Red Flag Signs Your Parent Needs Assisted Living Now
The True Cost of Assisted Living in 2025 – And How Families Are Paying For It
Understanding Senior Living Costs: Pricing Models, Discounts & Financial Assistance
Updated on
