


Total health inspections
17
State average N/A
Last Health inspection on Jul 2025
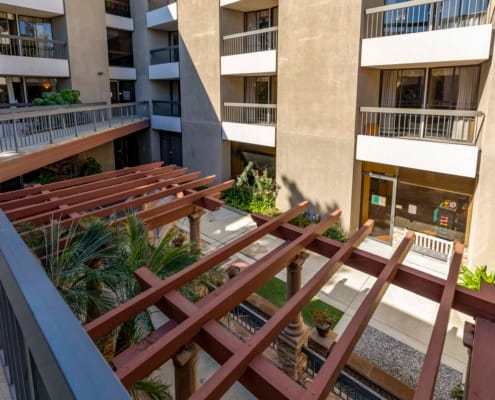
Barry Port owns Southland Living, a 75-bed nursing home that has operated under administrator Victoria Tran on Studebaker Road in Norwalk, California, for 10 years. Southland Management LLC manages the property, which runs at a 94 percent occupancy rate. Stays average just 66 days, indicating that the daily operational focus leans heavily toward short-term post-hospital therapy and recovery rather than long-term stays. To handle treatment and room costs, the business coordinates payments through private funds, traditional Medicare, and state Medicaid.
Residents receive an average of 4 hours and 42 minutes of direct care every day from the on-site clinical team. This hands-on time splits into 3 hours and 13 minutes from nurse aides, 1 hour and 15 minutes from licensed practical nurses, and 29 minutes from registered nurses who guide the physical rehabilitation routines.
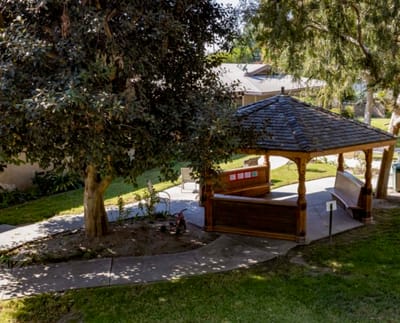
Outside the building, the neighborhood has a walk score of 86 out of 100, letting visiting families walk to nearby amenities without relying on a vehicle. Government health inspectors evaluate the facility through routine licensing checks to ensure clinical records match local health codes.
Prospective representatives can check on open beds by calling the front office, where they can also request info on intake guidelines or pick a day to look around the rehabilitation areas.
| Staff type | Hours / Day / Resident | vs state avg |
|---|---|---|
|
Registered Nurse (RN)
| 29m per day | ▼ 26% State avg: 39m per day · National avg: 41m per day |
|
LPN / LVN
| 1h 15m per day | ■ Avg State avg: 1h 13m per day · National avg: 52m per day |
|
Nurse Aide
| 3h 13m per day | ▲ 22% State avg: 2h 38m per day · National avg: 2h 20m per day |
|
Weekend Total Nursing
| 4h 35m per day | ▲ 12% State avg: 4h 5m per day · National avg: 3h 26m per day |
|
Physical Therapist
| 10m per day | ▲ 100% State avg: 5m per day · National avg: 4m per day |
|
Weekend RN
| 17m per day | ▼ 44% State avg: 30m per day · National avg: 28m per day |
Southland Living is legally operated by Southland Management LLC, and administered by Victoria Tran.
In California, the Department of Social Services (for assisted living facilities) and the Department of Public Health (for nursing homes) conduct inspections to ensure resident safety and regulatory compliance.
8 points below the California average for assisted living residences (81/100)
Rank #1021 / 1399 in California Inspection Score — State benchmarked This home is ranked 1021st out of 1399 homes in California for Inspection Score. Shows this facility's inspection score compared to the California average among 1399 comparable communities in the ranking pool. Facilities with the same value for a metric share the same rank. Rankings are based only on facilities in California that report data for that category. Facilities without available data are excluded from the ranking. This is a proprietary Assisted Living Magazine score. Inspection score: 73 out of 100. Letter grade C. 8 points below the California average for assisted living residences (81/100)
Citations
| This Facility | CA Average | vs. CA Avg |
|---|---|---|---|
|
Total citations
| 7 | 10 | This facility has 30% fewer total citations than a typical California assisted living residence (7 vs. CA avg 10).↓ 30% better |
|
Citations per year
| 1.4 | 2 | This facility has 30% fewer citations per year than a typical California assisted living residence (1.4 vs. CA avg 2).↓ 30% better |
|
Citations per inspection
| 0.2 | 3.3 | This facility has 94% fewer citations per inspection than a typical California assisted living residence (0.2 vs. CA avg 3.3).↓ 94% better |
Inspections & Visits
| This Facility | CA Average | vs. CA Avg |
|---|---|---|---|
|
Total visits
| 33 | 16 | This facility has 106% more total visits than a typical California assisted living residence (33 vs. CA avg 16).↑ 106% worse |
|
Complaint visits
| 25 | 13 | This facility has 92% more complaint visits than a typical California assisted living residence (25 vs. CA avg 13).↑ 92% worse Rank #1202 / 1388 Complaint visits — State benchmarked This home is ranked 1202nd out of 1388 homes in California for # of complaint visits. Shows this facility's # of complaint visits compared to the California average among 1388 comparable communities in the ranking pool. Facilities with the same value for a metric share the same rank. Rankings are based only on facilities in California that report data for that category. Facilities without available data are excluded from the ranking. |
|
Other visits
| 3 | 7 | This facility has 57% fewer other visits than a typical California assisted living residence (3 vs. CA avg 7).↓ 57% better |
|
Official inspections
| 5 | 4 | This facility has 25% more official inspections than a typical California assisted living residence (5 vs. CA avg 4).↑ 25% worse |
Complaints & Investigations
| This Facility | CA Average | vs. CA Avg |
|---|---|---|---|
|
Total complaints
| 29 | 14 | This facility has 107% more total complaints than a typical California assisted living residence (29 vs. CA avg 14).↑ 107% worse |
|
Complaints per year
| 5.8 | 2.8 | This facility has 107% more complaints per year than a typical California assisted living residence (5.8 vs. CA avg 2.8).↑ 107% worse |
State average N/A
Last Health inspection on Jul 2025
State average N/A
State average N/A
Health citations are formal notices following inspections when they fail to comply with safety and care standards.
50 of 80 citations resulted from standard inspections; 20 of 80 resulted from complaint investigations; and 10 of 80 came from combined inspections (standard and complaint).
State average: N/A
State average: N/A
Reporting period: October 1 – December 31, 2025 (Q4 2025). Source: CMS Payroll-Based Journal report.
State average ratio: 0 : 0
State average: 0 hours
Manages medical care and health needs.
Assists with medical care and medications.
Helps with daily care and mobility.
Total hours from contractors
796 contractor hours this quarter
| Certified Nursing Assistant | 86 | 5 | 91 | 27,515 | 92 | 100% | 7.3 |
| Licensed Practical Nurse | 38 | 0 | 38 | 12,831 | 92 | 100% | 7.6 |
| Nurse Aide in Training | 21 | 0 | 21 | 6,475 | 92 | 100% | 7.1 |
| Registered Nurse | 15 | 1 | 16 | 3,899 | 92 | 100% | 8 |
| Physical Therapy Aide | 8 | 0 | 8 | 2,220 | 91 | 99% | 7.2 |
| Dental Services Staff | 5 | 0 | 5 | 2,149 | 66 | 72% | 8 |
| Other Dietary Services Staff | 4 | 0 | 4 | 1,758 | 92 | 100% | 7.3 |
| Respiratory Therapy Technician | 4 | 0 | 4 | 1,754 | 77 | 84% | 7.7 |
| Speech Language Pathologist | 6 | 0 | 6 | 1,629 | 88 | 96% | 7.2 |
| Physical Therapy Assistant | 4 | 0 | 4 | 1,556 | 76 | 83% | 7.2 |
| Qualified Social Worker | 2 | 0 | 2 | 633 | 64 | 70% | 6.7 |
| Nurse Practitioner | 1 | 0 | 1 | 594 | 66 | 72% | 9 |
| Clinical Nurse Specialist | 1 | 0 | 1 | 567 | 63 | 68% | 9 |
| Administrator | 1 | 0 | 1 | 528 | 66 | 72% | 8 |
| Dietitian | 1 | 0 | 1 | 488 | 60 | 65% | 8.1 |
| Respiratory Therapist | 1 | 0 | 1 | 472 | 59 | 64% | 8 |
| Therapeutic Recreation Specialist | 1 | 0 | 1 | 468 | 58 | 63% | 8.1 |
| RN Director of Nursing | 2 | 0 | 2 | 307 | 47 | 51% | 6.5 |
Includes penalties issued in 2024-2025
Federal penalties imposed by CMS for regulatory violations, including civil money penalties (fines) and denials of payment for new Medicare/Medicaid admissions.
Source: CMS Penalties Database (Data as of Jan 2026)
State average: $55K
State average: 2.4
State average: 0.5
Penalties are imposed by CMS for violations of federal nursing home regulations.
2 penalties in the past 3 years
Multiple penalties were reported in the last 3 years.
Last updated: Jan 2026
These measures show how residents usually do over time at this home, based on health outcomes and preventive care.
State average: 6.6
State average: 11.3
State average: 11.1%
State average: 12.0%
State average: 11.3%
State average: 1.7%
State average: 5.0%
State average: 1.2%
State average: 4.2%
State average: 6.7%
State average: 10.1%
State average: 98.5%
State average: 98.2%
State average: 2.25
State average: 1.59
State average: 94.0%
State average: 1.5%
State average: 93.2%
State average: 23.2%
State average: 11.2%
State average: 0.8%
State average: 53.7%
State average: 50.6%
Quality measures are calculated from Minimum Data Set (MDS) assessments. For most measures, lower percentages indicate better care quality.
33% of new residents, usually for short-term rehab.
63% of new residents, often for short stays.
4% of new residents, often for long-term daily care.
Source: CMS Long-Term Care Facility Characteristics (Data as of Jan 2026)
Residents meet regularly to discuss policies, care quality, and activities
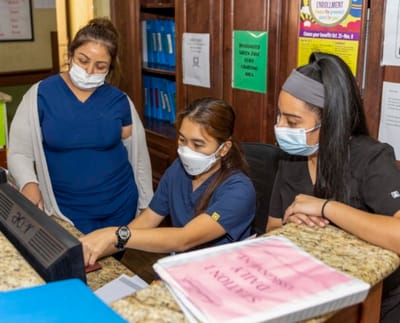
State-approved Nurse Aide Training and Competency Evaluation Program on-site
Organized group of residents that meets regularly to discuss facility policies, quality of life, and activities.
Data sourced from CMS Long-Term Care Facility Characteristics quarterly report. Payer mix reflects the current resident census by primary payment source.
Historical financial and operational data for Southland Living from 2011–2023, based on CMS SNF Cost Reports.
Key figures below are for fiscal year ending in 12/2023.
Based on CMS SNF Cost Report for fiscal year ending in 12/2023.
Residents typically stay for brief periods, with frequent admissions and discharges throughout the year.
Most new residents arrive under private pay (63% of admissions), and a typical private pay stay runs around 19 days.
Coverage residents most often arrive under.
Coverage residents most often leave under.
![]() 0.0 miles from city center
0.0 miles from city center
![]() Estimated distance in miles from Norwalk's city center to Southland Living's address, calculated via Google Maps.
Estimated distance in miles from Norwalk's city center to Southland Living's address, calculated via Google Maps.
Add your location
The information below is reported by the California Department of Social Services and Department of Public Health.
| Vi at Palo Alto | NH AL IL MC SNF | Palo Alto | - | 876 | - | 80 | 1 Bed / 2 Bed / 3 Bed |
| Canterbury Woods | NH AL IL SNF | Pacific Grove | - | 190 | A+ | 81 | 1 Bed / 2 Bed |
| The Vineyards – California Armenian Home | NH AL IL MC RESC SNF | Fresno (Roosevelt) | - | 412 | - | 24 | Studio / 1 Bed / 2 Bed |
| Webster House | NH AL IL SNF | Palo Alto (Crescent Park) | - | 54 | - | 90 | 1 Bed / 2 Bed |
| Southland Living | NH AL MC RC SNF | Norwalk | - | 75 | - | 86 | - |
Southland Living is legally operated by Southland Management LLC, and administered by Victoria Tran.
Southland Living has a walk score of 86. Very walkable. Most errands can be accomplished on foot, and many essentials are within a short walk.
Southland Living's occupancy is 93.9%.
No, Southland Living has a no-pet policy.
Southland Living is registered as a for-profit in CA.
Victoria Tran is the administrator of Southland Living.
Southland Living has 75 beds.
Care Cost Calculator: See Prices in Your Area
Nursing Home Data Explorer
Don’t Wait Too Long: 7 Red Flag Signs Your Parent Needs Assisted Living Now
The True Cost of Assisted Living in 2025 – And How Families Are Paying For It
Understanding Senior Living Costs: Pricing Models, Discounts & Financial Assistance


