Spang Crest
Nursing Home & Assisted Living · Pennsylvania, PA
CMS overall rating Info CMS (the Centers for Medicare & Medicaid Services) is the federal agency that rates nursing home quality. Its Overall Rating runs from 1 to 5 stars, combining health inspections, staffing, and quality measures, with inspections weighted most heavily.

Spang Crest

Nursing Home & Assisted Living · Pennsylvania, PA
CMS overall rating Info CMS (the Centers for Medicare & Medicaid Services) is the federal agency that rates nursing home quality. Its Overall Rating runs from 1 to 5 stars, combining health inspections, staffing, and quality measures, with inspections weighted most heavily.
Calculator: See prices in your area
Spang Crest accepts Medicare, Medicaid, and private pay.

Overview of Spang Crest

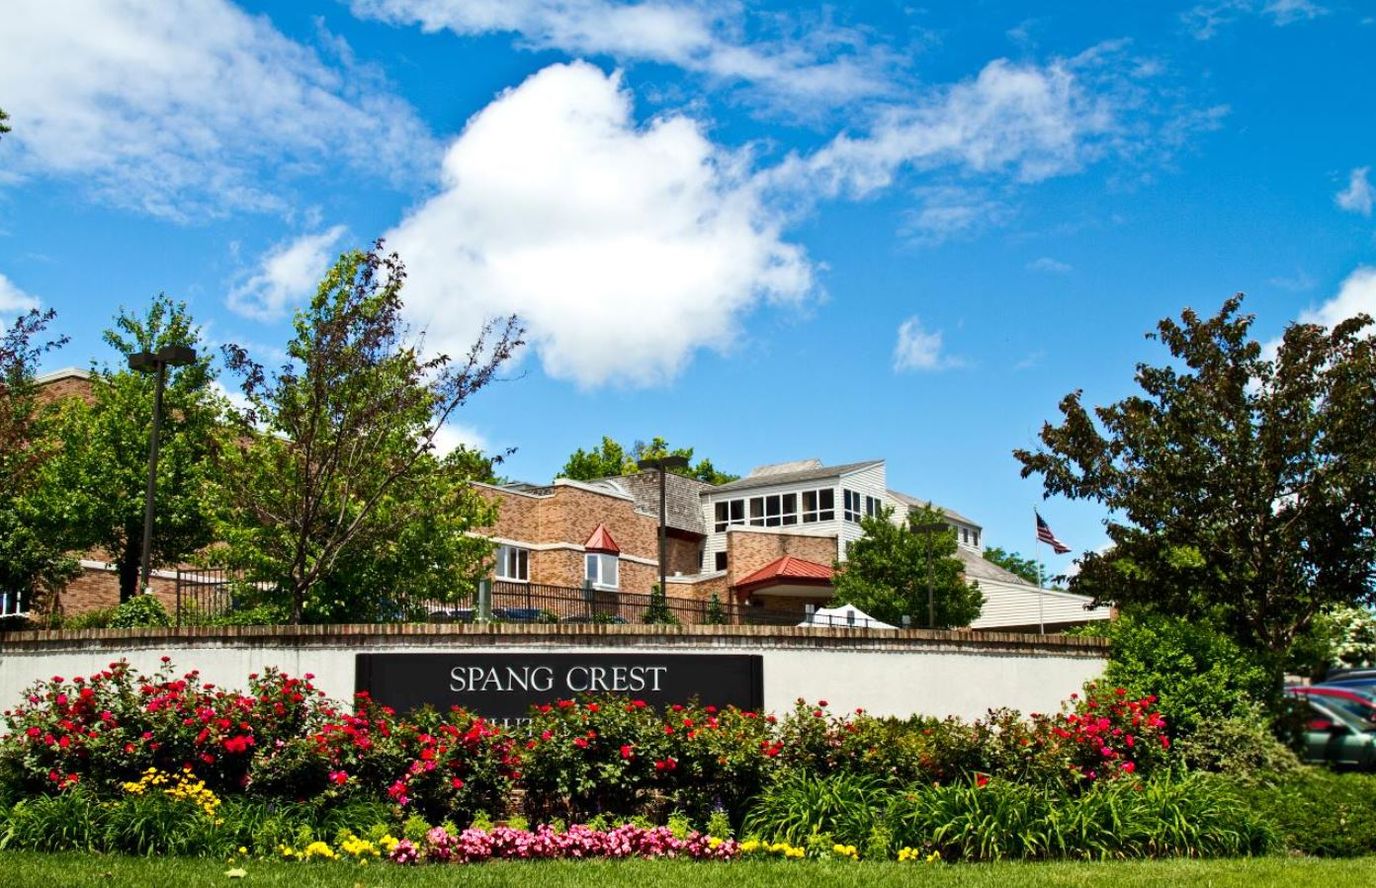
If your family is seeking high quality care for your senior loved ones in Lebanon County, you can be sure to find it at Spang Crest. Offering resident-centered care, seniors are sure to find that the care and assistance offered here at this facility to fully meet all the needs of the seniors. Additionally, the space in this facility is built to be spacious to make sure the residents are relaxed but are designed to create a home-like environment ensuring comfort.

Various activities are also available to all residents to keep them engaged and to allow for socialization among the residents. Aside from fostering connections, these events and activities are also in place for stimulation as they help keep the residents active. For families seeking comprehensive care in Lebanon County, Spang Crest is an excellent choice.

(717) 274-1495

Quality ratings

Measured by Centers for Medicare & Medicaid Services (CMS)

Overall rating Info The Overall CMS Rating combines results from health inspections, staffing levels and quality measures. Health inspections carry the most weight. Staffing and quality scores can increase or decrease the final rating based on performance compared to state and national standards.
▲ 33.5% Above PA avg. ▲ 33.5% Above PA avg.PA average: 3.0Click the badge to see the full State ranking.Click here to see the full State ranking.
Health Inspection Info Based on the results of the facility's three most recent standard inspections and any complaint investigations. CMS reviews the number, scope, and severity of deficiencies, with more recent findings weighted more heavily.
▲ 43.0% Above PA avg. ▲ 43.0% Above PA avg.PA average: 2.8Click the badge to see the full State ranking.Click here to see the full State ranking.
Staffing Info Measures average nursing staff hours per resident per day, including Registered Nurses (RNs) and total nursing staff. Ratings are adjusted based on the level of care residents require and are compared to state and national benchmarks.
▼ 41.0% Below PA avg. ▼ 41.0% Below PA avg.PA average: 3.4Click the badge to see the full State ranking.Click here to see the full State ranking.
Quality Measures Info Based on clinical and physical health indicators reported to CMS, such as hospital readmissions, falls, pressure ulcers, and improvements in mobility. These measures reflect how well residents' health needs are being managed.
▲ 17.9% Above PA avg. ▲ 17.9% Above PA avg.PA average: 3.4Click the badge to see the full State ranking.Click here to see the full State ranking.

Staffing hours breakdown

Info Daily nursing hours per resident by staff type, reported to CMS. Higher is generally better — compare this facility to state and national averages to see where staffing stands.

Hours per resident per day — compared to Pennsylvania state averages

Total nursing care / resident Info This home is ranked 148th out of 207 homes in Pennsylvania for nurse hours. Total adjusted nursing hours per resident per day, combining RN, LPN, and aide time. CMS adjusts this for case-mix so facilities can be fairly compared.
3h 46m per day
Rank #148 / 207Nurse hours — State benchmarkedThis home is ranked 148th out of 207 homes in Pennsylvania. Shows adjusted nurse hours per resident per day benchmarked to the Pennsylvania average, with a ranking across 207 Pennsylvania facilities. More hours mean more direct care. The national average is about 3.5 hrs; below 3.0 is a red flag.Rankings are based only on facilities in Pennsylvania that report data for that category. Facilities without available data are excluded from the ranking.Click the rank badge to see the full State ranking.Click here to see the full State ranking.
This facility Pennsylvania avg (4h 9m per day)
vs Pennsylvania avg
-9%

4 of 6 metrics below state avg

Standout metric LPN / LVN is +42% above state avg
Staff typeHours / Day / Residentvs state avg
Registered Nurse (RN) Info RNs hold the highest nursing license and can assess residents, interpret test results, and direct care plans. More RN hours per day often signals stronger clinical oversight and faster response to health changes. 31m per day ▼ 34% State avg: 47m per day · National avg: 41m per day
LPN / LVN Info Licensed Practical Nurses (LPNs) or Licensed Vocational Nurses (LVNs) deliver routine hands-on care — medication administration, wound dressing, and monitoring vital signs. They work under RN supervision and make up a large share of daily bedside care. 1h 17m per day ▲ 42% State avg: 54m per day · National avg: 52m per day
Nurse Aide Info Certified Nurse Aides (CNAs) provide the most direct day-to-day assistance: bathing, dressing, feeding, and mobility. Nurse aide hours are typically the largest staffing category and directly affect residents' quality of life. 2h 2m per day ▼ 8% State avg: 2h 12m per day · National avg: 2h 20m per day
Weekend Total Nursing Info Combined nursing hours (RN + LPN + Nurse Aide) per resident per day on weekends. Staffing often drops on weekends — this figure reveals whether the facility maintains adequate coverage outside of weekday hours. 3h 25m per day ▼ 3% State avg: 3h 32m per day · National avg: 3h 27m per day
Physical Therapist Info Hours per resident per day provided by licensed Physical Therapists (PTs) or PT Assistants. PT services help residents recover mobility after injury or illness and are especially important for post-acute (short-stay) rehabilitation. 6m per day ▲ 6% State avg: 6m per day · National avg: 4m per day
Weekend RN Info Registered nurse hours specifically on weekends. Facilities sometimes reduce RN presence on Saturdays and Sundays — a low weekend RN figure compared to weekday hours can indicate reduced clinical oversight when most administrative staff are absent. 16m per day ▼ 50% State avg: 33m per day · National avg: 29m per day

Capacity and availability

This home usually has availability

Higher occupancy than the Pennsylvania average: 78.7%
Occupancy rate
80.4% Rank #146 / 518Occupancy rate — State benchmarkedThis home is ranked 146th out of 518 homes in Pennsylvania. Shows this facility's occupancy rate versus the Pennsylvania average, with its Statewide rank out of 518. Higher occupancy signals strong local demand and financial stability.Rankings are based only on facilities in Pennsylvania that report data for that category. Facilities without available data are excluded from the ranking.Click the rank badge to see the full State ranking.Click here to see the full State ranking.
Avg. Length of Stay
137 days
Bed community size
105-bed community Rank #186 / 555Bed count — State benchmarkedThis home is ranked 186th out of 555 homes in Pennsylvania. Shows this facility's certified or reported bed count compared to other Pennsylvania facilities. Larger communities may offer more amenities, programs, and on-site services for residents and families.Rankings are based only on facilities in Pennsylvania that report data for that category. Facilities without available data are excluded from the ranking.Click the rank badge to see the full State ranking.Click here to see the full State ranking.
A larger shared setting that may offer more common spaces and organized community services.
Walk Score
Walk Score: 71 / 100 Rank #135 / 668Walk Score — State benchmarkedThis home is ranked 135th out of 668 homes in Pennsylvania. Shows how walkable this facility's neighborhood is compared to the average Walk Score across Pennsylvania facilities. Higher scores benefit residents, families, and staff.Rankings are based only on facilities in Pennsylvania that report data for that category. Facilities without available data are excluded from the ranking.Click the rank badge to see the full State ranking.Click here to see the full State ranking.
Very walkable. Most errands can be accomplished on foot, and many essentials are within a short walk.
BBB Rating
BBB Rating: A (Not Accredited)
An independent rating from the Better Business Bureau based on factors such as complaint history, transparency, and business practices.
How BBB ratings work

Contact Spang Crest

Health Inspection History

Inspections since 2023
Total health inspections 4

Pennsylvania average 6.7


Last Health inspection on Sep 2024

Total health citations
9 Rank #60 / 207Health citations — State benchmarkedThis home is ranked 60th out of 207 homes in Pennsylvania. Shows this facility's total health deficiency citations benchmarked to the Pennsylvania State average, with a ranking across all 207 PA facilities. Lower citation counts earn a better rank.Rankings are based only on facilities in Pennsylvania that report data for that category. Facilities without available data are excluded from the ranking.Click the rank badge to see the full State ranking.Click here to see the full State ranking.

Pennsylvania average 31.3

Citations per inspection
2.25 Rank #48 / 207Citations per inspection — State benchmarkedThis home is ranked 48th out of 207 homes in Pennsylvania. Shows average deficiency citations per CMS inspection for this facility versus the Pennsylvania mean across 207 facilities with citation data. Lower is better.Rankings are based only on facilities in Pennsylvania that report data for that category. Facilities without available data are excluded from the ranking.Click the rank badge to see the full State ranking.Click here to see the full State ranking.

Pennsylvania average 4.4


Health citations are formal notices following inspections when they fail to comply with safety and care standards.

3 of 9 citations resulted from standard inspections; 2 of 9 resulted from complaint investigations; and 4 of 9 came from combined inspections (standard and complaint).

Breakdown of citation severity (last 3 years)
Critical health citations
0
100% better than Pennsylvania average

Pennsylvania average: 0.3


Serious health citations
0
100% better than Pennsylvania average

Pennsylvania average: 0.6

0 critical citations Pennsylvania average: 0.3

0 serious citations Pennsylvania average: 0.6

7 moderate citations Pennsylvania average: 29.5

2 minor citations Pennsylvania average: 0.8
Citations history (last 3 years)
Quality of Care moderate citation Sep 20, 2024
Corrected

Quality of Care moderate citation Sep 20, 2024
Corrected

Care Planning moderate citation Sep 20, 2024
Corrected

Resident Rights minor citation Sep 20, 2024
Corrected

Staffing Data

Reporting period: October 1 – December 31, 2025 (Q4 2025). Source: CMS Payroll-Based Journal report.

Total staff 144
Employees 122
Contractors 22
Staff to resident ratio 1.73 : 1
5% fewer staff per resident than Pennsylvania average
Pennsylvania average ratio: 1.83 : 1 Pennsylvania average ratio: 1.83 : 1See full Pennsylvania ranking
Avg staff/day 62
Average shift 7.5 hours
0% compared with Pennsylvania average
Pennsylvania average: 7.8 hours Pennsylvania average shift: 7.8 hoursSee full Pennsylvania ranking
Total staff hours (quarter) 42,571

Nursing staff breakdown

Q4 2025 · Oct 1 – Dec 31 More info This data comes from the CMS Payroll-Based Journal report covering October 1 – December 31, 2025.
Registered Nurse

Manages medical care and health needs.

RN Staff Info 12 total: 7 full-time employees and 5 contractors. 12
Average shift length Info Average shift length. Calculated as total hours divided by days worked and average staff per day. 8.8 hours
Licensed Practical Nurse

Assists with medical care and medications.

LPN Staff Info 36 total: 35 full-time employees and 1 contractor. 36
Average shift length Info Average shift length. Calculated as total hours divided by days worked and average staff per day. 7.9 hours
Certified Nursing Assistant

Helps with daily care and mobility.

CNA Staff Info All 65 CNA Staff are full-time employees. No contractors work on this role. 65
Average shift length Info Average shift length. Calculated as total hours divided by days worked and average staff per day. 7.2 hours

Contractor staffing

Q4 2025 · Oct 1 – Dec 31 More info This data comes from the CMS Payroll-Based Journal report covering October 1 – December 31, 2025.

Total hours from contractors

9.8%

4,186 contractor hours this quarter

Registered Nurse: 5 Physical Therapy Aide: 4 Speech Language Pathologist: 4 Physical Therapy Assistant: 3 Respiratory Therapy Technician: 3 Qualified Social Worker: 2 Licensed Practical Nurse: 1

Staff by category

Q4 2025 · Oct 1 – Dec 31 More info This data comes from the CMS Payroll-Based Journal report covering October 1 – December 31, 2025.
Certified Nursing Assistant6506518,85592100%7.2
Licensed Practical Nurse3513611,99092100%7.9
Clinical Nurse Specialist6062,3477986%7.5
Registered Nurse75121,96592100%8.8
Other Dietary Services Staff4041,35992100%6.2
Respiratory Therapy Technician0339808390%7.5
Physical Therapy Assistant0339497278%7.4
Physical Therapy Aide0448336975%6.7
Speech Language Pathologist0448017379%6.8
Mental Health Service Worker2026996470%8
Nurse Practitioner1014856065%8.1
Qualified Social Worker0224536368%7.2
Administrator1014485661%8
Dietitian1014085155%8
65 Certified Nursing Assistant
% of Days 100%
36 Licensed Practical Nurse
% of Days 100%
6 Clinical Nurse Specialist
% of Days 86%
12 Registered Nurse
% of Days 100%
4 Other Dietary Services Staff
% of Days 100%
3 Respiratory Therapy Technician
% of Days 90%
3 Physical Therapy Assistant
% of Days 78%
4 Physical Therapy Aide
% of Days 75%
4 Speech Language Pathologist
% of Days 79%
2 Mental Health Service Worker
% of Days 70%
1 Nurse Practitioner
% of Days 65%
2 Qualified Social Worker
% of Days 68%
1 Administrator
% of Days 61%
1 Dietitian
% of Days 55%

Penalties and fines

Federal penalties imposed by CMS for regulatory violations, including civil money penalties (fines) and denials of payment for new Medicare/Medicaid admissions.

Source: CMS Penalties Database

No penalties in the past 3 years

No civil money penalties or payment denials were reported in the last 3 years.

Quality of care over time

These measures show how residents usually do over time at this home, based on health outcomes and preventive care.

High-risk clinical events score Info A composite score based on pressure ulcers, falls with injury, weight loss, walking ability decline, and activities of daily living decline. 10.4
5% better than Pennsylvania average

Pennsylvania average: 11.0

Functional decline score Info A composite score based on activities of daily living decline, walking ability decline, and incontinence. 23.6
6% worse than Pennsylvania average

Pennsylvania average: 22.2

Long-stay resident measures
Need for Help with Daily Activities Increased Info Percent of long-stay residents whose need for help with daily activities has increased 19.7%
In line with Pennsylvania average

Pennsylvania average: 19.0%

Walking Ability Worsened Info Percent of long-stay residents whose ability to move independently worsened 20.2%
In line with Pennsylvania average

Pennsylvania average: 21.1%

Low Risk Residents with Bowel/Bladder Incontinence Info Percent of low risk long-stay residents who lose control of their bowels or bladder 30.9%
16% worse than Pennsylvania average

Pennsylvania average: 26.7%

Falls with Major Injury Info Percent of long-stay residents experiencing one or more falls with major injury 4.3%
35% worse than Pennsylvania average

Pennsylvania average: 3.2%

High Risk Residents with Pressure Ulcers Info Percent of long-stay high risk residents with pressure ulcers 5.4%
In line with Pennsylvania average

Pennsylvania average: 5.5%

Urinary Tract Infection Info Percent of long-stay residents with a urinary tract infection 1.5%
16% better than Pennsylvania average

Pennsylvania average: 1.8%

Lost Too Much Weight Info Percent of long-stay residents who lose too much weight 2.4%
64% better than Pennsylvania average

Pennsylvania average: 6.6%

Depressive Symptoms Info Percent of long-stay residents who have depressive symptoms 0.4%
93% better than Pennsylvania average

Pennsylvania average: 5.5%

Antipsychotic Use Info Percent of long-stay residents who received an antipsychotic medication 20.4%
19% worse than Pennsylvania average

Pennsylvania average: 17.1%

Pneumococcal Vaccine Info Percent of long-stay residents assessed and appropriately given the pneumococcal vaccine 93.6%
8% better than Pennsylvania average

Pennsylvania average: 86.9%

Influenza Vaccine Info Percent of long-stay residents assessed and appropriately given the seasonal influenza vaccine 90.8%
In line with Pennsylvania average

Pennsylvania average: 93.5%

Short-stay resident measures
Pneumococcal Vaccine Info Percent of short-stay residents assessed and appropriately given the pneumococcal vaccine 82.1%
19% better than Pennsylvania average

Pennsylvania average: 68.8%

Antipsychotic medication increase Info Percent of short-stay residents who newly received an antipsychotic medication 2.4%
53% worse than Pennsylvania average

Pennsylvania average: 1.5%

Influenza Vaccine Info Percent of short-stay residents assessed and appropriately given the seasonal influenza vaccine 55.9%
19% worse than Pennsylvania average

Pennsylvania average: 68.7%

Breakdown by payment type

Medicare

42% of new residents, usually for short-term rehab.

Typical stay 21 days

Private pay

57% of new residents, often for short stays.

Typical stay 4 months

Medicaid

1% of new residents, often for long-term daily care.

Typical stay 19 - 20 years

Facility Characteristics

Source: CMS Long-Term Care Facility Characteristics (Data as of Jan 2026)

Total residents 83
Medicare
4
4.8% of residents
Medicaid
35
42.2% of residents
Private pay or other
44
53% of residents
Programs & Services
Residents Group

Residents meet regularly to discuss policies, care quality, and activities

CCRC

Part of a Continuing Care Retirement Community offering multiple care levels

Active Resident Council

Organized group of residents that meets regularly to discuss facility policies, quality of life, and activities.

Finances and operations

Based on CMS SNF Cost Report for fiscal year ending in 12/2023.

Governmental community
Operated by state authorities.
Net patient revenue Info Net patient revenue — what the home actually collects for resident care, after contractual allowances, bad debt and discounts are subtracted from its gross charges (CMS cost report, Worksheet G-3). It covers resident care only; money the home earns from other sources is shown separately as "Other income."
$14.5M
Net patient income Info Net patient income: net patient revenue minus the home's total operating expenses. A positive figure means it earns more from resident care than it spends to deliver it; a negative figure means the opposite. It excludes non-operating "other income."
-$1.8M
Governmental community Operated by state authorities.
Net patient revenue Info Net patient revenue — what the home actually collects for resident care, after contractual allowances, bad debt and discounts are subtracted from its gross charges (CMS cost report, Worksheet G-3). It covers resident care only; money the home earns from other sources is shown separately as "Other income."
$14.5M Rank #132 / 209Revenue — State benchmarkedThis home is ranked 132nd out of 209 homes in Pennsylvania. Shows this facility's annual revenue compared to the Pennsylvania average. Higher revenue generally means more resources for staffing and capital — read alongside Payroll %.Rankings are based only on facilities in Pennsylvania that report data for that category. Facilities without available data are excluded from the ranking.Click the rank badge to see the full State ranking.Click here to see the full State ranking.
Net patient income Info Net patient income: net patient revenue minus the home's total operating expenses. A positive figure means it earns more from resident care than it spends to deliver it; a negative figure means the opposite. It excludes non-operating "other income."
-$1.8M
Other income Info Money the home earns outside of resident care — such as investments, grants, rentals and other non-operating sources (CMS cost report, Worksheet G-3). It is tracked separately from net patient revenue: it is not part of that figure, and it is not included in net patient income.
$769.4K
Payroll costs Info Staff salaries plus wage-related costs — benefits such as payroll taxes, health insurance and retirement — from the home's own accounting records (CMS cost report, Worksheet A). Contract or agency labor is counted separately, under other operating costs. Rank #115 / 209Payroll — State benchmarkedThis home is ranked 115th out of 209 homes in Pennsylvania. Shows total annual staff payroll benchmarked to the Pennsylvania average. Higher payroll investment relative to peers often signals better staffing and less reliance on cheaper contract labor.Rankings are based only on facilities in Pennsylvania that report data for that category. Facilities without available data are excluded from the ranking.Click the rank badge to see the full State ranking.Click here to see the full State ranking.
$6.7M 46.4% of net patient revenue Info Payroll as a share of revenue: staff salaries and wage-related benefits divided by net patient revenue. A higher figure means more of each revenue dollar goes to staff pay. Rank #91 / 209Payroll % — State benchmarkedThis home is ranked 91st out of 209 homes in Pennsylvania. Shows payroll as a percentage of revenue versus the Pennsylvania average. Well-run Pennsylvania facilities typically land around 53–61% — the top third Statewide. Below 25% may signal understaffing or heavy agency use — read with Staffing ratings.Rankings are based only on facilities in Pennsylvania that report data for that category. Facilities without available data are excluded from the ranking.Click the rank badge to see the full State ranking.Click here to see the full State ranking.
Other operating costs Info Everything it costs to run the home apart from payroll — food, utilities, supplies, maintenance, contract labor and administration. Calculated as total operating expense minus payroll (staff salaries and wage-related benefits).
$9.5M
Total costs Info The home's total operating expense for the year — all the costs of running it, salaries included (CMS cost report, Worksheet G-3).
$16.2M

What does this home offer?

Pets allowed icon
Pets allowed icon

Pets Allowed

Building type icon
Building type icon

Building Type: Single-story

Transportation services icon

Transportation Services

Fitness and recreation icon

Fitness and Recreation

Who this home usually serves

TYPE OF STAY

Mix of rehab and long-term care

This home supports both short-term rehab and long-term care, with residents staying for a wide range of durations.

Most new residents arrive under private pay (57% of admissions), and a typical private pay stay runs around 4 months.

Admissions
240 total

Coverage residents most often arrive under.

Medicare 42%
Private pay 57%
Medicaid 1%
Discharges
243 total

Coverage residents most often leave under.

Medicare 39%
Private pay 59%
Medicaid 1%

Places of interest near Spang Crest

Address 7.9 miles from city center Info Estimated distance in miles from Lebanon's city center to Spang Crest's address, calculated via Google Maps. — 0.93 miles to nearest hospital (WellSpan Good Samaritan Hospital)

Calculate Travel Distance to Spang Crest

Add your location

Address

Compare Nursing Homes around Pennsylvania

The information below is reported by the Pennsylvania Department of Human Services and Department of Health.

5 facilities compared · CMS & PA Dept. of Health data

Lima Estates
NH
AL
IL
MC
Media
60
Facility 60
PA AVG 94
Rank #399 / 555
62.3%
Facility 62.3%
PA AVG 78.7%
Rank #336 / 518
-21%
4.54
Facility 4.54
PA AVG 4.15
Rank #78 / 207
+122%+10%
$0
Facility $0
PA AVG $61.2k
Rank #1 / 210
----5A+
24
Facility 24
PA AVG 46
Rank #511 / 668
-
$16.5M
Facility $16.5M
PA AVG $32.8M
Rank #113 / 209
$8.3M
Facility $8.3M
PA AVG $6.7M
Rank #134 / 209
50.7%
Facility 50.7%
PA AVG 40%
Rank #165 / 209
395492
Kirkland Village
NH
AL
HC
IL
MC
RC
Bethlehem
64
Facility 64
PA AVG 94
Rank #383 / 555
46.9%
Facility 46.9%
PA AVG 78.7%
Rank #454 / 518
-40%
4.30
Facility 4.30
PA AVG 4.15
Rank #90 / 207
+46%+4%
$21.6k
Facility $21.6k
PA AVG $61.2k
Rank #176 / 210
84
Facility 84
PA AVG 83
Rank #220 / 460
8
Facility 8
PA AVG 31.3
Rank #53 / 207
4.0
Facility 4.0
PA AVG 4.4
Rank #115 / 207
-30A+
12
Facility 12
PA AVG 46
Rank #591 / 668
Presbyterian Homes, Inc
$26.2M
Facility $26.2M
PA AVG $32.8M
Rank #68 / 209
$8.9M
Facility $8.9M
PA AVG $6.7M
Rank #123 / 209
34.1%
Facility 34.1%
PA AVG 40%
Rank #194 / 209
395916
Freedom Village at Brandywine
NH
AL
IL
MC
RC
Coatesville
60
Facility 60
PA AVG 94
Rank #399 / 555
90.9%
Facility 90.9%
PA AVG 78.7%
Rank #48 / 518
+15%
4.23
Facility 4.23
PA AVG 4.15
Rank #99 / 207
+31%+2%
$0
Facility $0
PA AVG $61.2k
Rank #1 / 210
-
5
Facility 5
PA AVG 31.3
Rank #31 / 207
1.7
Facility 1.7
PA AVG 4.4
Rank #27 / 207
-46A+
9
Facility 9
PA AVG 46
Rank #603 / 668
Danielle Geyer
$12.5M
Facility $12.5M
PA AVG $32.8M
Rank #42 / 209
$14.5M
Facility $14.5M
PA AVG $6.7M
Rank #55 / 209
116%
Facility 116%
PA AVG 40%
Rank #170 / 209
396062
Barclay Friends
NH
AL
MC
RC
West Chester (North Franklin Street)
103
Facility 103
PA AVG 94
Rank #196 / 555
49.5%
Facility 49.5%
PA AVG 78.7%
Rank #438 / 518
-37%
4.70
Facility 4.70
PA AVG 4.15
Rank #62 / 207
+12%+13%
$9.4k
Facility $9.4k
PA AVG $61.2k
Rank #154 / 210
74
Facility 74
PA AVG 83
Rank #348 / 460
1
Facility 1
PA AVG 31.3
Rank #1 / 207
1.0
Facility 1.0
PA AVG 4.4
Rank #1 / 207
-61A+
35
Facility 35
PA AVG 46
Rank #421 / 668
Barclay Friends
$19.0M
Facility $19.0M
PA AVG $32.8M
Rank #98 / 209
$11.7M
Facility $11.7M
PA AVG $6.7M
Rank #70 / 209
61.7%
Facility 61.7%
PA AVG 40%
Rank #56 / 209
395848
Spang Crest
NH
AL
Lebanon
105
Facility 105
PA AVG 94
Rank #186 / 555
80.4%
Facility 80.4%
PA AVG 78.7%
Rank #146 / 518
+2%
3.77
Facility 3.77
PA AVG 4.15
Rank #148 / 207
-31%-9%
$0
Facility $0
PA AVG $61.2k
Rank #1 / 210
-
9
Facility 9
PA AVG 31.3
Rank #60 / 207
2.3
Facility 2.3
PA AVG 4.4
Rank #48 / 207
-101A
71
Facility 71
PA AVG 46
Rank #135 / 668
Daniel Deitzel
$14.5M
Facility $14.5M
PA AVG $32.8M
Rank #132 / 209
$6.7M
Facility $6.7M
PA AVG $6.7M
Rank #115 / 209
46.4%
Facility 46.4%
PA AVG 40%
Rank #91 / 209
395365

Financial Assistance for
Nursing Home in Pennsylvania

Spang Crest is located in Lebanon, Pennsylvania.
Here are the financial assistance programs available to residents in Pennsylvania.

Get Financial aid guidance

Community HealthChoices (CHC)

PA Medicaid CHC

Age 65+ or disabled
General Pennsylvania resident, Medicaid-eligible, nursing home-level care need.
Income Limits (2025) ~$2,829/month 300% FBR, individual
Asset Limits $2,000 (individual), $3,000 (couple) (excludes home, car).
PA

Managed care model; high urban demand (e.g., Philadelphia, Pittsburgh).

Benefits
Personal care (5-7 hours/day, e.g., bathing, dressing) Respite care (up to 240 hours/year) Adult day care ($70/day) Home modifications ($1,500 avg.)

Pennsylvania OPTIONS Program

PA OPTIONS

Age 60+
General Pennsylvania resident, at risk of nursing home placement.
Income Limits ~$2,000/month individual, varies by region
Asset Limits $8,000 individual
PA

Cost-sharing required above certain income; rural/urban balance.

Benefits
In-home care (3-5 hours/week) Respite (up to 10 days/year) Adult day care (~$70/day) Transportation (~5 trips/month)

Living Independence for the Elderly (LIFE)

Pennsylvania LIFE (PACE)

Age 55+
General PA resident (specific counties), NFLOC, safe with LIFE support.
Income Limits (2025) ~$2,829/month (Medicaid-eligible); private pay option available.
Asset Limits $2,000 (individual), $3,000 (couple) for Medicaid enrollees.
PA

16 providers in 25 counties (e.g., Allegheny, Luzerne); LIFE branding unique to PA.

Benefits
Personal care (5-7 hours/day) Medical care Meals Transportation Respite Therapies

Medicare Savings Program (MSP)

Pennsylvania Medicare Savings Program

Age 65+ or disabled
General PA resident, Medicare Part A/B.
Income Limits (2025) ~$2,510/month (QMB), ~$3,380/month (SLMB), ~$3,598/month (QI)—individual.
Asset Limits $9,430 (individual), $14,130 (couple).
PA

Three tiers; includes Extra Help for Part D; no waitlist.

Benefits
Covers Part B premiums ($174.70/month) Deductibles ($240/year) Copays (~20%)

Family Caregiver Support Program (FCSP)

Pennsylvania Family Caregiver Support Program

Age
General Caregivers of 60+ needing care or 55+ caregivers of others; PA resident; functional needs (2+ ADLs).
Income Limits (2025) No strict cap; reimbursements up to $600/month if care recipient income < ~$2,322/month 185% FPL
Asset Limits Not assessed; need-based.
PA

High demand; includes grandparent caregivers.

Benefits
Respite (4-6 hours/week or 5 days/year) Adult day care ($60/day) Supplies (~$2,000/year) Caregiver training

VA Aid and Attendance (A&A) and Housebound Benefits

Pennsylvania VA Aid and Attendance/Housebound

Age 65+ or disabled veteran/spouse
General PA resident, wartime service, need for ADL help (A&A) or homebound.
Income Limits (2025) Net income < ~$1,984/month (veteran with dependent, A&A); pension offsets income.
Asset Limits ~$155,356 net worth limit
PA

High veteran population; supports rural/urban care needs.

Benefits
Cash (~$1,433-$2,642/month veteran, ~$951-$1,318 spouse) for care costs (e.g., in-home, assisted living)

Property Tax/Rent Rebate Program (PTRR)

Pennsylvania Property Tax/Rent Rebate Program

Age 65+
General PA resident, homeowner/renter (or widow/er 50+, disabled 18+).
Income Limits (2025) ~$45,000/year individual or couple, excludes half of Social Security
Asset Limits Not assessed; income-focused.
PA

Rebates up to $1,000; ~600,000 eligible annually.

Benefits
Rebates ($250-$1,000 based on income; e.g., $1,000 if income < $8,000)

Senior Farmers’ Market Nutrition Program (SFMNP)

Pennsylvania SFMNP

Age 60+
General PA resident, low-income.
Income Limits (2025) ~$2,322/month individual, 185% FPL
Asset Limits Not assessed.
PA

Vouchers (~$50/season) via 52 AAAs; serves ~200,000 annually.

Benefits
Vouchers (~$50/season) for fresh produce at approved markets

Frequently Asked Questions about Spang Crest

Is Spang Crest in a walkable area?

Spang Crest has a walk score of 71. Very walkable. Most errands can be accomplished on foot, and many essentials are within a short walk.

What is the occupancy rate at Spang Crest?

Spang Crest's occupancy is 80.4%.

Are there photos of Spang Crest?

Yes — there are 4 photos of Spang Crest in the photo gallery on this page.

What is the address of Spang Crest?

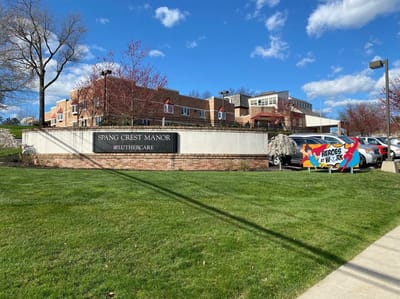
Spang Crest is located at 945 Duke St, Lebanon, PA 17042.

What is the phone number of Spang Crest?

(717) 274-1495 will put you in contact with the team at Spang Crest.

Is Spang Crest Medicare or Medicaid certified?

Yes — Spang Crest is a CMS-certified provider of Medicare and Medicaid.

Guides for Better Senior Living

Care Cost Calculator: See Prices in Your Area

Nursing Home Data Explorer

Don’t Wait Too Long: 7 Red Flag Signs Your Parent Needs Assisted Living Now

The True Cost of Assisted Living in 2025 – And How Families Are Paying For It

Understanding Senior Living Costs: Pricing Models, Discounts & Financial Assistance