Spanish Meadows
Nursing Home & Assisted Living · Texas, TX
CMS overall rating Info CMS (the Centers for Medicare & Medicaid Services) is the federal agency that rates nursing home quality. Its Overall Rating runs from 1 to 5 stars, combining health inspections, staffing, and quality measures, with inspections weighted most heavily.

Spanish Meadows

Nursing Home & Assisted Living · Texas, TX
CMS overall rating Info CMS (the Centers for Medicare & Medicaid Services) is the federal agency that rates nursing home quality. Its Overall Rating runs from 1 to 5 stars, combining health inspections, staffing, and quality measures, with inspections weighted most heavily.
Calculator: See prices in your area
Spanish Meadows accepts Medicaid, Medicare, and private pay.

Overview of Spanish Meadows

Spanish Meadows has been serving the lower Rio Grande Valley community for over 30 years. The facility comprises a Rehabilitation Center, an Assisted Living facility, and a Long Term Care Nursing Unit. It provides excellent care in a warm and supportive environment.
(956) 546-7378

Quality ratings

Measured by Centers for Medicare & Medicaid Services (CMS)

Overall rating Info The Overall CMS Rating combines results from health inspections, staffing levels and quality measures. Health inspections carry the most weight. Staffing and quality scores can increase or decrease the final rating based on performance compared to state and national standards.
▼ 33.6% Below TX avg. ▼ 33.6% Below TX avg.TX average: 3.0Click the badge to see the full State ranking.Click here to see the full State ranking.
Health Inspection Info Based on the results of the facility's three most recent standard inspections and any complaint investigations. CMS reviews the number, scope, and severity of deficiencies, with more recent findings weighted more heavily.
▲ 3.8% Above TX avg. ▲ 3.8% Above TX avg.TX average: 2.9Click the badge to see the full State ranking.Click here to see the full State ranking.
Staffing Info Measures average nursing staff hours per resident per day, including Registered Nurses (RNs) and total nursing staff. Ratings are adjusted based on the level of care residents require and are compared to state and national benchmarks.
▼ 58.3% Below TX avg. ▼ 58.3% Below TX avg.TX average: 2.4Click the badge to see the full State ranking.Click here to see the full State ranking.
Quality Measures Info Based on clinical and physical health indicators reported to CMS, such as hospital readmissions, falls, pressure ulcers, and improvements in mobility. These measures reflect how well residents' health needs are being managed.
At TX avg. At TX avg.TX average: 4.0Click the badge to see the full State ranking.Click here to see the full State ranking.

Staffing hours breakdown

Info Daily nursing hours per resident by staff type, reported to CMS. Higher is generally better — compare this facility to state and national averages to see where staffing stands.

Hours per resident per day — compared to Texas state averages

Total nursing care / resident Info This home is ranked 231st out of 289 homes in Texas for nurse hours. Total adjusted nursing hours per resident per day, combining RN, LPN, and aide time. CMS adjusts this for case-mix so facilities can be fairly compared.
3h 8m per day
Rank #231 / 289Nurse hours — State benchmarkedThis home is ranked 231st out of 289 homes in Texas. Shows adjusted nurse hours per resident per day benchmarked to the Texas average, with a ranking across 289 Texas facilities. More hours mean more direct care. The national average is about 3.5 hrs; below 3.0 is a red flag.Click the rank badge to see the full State ranking.Click here to see the full State ranking.
This facility Texas avg (3h 47m per day)
vs Texas avg
-17%

5 of 6 metrics below state avg

Standout metric LPN / LVN is +35% above state avg
Staff typeHours / Day / Residentvs state avg
Registered Nurse (RN) Info RNs hold the highest nursing license and can assess residents, interpret test results, and direct care plans. More RN hours per day often signals stronger clinical oversight and faster response to health changes. 10m per day ▼ 63% State avg: 26m per day · National avg: 41m per day
LPN / LVN Info Licensed Practical Nurses (LPNs) or Licensed Vocational Nurses (LVNs) deliver routine hands-on care — medication administration, wound dressing, and monitoring vital signs. They work under RN supervision and make up a large share of daily bedside care. 1h 17m per day ▲ 35% State avg: 57m per day · National avg: 52m per day
Nurse Aide Info Certified Nurse Aides (CNAs) provide the most direct day-to-day assistance: bathing, dressing, feeding, and mobility. Nurse aide hours are typically the largest staffing category and directly affect residents' quality of life. 1h 52m per day ▼ 7% State avg: 2h 1m per day · National avg: 2h 20m per day
Weekend Total Nursing Info Combined nursing hours (RN + LPN + Nurse Aide) per resident per day on weekends. Staffing often drops on weekends — this figure reveals whether the facility maintains adequate coverage outside of weekday hours. 2h 53m per day ▼ 3% State avg: 2h 59m per day · National avg: 3h 26m per day
Physical Therapist Info Hours per resident per day provided by licensed Physical Therapists (PTs) or PT Assistants. PT services help residents recover mobility after injury or illness and are especially important for post-acute (short-stay) rehabilitation. 4m per day ▼ 6% State avg: 4m per day · National avg: 4m per day
Weekend RN Info Registered nurse hours specifically on weekends. Facilities sometimes reduce RN presence on Saturdays and Sundays — a low weekend RN figure compared to weekday hours can indicate reduced clinical oversight when most administrative staff are absent. 6m per day ▼ 72% State avg: 20m per day · National avg: 28m per day

Capacity and availability

Avg. Length of Stay
128 days
Bed community size
120-bed community Rank #210 / 988Bed count — State benchmarkedThis home is ranked 210th out of 988 homes in Texas. Shows this facility's certified or reported bed count compared to other Texas facilities. Larger communities may offer more amenities, programs, and on-site services for residents and families.Click the rank badge to see the full State ranking.Click here to see the full State ranking.
A larger shared setting that may offer more common spaces and organized community services.
Walk Score
Walk Score: 2 / 100 Rank #1336 / 1391Walk Score — State benchmarkedThis home is ranked 1336th out of 1391 homes in Texas. Shows how walkable this facility's neighborhood is compared to the average Walk Score across Texas facilities. Higher scores benefit residents, families, and staff.Click the rank badge to see the full State ranking.Click here to see the full State ranking.
Car-dependent. Most errands require a car, with limited nearby walkable options.

About this community

Occupancy

Occupancy rate
84%
Rank #40 / 297Occupancy rate — State benchmarkedThis home is ranked 40th out of 297 homes in Texas. Shows this facility's occupancy rate versus the Texas average, with its Statewide rank out of 297. Higher occupancy signals strong local demand and financial stability.Click the rank badge to see the full State ranking.Click here to see the full State ranking.
Higher than the Texas average: 63.5%
Occupied beds
101 / 120
Average occupied beds in Texas homes 75 beds

License Details

Facility TypeType A
StatusLicensed
CountyCameron
CMS Certification Number455802
QualificationNursing

Ownership & Operating Entity

Spanish Meadows is legally operated by Empire Spanish Meadows, Ltd..

OwnerEMPIRE SPANISH MEADOWS, LTD.
Owner NameEmpire Spanish Meadows, Ltd.

Therapy & Rehabilitation

2 services
Rehabilitation Services
Short-Term Rehab

Staffing & Medical

1 service
24-Hour Staffing

Memory & Specialized Care

1 service
No Alzheimer's certification

Additional Services

1 service
Long Term Care Nursing

Amenities & Lifestyle

Specific ProgramsRespiratory Care and Ventilator Unit, Nursing Center

Contact Spanish Meadows

Inspection History

In Texas, the Health and Human Services Commission (HHSC) is the primary regulatory body that conducts unannounced inspections and publishes quality reports for all long-term care homes.

Since 2024 · 2 years of data 2 citations

Inspection Scorecard Info This scorecard compares key inspection, citation, and complaint metrics at this facility against the Texas state average. Metrics rated ≥15% worse than average are highlighted in red; those ≥15% better are highlighted in green.

Since 2024 vs. Texas state average
Overall vs. TX average 0 Worse No metrics in this bucket. 1 At Avg Metrics at Texas average:
• Health citations (at TX avg)
3 Better Metrics better than Texas average:
• Total citations (67% below)
• Life safety citations (67% below)
• Citations per year (67% below)
Latest Inspection January 5, 2024 Annual Inspection

Citations Info Citations are formal regulatory issues recorded during state inspections.

This FacilityTX Averagevs. TX Avg
Total citations Info Formal regulatory issues recorded by inspectors across all inspection types. 26 This facility has 67% fewer total citations than a typical Texas nursing home (2 vs. TX avg 6).↓ 67% better
Health citations Info Violations related to resident care, clinical practices, and day-to-day operations. 22 This facility has health citations in line with the Texas average (2 vs. TX avg 2).— At avg
Life safety citations Info Violations related to building safety — fire prevention, emergency egress, and similar. 26 This facility has 67% fewer life safety citations than a typical Texas nursing home (2 vs. TX avg 6).↓ 67% better
Citations per year Info Average citations per year since 2024. 13 This facility has 67% fewer citations per year than a typical Texas nursing home (1 vs. TX avg 3).↓ 67% better

Inspection Reports Summary Info An editor-reviewed summary of the themes and findings across this facility's recent inspection reports.

  • The January 5, 2024 inspection found no health or life safety code violations and no deficiencies of any kind.
  • No complaints were filed or substantiated in the most recent inspection period.
  • The facility’s record shows consistent compliance with state standards and no cited deficiencies.

Health Inspection History

Inspections since 2022
Total health inspections 10

Texas average 7.4


Last Health inspection on Sep 2025
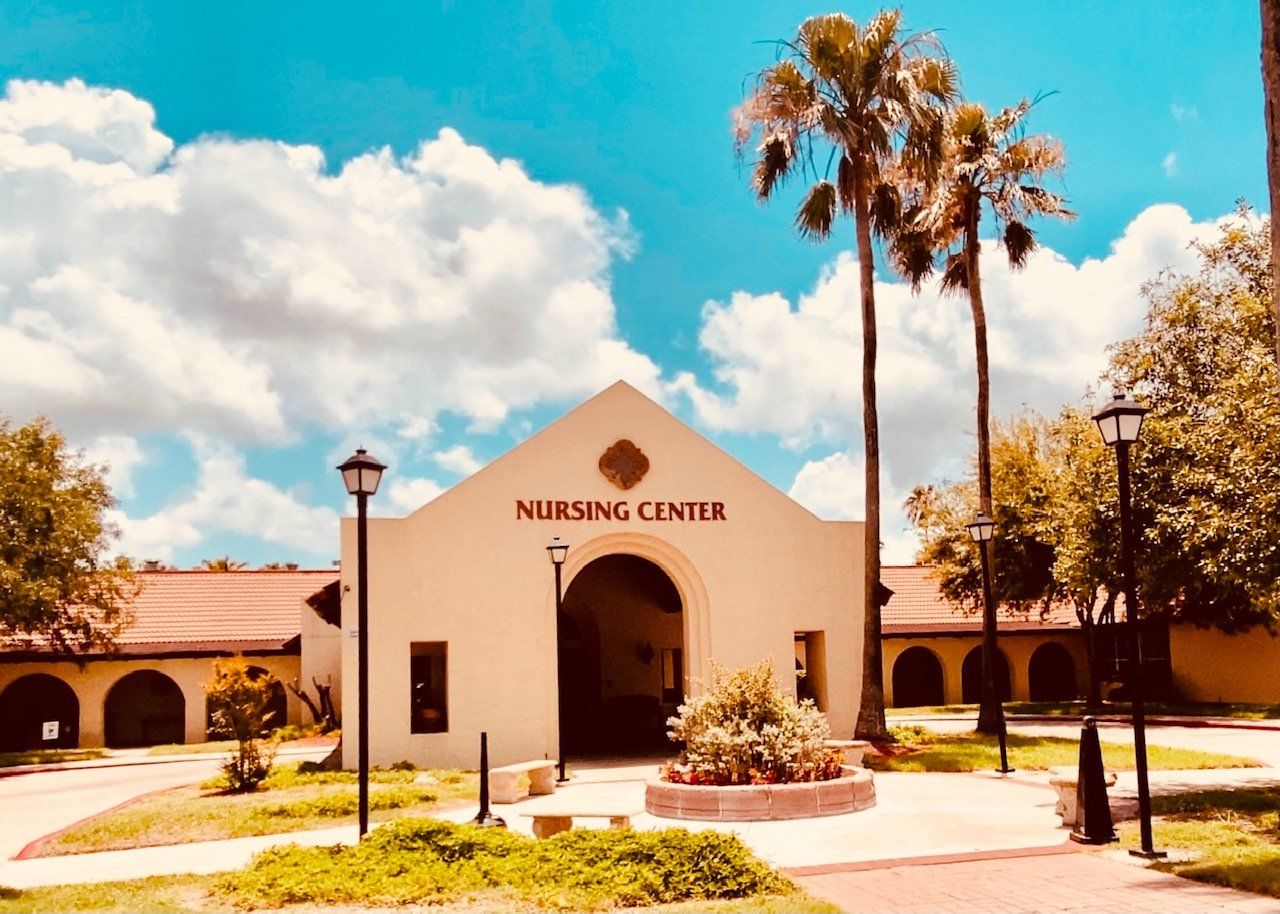
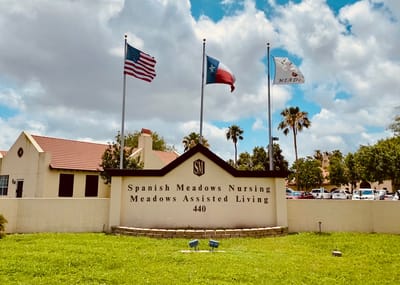
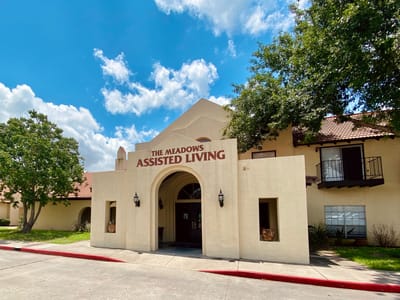
Total health citations
26 Rank #190 / 292Health citations — State benchmarkedThis home is ranked 190th out of 292 homes in Texas. Shows this facility's total health deficiency citations benchmarked to the Texas State average, with a ranking across all 292 TX facilities. Lower citation counts earn a better rank.Click the rank badge to see the full State ranking.Click here to see the full State ranking.

Texas average 25.9

Citations per inspection
2.6 Rank #71 / 292Citations per inspection — State benchmarkedThis home is ranked 71st out of 292 homes in Texas. Shows average deficiency citations per CMS inspection for this facility versus the Texas mean across 292 facilities with citation data. Lower is better.Click the rank badge to see the full State ranking.Click here to see the full State ranking.

Texas average 3.67


Health citations are formal notices following inspections when they fail to comply with safety and care standards.

15 of 26 citations resulted from standard inspections; 9 of 26 resulted from complaint investigations; and 2 of 26 came from combined inspections (standard and complaint).

Breakdown of citation severity (last 4 years)
Critical health citations
1
50% better than Texas average

Texas average: 2


Serious health citations
1
150% worse than Texas average

Texas average: 0.4

1 critical citation Texas average: 2

1 serious citation Texas average: 0.4

23 moderate citations Texas average: 23

1 minor citation Texas average: 0.4
Citations history (last 4 years)
Care Planning moderate citation Sep 16, 2025
Corrected

Care Planning moderate citation Sep 16, 2025
Corrected

Resident Rights moderate citation Mar 07, 2025
Corrected

Quality of Care critical citation Nov 26, 2024
Corrected

Staffing Data

Reporting period: October 1 – December 31, 2025 (Q4 2025). Source: CMS Payroll-Based Journal report.

Total staff 109
Employees 106
Contractors 3
Staff to resident ratio 1.17 : 1
21% fewer staff per resident than Texas average
Texas average ratio: 1.48 : 1 Texas average ratio: 1.48 : 1See full Texas ranking
Avg staff/day 50
Average shift 7.9 hours
0% compared with Texas average
Texas average: 8.1 hours Texas average shift: 8.1 hoursSee full Texas ranking
Total staff hours (quarter) 36,144

Nursing staff breakdown

Q4 2025 · Oct 1 – Dec 31 More info This data comes from the CMS Payroll-Based Journal report covering October 1 – December 31, 2025.
Registered Nurse

Manages medical care and health needs.

RN Staff Info All 4 RN Staff are full-time employees. No contractors work on this role. 4
Average shift length Info Average shift length. Calculated as total hours divided by days worked and average staff per day. 7.7 hours
Licensed Practical Nurse

Assists with medical care and medications.

LPN Staff Info All 23 LPN Staff are full-time employees. No contractors work on this role. 23
Average shift length Info Average shift length. Calculated as total hours divided by days worked and average staff per day. 8.8 hours
Certified Nursing Assistant

Helps with daily care and mobility.

CNA Staff Info All 32 CNA Staff are full-time employees. No contractors work on this role. 32
Average shift length Info Average shift length. Calculated as total hours divided by days worked and average staff per day. 8.3 hours

Contractor staffing

Q4 2025 · Oct 1 – Dec 31 More info This data comes from the CMS Payroll-Based Journal report covering October 1 – December 31, 2025.

Total hours from contractors

0.5%

189 contractor hours this quarter

Occupational Therapy Aide: 1 Occupational Therapy Assistant: 1 Medical Director: 1

Staff by category

Q4 2025 · Oct 1 – Dec 31 More info This data comes from the CMS Payroll-Based Journal report covering October 1 – December 31, 2025.
Certified Nursing Assistant3203212,58692100%8.3
Licensed Practical Nurse230238,33392100%8.8
Qualified Activities Professional8082,53792100%9.3
Medication Aide/Technician6062,50992100%9
RN Director of Nursing5052,0007480%8.1
Qualified Social Worker5051,1726571%6.1
Physical Therapy Aide4041,1186571%6.7
Speech Language Pathologist6061,0518188%4.4
Registered Nurse4047789098%7.7
Other Dietary Services Staff2027018795%7.9
Nurse Practitioner1015126470%8
Mental Health Service Worker1015126470%8
Respiratory Therapy Technician1015047177%7.1
Dietitian1014966368%7.9
Occupational Therapy Aide1124815762%7.6
Administrator2024405560%8
Physical Therapy Assistant3031856571%2.8
Dental Services Staff1011123538%3.2
Occupational Therapy Assistant011824751%1.7
Medical Director011351314%2.7
32 Certified Nursing Assistant
% of Days 100%
23 Licensed Practical Nurse
% of Days 100%
8 Qualified Activities Professional
% of Days 100%
6 Medication Aide/Technician
% of Days 100%
5 RN Director of Nursing
% of Days 80%
5 Qualified Social Worker
% of Days 71%
4 Physical Therapy Aide
% of Days 71%
6 Speech Language Pathologist
% of Days 88%
4 Registered Nurse
% of Days 98%
2 Other Dietary Services Staff
% of Days 95%
1 Nurse Practitioner
% of Days 70%
1 Mental Health Service Worker
% of Days 70%
1 Respiratory Therapy Technician
% of Days 77%
1 Dietitian
% of Days 68%
2 Occupational Therapy Aide
% of Days 62%
2 Administrator
% of Days 60%
3 Physical Therapy Assistant
% of Days 71%
1 Dental Services Staff
% of Days 38%
1 Occupational Therapy Assistant
% of Days 51%
1 Medical Director
% of Days 14%

Penalties and fines

Includes penalties issued in 2023-2024

Federal penalties imposed by CMS for regulatory violations, including civil money penalties (fines) and denials of payment for new Medicare/Medicaid admissions.

Source: CMS Penalties Database (Data as of Jan 2026)

Total fines amount $15K Rank #157 / 294Federal fines — State benchmarkedThis home is ranked 157th out of 294 homes in Texas. Shows this facility's cumulative CMS federal fine dollars versus the Texas average among facilities with fines, and where it ranks among 294 facilities in the pool. Lower total dollars mean a better rank.Click the rank badge to see the full State ranking.Click here to see the full State ranking.
82% lower than Texas average

Texas average: $80K

Number of fines 2
20% fewer fines than Texas average

Texas average: 2.5

Payment Denials Info Serious action where Medicare and/or Medicaid temporarily stops payments for new residents until issues are fixed. 1
354% more payment denials than Texas average

Texas average: 0.2

Fines amount comparison
This facility $15K
Texas average $80K
Penalty History

Penalties are imposed by CMS for violations of federal nursing home regulations.

3 penalties in the past 3 years

Multiple penalties were reported in the last 3 years.

Civil Money Penalty Info Fines imposed for noncompliance, which can be assessed per day or per instance of violation. Oct 17, 2024
$11K
Civil Money Penalty Info Fines imposed for noncompliance, which can be assessed per day or per instance of violation. Aug 14, 2023
$4K
Payment Denial Info Serious action where Medicare and/or Medicaid temporarily stops payments for new residents until issues are fixed. Aug 14, 2023
22 days

Last updated: Jan 2026

Quality of care over time

These measures show how residents usually do over time at this home, based on health outcomes and preventive care.

High-risk clinical events score Info A composite score based on pressure ulcers, falls with injury, weight loss, walking ability decline, and activities of daily living decline. 15.0
74% worse than Texas average

Texas average: 8.6

Functional decline score Info A composite score based on activities of daily living decline, walking ability decline, and incontinence. 28.4
77% worse than Texas average

Texas average: 16.0

Long-stay resident measures
Below average Texas avg: 4.1 Info CMS star rating based on long-stay quality measure performance. 5 stars = significantly above average, 1 star = significantly below average.
Need for Help with Daily Activities Increased Info Percent of long-stay residents whose need for help with daily activities has increased 21.4%
32% worse than Texas average

Texas average: 16.2%

Walking Ability Worsened Info Percent of long-stay residents whose ability to move independently worsened 42.7%
164% worse than Texas average

Texas average: 16.2%

Low Risk Residents with Bowel/Bladder Incontinence Info Percent of low risk long-stay residents who lose control of their bowels or bladder 20.9%
34% worse than Texas average

Texas average: 15.7%

Falls with Major Injury Info Percent of long-stay residents experiencing one or more falls with major injury 1.0%
70% better than Texas average

Texas average: 3.2%

High Risk Residents with Pressure Ulcers Info Percent of long-stay high risk residents with pressure ulcers 5.1%
16% worse than Texas average

Texas average: 4.4%

Urinary Tract Infection Info Percent of long-stay residents with a urinary tract infection 3.0%
271% worse than Texas average

Texas average: 0.8%

Lost Too Much Weight Info Percent of long-stay residents who lose too much weight 4.9%
41% worse than Texas average

Texas average: 3.5%

Depressive Symptoms Info Percent of long-stay residents who have depressive symptoms 0.0%
100% better than Texas average

Texas average: 2.9%

Antipsychotic Use Info Percent of long-stay residents who received an antipsychotic medication 15.6%
97% worse than Texas average

Texas average: 7.9%

Pneumococcal Vaccine Info Percent of long-stay residents assessed and appropriately given the pneumococcal vaccine 75.9%
22% worse than Texas average

Texas average: 97.3%

Influenza Vaccine Info Percent of long-stay residents assessed and appropriately given the seasonal influenza vaccine 98.8%
In line with Texas average

Texas average: 97.9%

Hospitalizations per 1,000 days Info Number of hospitalizations per 1,000 long-stay resident days. 1.87
12% better than Texas average

Texas average: 2.13

ED visits per 1,000 days Info Number of outpatient emergency department visits per 1,000 long-stay resident days. 1.79
14% better than Texas average

Texas average: 2.07

Short-stay resident measures
Significantly above average Texas avg: 3.1 Info CMS star rating based on short-stay quality measure performance. 5 stars = much above average, 1 star = much below average.
Pneumococcal Vaccine Info Percent of short-stay residents assessed and appropriately given the pneumococcal vaccine 95.1%
5% better than Texas average

Texas average: 90.4%

Antipsychotic medication increase Info Percent of short-stay residents who newly received an antipsychotic medication 1.4%
7% better than Texas average

Texas average: 1.4%

Influenza Vaccine Info Percent of short-stay residents assessed and appropriately given the seasonal influenza vaccine 91.3%
In line with Texas average

Texas average: 88.0%

Re-hospitalized after SNF stay Info Percentage of short-stay residents who were re-hospitalized after their nursing home admission. 18.6%
28% better than Texas average

Texas average: 25.9%

Emergency department visits Info Percentage of short-stay residents who had an outpatient emergency department visit. 3.5%
71% better than Texas average

Texas average: 12.0%

Falls with major injury Info Percentage of SNF residents who experience falls with major injury during their stay. 0.0%
100% better than Texas average

Texas average: 0.8%

Ability to care for self at discharge Info Percentage of residents at or above expected ability to care for themselves at discharge. 76.0%
42% better than Texas average

Texas average: 53.7%

Successful return to home or community Info Rate of successful return to home or community from a skilled nursing facility. 51.1%
In line with Texas average

Texas average: 50.6%

Breakdown by payment type

Medicare

22% of new residents, usually for short-term rehab.

Typical stay 1 - 2 months

Private pay

61% of new residents, often for short stays.

Typical stay 1 - 2 months

Medicaid

16% of new residents, often for long-term daily care.

Typical stay 1 - 2 years

Facility Characteristics

Source: CMS Long-Term Care Facility Characteristics (Data as of Jan 2026)

Total residents 93
Medicare
18
19.4% of residents
Medicaid
58
62.4% of residents
Private pay or other
17
18.3% of residents
Programs & Services
Residents Group

Residents meet regularly to discuss policies, care quality, and activities

Active Resident Council

Organized group of residents that meets regularly to discuss facility policies, quality of life, and activities.

Finances and operations

Based on the 2023 CMS SNF Cost Report.

Voluntary non-profit community
Home revenue
$15.4M
Operating deficit
-$1.2M
Voluntary non-profit community
Home revenue
$15.4M Rank #62 / 297Revenue — State benchmarkedThis home is ranked 62nd out of 297 homes in Texas. Shows this facility's annual revenue compared to the Texas average. Higher revenue generally means more resources for staffing and capital — read alongside Payroll %.Click the rank badge to see the full State ranking.Click here to see the full State ranking.
Operating deficit
-$1.2M
Payroll costs Info The portion of the home's budget spent on staff, including nurses, caregivers, and other employees who support care and operations. Rank #100 / 297Payroll — State benchmarkedThis home is ranked 100th out of 297 homes in Texas. Shows total annual staff payroll benchmarked to the Texas average. Higher payroll investment relative to peers often signals better staffing and less reliance on cheaper contract labor.Click the rank badge to see the full State ranking.Click here to see the full State ranking.
$6.0M
39% of revenue Rank #237 / 297Payroll % — State benchmarkedThis home is ranked 237th out of 297 homes in Texas. Shows payroll as a percentage of revenue versus the Texas average. Well-run Texas facilities typically land around 51–63% — the top third Statewide. Below 25% may signal understaffing or heavy agency use — read with Staffing ratings.Click the rank badge to see the full State ranking.Click here to see the full State ranking.
Other operating costs Info All remaining costs needed to run the home, such as food, utilities, building maintenance, supplies and administrative expenses.
$10.6M
Total costs $16.6M

Who this home usually serves

TYPE OF STAY

Primarily short stays

Residents typically stay for brief periods, with frequent admissions and discharges throughout the year.

Most new residents arrive under private pay (61% of admissions), and a typical private pay stay runs around 1 - 2 months.

Admissions
279 total

Coverage residents most often arrive under.

Medicare 22%
Private pay 61%
Medicaid 16%
Discharges
288 total

Coverage residents most often leave under.

Medicare 11%
Private pay 56%
Medicaid 33%

Places of interest near Spanish Meadows

Address 8.3 miles from city center Info Estimated distance in miles from Brownsville's city center to Spanish Meadows's address, calculated via Google Maps.

Calculate Travel Distance to Spanish Meadows

Add your location

Address

Financial Assistance for
Nursing Home in Texas

Spanish Meadows is located in BROWNSVILLE, Texas.
Here are the financial assistance programs available to residents in Texas.

Get Financial aid guidance

Community Care for the Aged and Disabled (CCAD)

TX Medicaid CCAD

Age 65+ or disabled
General Texas resident, Medicaid-eligible, care need (not always nursing home level).
Income Limits (2025) ~$2,829/month 300% FBR, individual
Asset Limits $2,000 (individual), $3,000 (couple).
TX

Large state; rural access challenges.

Benefits
Personal care (5-7 hours/day) Respite (240 hours/year) Adult day care (~$60/day) Home aides

Texas Community Care Services

TX CCS

Age 60+
General Texas resident, at risk of decline.
Income Limits ~$2,000/month individual, varies
Asset Limits $5,000 individual
TX

Limited funding; high demand in urban areas.

Benefits
In-home care (3-5 hours/week) Respite (up to 10 days/year) Transportation (~5 trips/month)

Area Agency on Aging (AAA) Services

Texas AAA Services

Age 60+
General TX resident; no income/asset limits.
Income Limits (2025) None; donations encouraged.
Asset Limits Not assessed.
TX

28 AAAs; includes Meals on Wheels in some areas.

Benefits
Meals (~$5-$7/meal) Transportation Homemaker services (~4 hours/week) Respite (~5 days/year) Legal aid

Medicare Savings Program (MSP)

Texas Medicare Savings Program

Age 65+ or disabled
General TX resident, Medicare Part A/B.
Income Limits (2025) ~$2,510/month (QMB), ~$3,380/month (SLMB), ~$3,598/month (QI)—individual.
Asset Limits $9,430 (individual), $14,130 (couple).
TX

Includes Extra Help for Part D; no waitlist.

Benefits
Covers Part B premiums ($174.70/month) Deductibles ($240/year) Copays (~20%)

Family Caregiver Support Program (FCSP)

Texas Family Caregiver Support Program

Age
General Caregivers of 60+ needing care or 55+ caregivers of others; TX resident; 2+ ADLs.
Income Limits (2025) No strict cap; prioritizes low-income ~$24,980/year
Asset Limits Not assessed.
TX

High rural demand; includes grandparent caregivers.

Benefits
Respite (4-6 hours/week or 5 days/year) Adult day care ($60/day) Training Supplies (~$500/year)

VA Aid and Attendance (A&A) and Housebound Benefits

Texas VA Aid and Attendance/Housebound

Age 65+ or disabled veteran/spouse
General TX resident, wartime service, ADL help (A&A) or homebound.
Income Limits (2025) Net income < ~$1,984/month (veteran with dependent, A&A); pension offsets income.
Asset Limits ~$155,356 net worth
TX

High veteran population; supports rural/urban needs.

Benefits
Cash (~$1,433-$2,642/month veteran, ~$951-$1,318 spouse) for care costs

Property Tax Exemption for Seniors

Texas Senior Property Tax Exemption

Age 65+
General TX resident, homeowner (homestead).
Income Limits (2025) None; tax-based eligibility.
Asset Limits Not assessed.
TX

$25,000+ exemption; optional freeze in some counties; saves ~$500-$1,000/year.

Benefits
Tax exemption or freeze (~$500-$1,000/year savings)

Senior Farmers’ Market Nutrition Program (SFMNP)

Texas SFMNP

Age 60+
General TX resident, low-income.
Income Limits (2025) ~$2,322/month 185% FPL
Asset Limits Not assessed.
TX

Vouchers (~$50/season); serves ~20,000 via 28 AAAs.

Benefits
Vouchers (~$50/season) for produce at farmers’ markets

Compare Nursing Home around Texas

The information below is reported by the Texas Health and Human Services Commission.

5 facilities compared · CMS & TX Dept. of Health data

The Legacy Midtown Park
NH

Nursing Home Licensed facility providing 24/7 skilled nursing care for residents with complex, ongoing medical needs. Staffed by RNs, LPNs, and CNAs. Inspected and star-rated annually by CMS. Accepts Medicare (short-term rehab) and Medicaid (long-term care).

AL

Assisted Living A licensed, long-term care setting for seniors or individuals with disabilities who need help with daily activities — like bathing, dressing, and medication management — but not 24-hour skilled nursing. Offers housing, meals, and around-the-clock support while aiming to maximize resident independence.

HC

Home Care Professional care delivered in the person's own home — from companionship and errands to skilled nursing and therapy. Allows seniors to age in place. Medicare covers skilled home health when medically necessary.

IL

Independent Living Lifestyle-focused communities for older adults offering dining, activities, and transportation with minimal personal care. Best for active, independent seniors who want community without medical support.

MC

Memory Care Secured, specialized care for people living with Alzheimer's or dementia. Staff trained in cognitive impairment, with higher staff-to-resident ratios and an environment designed to reduce confusion and wandering risk.

Dallas (Vickery Meadow)
98
Facility 98
TX AVG 80
Rank #376 / 988
87.5%
Facility 87.5%
TX AVG 63.5%
Rank #31 / 297
+38%
5.42
Facility 5.42
TX AVG 3.63
Rank #14 / 289
+1%+49%
$27.5k
Facility $27.5k
TX AVG $81.8k
Rank #159 / 294
4
Facility 4
TX AVG 25.9
Rank #2 / 292
1.3
Facility 1.3
TX AVG 3.7
Rank #2 / 292
-48-
45
Facility 45
TX AVG 41
Rank #628 / 1391
The Legacy Midtown Park Inc
$36.9M
Facility $36.9M
TX AVG $8.4M
Rank #9 / 297
$15.3M
Facility $15.3M
TX AVG $3.5M
Rank #9 / 297
41.6%
Facility 41.6%
TX AVG 47%
Rank #209 / 297
676489
Caraday of Houston
NH

Nursing Home Licensed facility providing 24/7 skilled nursing care for residents with complex, ongoing medical needs. Staffed by RNs, LPNs, and CNAs. Inspected and star-rated annually by CMS. Accepts Medicare (short-term rehab) and Medicaid (long-term care).

MC

Memory Care Secured, specialized care for people living with Alzheimer's or dementia. Staff trained in cognitive impairment, with higher staff-to-resident ratios and an environment designed to reduce confusion and wandering risk.

RC

Respite Care Short-term temporary care — days to weeks — to give family caregivers a break. Full care provided during the stay. Often used after hospitalization or to trial a facility before a permanent placement decision.

Houston (Northside / Northline)
150
Facility 150
TX AVG 80
Rank #63 / 988
--
3.76
Facility 3.76
TX AVG 3.63
Rank #88 / 289
-32%+4%
$0
Facility $0
TX AVG $81.8k
Rank #1 / 294
15
Facility 15
TX AVG 25.9
Rank #64 / 292
3.8
Facility 3.8
TX AVG 3.7
Rank #196 / 292
-12-
41
Facility 41
TX AVG 41
Rank #709 / 1391
E&R Cunningham Investments, LP
$3.6M
Facility $3.6M
TX AVG $8.4M
Rank #292 / 297
$1.8M
Facility $1.8M
TX AVG $3.5M
Rank #290 / 297
50.6%
Facility 50.6%
TX AVG 47%
Rank #99 / 297
676470
Sun Valley Rehabilitation and Healthcare Center
NH

Nursing Home Licensed facility providing 24/7 skilled nursing care for residents with complex, ongoing medical needs. Staffed by RNs, LPNs, and CNAs. Inspected and star-rated annually by CMS. Accepts Medicare (short-term rehab) and Medicaid (long-term care).

HC

Home Care Professional care delivered in the person's own home — from companionship and errands to skilled nursing and therapy. Allows seniors to age in place. Medicare covers skilled home health when medically necessary.

MC

Memory Care Secured, specialized care for people living with Alzheimer's or dementia. Staff trained in cognitive impairment, with higher staff-to-resident ratios and an environment designed to reduce confusion and wandering risk.

NC

Nursing Care

RC

Respite Care Short-term temporary care — days to weeks — to give family caregivers a break. Full care provided during the stay. Often used after hospitalization or to trial a facility before a permanent placement decision.

Harlingen (Estrellita Subdivision)
124
Facility 124
TX AVG 80
Rank #178 / 988
76.4%
Facility 76.4%
TX AVG 63.5%
Rank #96 / 297
+20%
3.79
Facility 3.79
TX AVG 3.63
Rank #88 / 289
-15%+4%
$0
Facility $0
TX AVG $81.8k
Rank #1 / 294
5
Facility 5
TX AVG 25.9
Rank #6 / 292
2.5
Facility 2.5
TX AVG 3.7
Rank #62 / 292
-94-
37
Facility 37
TX AVG 41
Rank #808 / 1391
Av Rehab LLC
$10.2M
Facility $10.2M
TX AVG $8.4M
Rank #171 / 297
$4.9M
Facility $4.9M
TX AVG $3.5M
Rank #158 / 297
47.8%
Facility 47.8%
TX AVG 47%
Rank #125 / 297
676493
Houston Transitional Care
NH

Nursing Home Licensed facility providing 24/7 skilled nursing care for residents with complex, ongoing medical needs. Staffed by RNs, LPNs, and CNAs. Inspected and star-rated annually by CMS. Accepts Medicare (short-term rehab) and Medicaid (long-term care).

HC

Home Care Professional care delivered in the person's own home — from companionship and errands to skilled nursing and therapy. Allows seniors to age in place. Medicare covers skilled home health when medically necessary.

MC

Memory Care Secured, specialized care for people living with Alzheimer's or dementia. Staff trained in cognitive impairment, with higher staff-to-resident ratios and an environment designed to reduce confusion and wandering risk.

NC

Nursing Care

PC

Palliative Care

RC

Respite Care Short-term temporary care — days to weeks — to give family caregivers a break. Full care provided during the stay. Often used after hospitalization or to trial a facility before a permanent placement decision.

Houston (Braeburn)
70
Facility 70
TX AVG 80
Rank #517 / 988
90.3%
Facility 90.3%
TX AVG 63.5%
Rank #18 / 297
+42%
3.17
Facility 3.17
TX AVG 3.63
Rank #215 / 289
+22%-13%
$0
Facility $0
TX AVG $81.8k
Rank #1 / 294
16
Facility 16
TX AVG 25.9
Rank #74 / 292
5.3
Facility 5.3
TX AVG 3.7
Rank #268 / 292
-67-
75
Facility 75
TX AVG 41
Rank #67 / 1391
Ahmad El-Saadi
$21.9M
Facility $21.9M
TX AVG $8.4M
Rank #31 / 297
$5.3M
Facility $5.3M
TX AVG $3.5M
Rank #129 / 297
24.4%
Facility 24.4%
TX AVG 47%
Rank #294 / 297
676435
Spanish Meadows
NH

Nursing Home Licensed facility providing 24/7 skilled nursing care for residents with complex, ongoing medical needs. Staffed by RNs, LPNs, and CNAs. Inspected and star-rated annually by CMS. Accepts Medicare (short-term rehab) and Medicaid (long-term care).

AL

Assisted Living A licensed, long-term care setting for seniors or individuals with disabilities who need help with daily activities — like bathing, dressing, and medication management — but not 24-hour skilled nursing. Offers housing, meals, and around-the-clock support while aiming to maximize resident independence.

Brownsville
120
Facility 120
TX AVG 80
Rank #210 / 988
84.4%
Facility 84.4%
TX AVG 63.5%
Rank #40 / 297
+33%
3.13
Facility 3.13
TX AVG 3.63
Rank #231 / 289
-52%-14%
$14.8k
Facility $14.8k
TX AVG $81.8k
Rank #157 / 294
26
Facility 26
TX AVG 25.9
Rank #190 / 292
2.6
Facility 2.6
TX AVG 3.7
Rank #71 / 292
288-
2
Facility 2
TX AVG 41
Rank #1336 / 1391
Rl Spanish Meadows, LLC
$15.4M
Facility $15.4M
TX AVG $8.4M
Rank #62 / 297
$6.0M
Facility $6.0M
TX AVG $3.5M
Rank #100 / 297
39%
Facility 39%
TX AVG 47%
Rank #237 / 297
455802

Frequently Asked Questions about Spanish Meadows

Who is the owner of Spanish Meadows?

The legal owner and operator of Spanish Meadows is Empire Spanish Meadows, Ltd..

Is Spanish Meadows in a walkable area?

Spanish Meadows has a walk score of 2. Car-dependent. Most errands require a car, with limited nearby walkable options.

What is the occupancy rate at Spanish Meadows?

Spanish Meadows's occupancy is 84%.

How many beds does Spanish Meadows have?

Spanish Meadows has 120 beds.

Has Spanish Meadows had any recent deficiencies or citations?

Spanish Meadows has had 2 recently reported deficiencies.

Are there photos of Spanish Meadows?

Yes — there are 5 photos of Spanish Meadows in the photo gallery on this page.

What is the address of Spanish Meadows?

Spanish Meadows is located at 440 E RUBEN M TORRES BLVD.

Guides for Better Senior Living

Care Cost Calculator: See Prices in Your Area

Nursing Home Data Explorer

Don’t Wait Too Long: 7 Red Flag Signs Your Parent Needs Assisted Living Now

The True Cost of Assisted Living in 2025 – And How Families Are Paying For It

Understanding Senior Living Costs: Pricing Models, Discounts & Financial Assistance

Explore Open Rooms
1 Contact details
2 What type of senior care service are you looking for?
3 What budget do you have in mind for senior care?
4 How soon do you need to find care?
5 Additional details

Thank you for your interest!

Our team will be in touch shortly to help with next steps.