


Occupancy rate
100%
St. James Villas Wellness and Rehab Villas is a 60-bed nursing home on East Richton Road in Crete, Illinois. It is run by the Adams Vales Accumulation Trust, stays full, and takes Medicare, Medicaid, and private pay. Since residents stay here for about 151 days on average, the building has a pretty stable, long-term crowd mixed in with people passing through for short-term rehab.
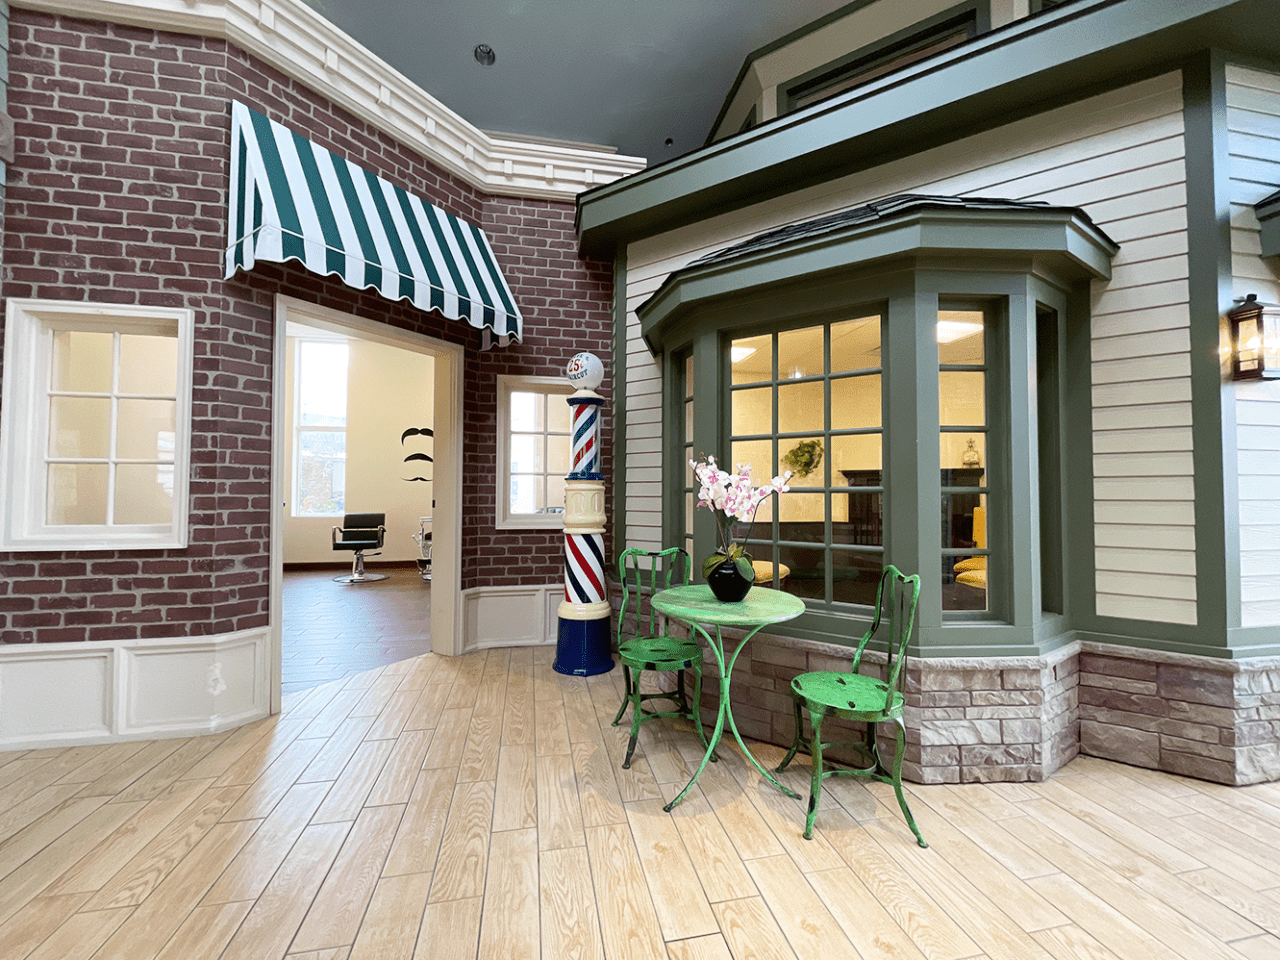
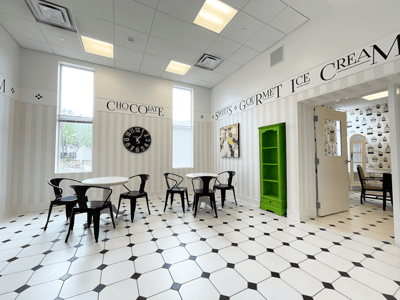
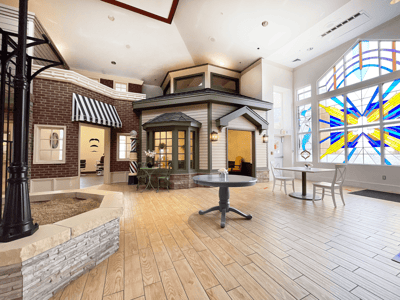
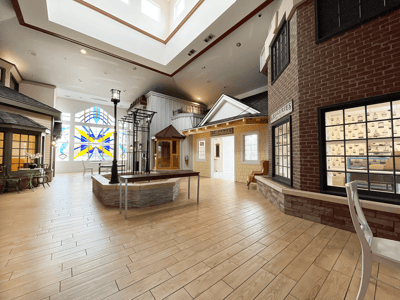
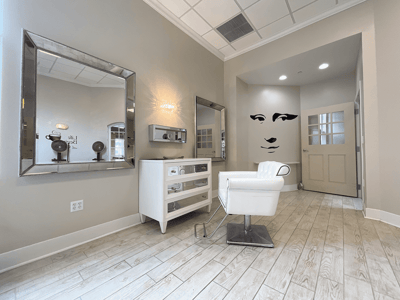
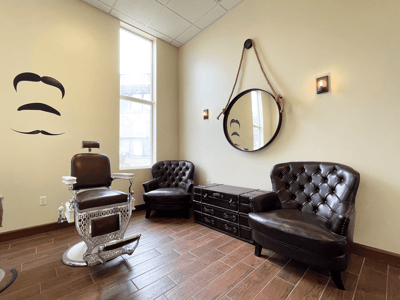
The nurses and aides put in about 2 hours and 50 minutes of direct care per resident every day. Having staff on the clock 24/7 lets them manage regular rehab therapies and specialized care routines, while also helping out with religious programs and social activities. Inside, the building has television lounges, an ice cream parlor, a beauty shop, and an outdoor patio. The local neighborhood scores a zero for walkability, so you will definitely need a car to visit or run errands nearby.
Interested individuals can reach out to the front office to ask about the waiting list, look into the monthly activity calendar, or schedule a tour. The staff can also explain how the billing works and help you figure out the insurance paperwork.
| Staff type | Hours / Day / Resident | vs state avg |
|---|---|---|
|
Registered Nurse (RN)
| 23m per day | ▼ 48% State avg: 44m per day · National avg: 41m per day |
|
LPN / LVN
| 53m per day | ▲ 39% State avg: 38m per day · National avg: 52m per day |
|
Nurse Aide
| 1h 46m per day | ▼ 17% State avg: 2h 8m per day · National avg: 2h 20m per day |
|
Weekend Total Nursing
| 2h 44m per day | ▼ 11% State avg: 3h 5m per day · National avg: 3h 26m per day |
|
Physical Therapist
| 1m per day | ▼ 68% State avg: 3m per day · National avg: 4m per day |
|
Weekend RN
| 14m per day | ▼ 60% State avg: 34m per day · National avg: 28m per day |
In Illinois, the Department of Public Health, Office of Health Care Regulation conducts annual unannounced surveys to assess compliance with state and federal healthcare facility standards.
Deficiencies
| This Facility | IL Average | vs. IL Avg |
|---|---|---|---|
|
Total deficiencies
| 38 | 7 | This facility has 443% more total deficiencies than a typical Illinois nursing home (38 vs. IL avg 7).↑ 443% worse |
|
Deficiencies per inspection
| 19 | 0.8 | This facility has 2275% more deficiencies per inspection than a typical Illinois nursing home (19 vs. IL avg 0.8).↑ 2275% worse |
Inspections
| This Facility | IL Average | vs. IL Avg |
|---|---|---|---|
|
Total inspections
| 2 | 9 | This facility has had 78% fewer total inspections than the Illinois average (2 vs. IL avg 9). More inspections can mean more regulatory scrutiny rather than worse care.↓ 78% fewer |
State average 10.4
Last Health inspection on Mar 2025
State average 36.8
State average 3.68
Health citations are formal notices following inspections when they fail to comply with safety and care standards.
21 of 37 citations resulted from standard inspections; 13 of 37 resulted from complaint investigations; and 3 of 37 came from combined inspections (standard and complaint).
State average: 0.7
State average: 3.6
Reporting period: October 1 – December 31, 2025 (Q4 2025). Source: CMS Payroll-Based Journal report.
Manages medical care and health needs.
Assists with medical care and medications.
Helps with daily care and mobility.
Total hours from contractors
2,289 contractor hours this quarter
| Certified Nursing Assistant | 42 | 0 | 42 | 14,284 | 92 | 100% | 7.6 |
| Licensed Practical Nurse | 17 | 0 | 17 | 7,126 | 92 | 100% | 8 |
| Registered Nurse | 8 | 1 | 9 | 2,017 | 90 | 98% | 8.3 |
| Other Dietary Services Staff | 3 | 0 | 3 | 1,191 | 92 | 100% | 7.1 |
| Clinical Nurse Specialist | 1 | 3 | 4 | 893 | 67 | 73% | 7.9 |
| Physical Therapy Aide | 0 | 4 | 4 | 536 | 65 | 71% | 7.4 |
| Dietitian | 1 | 0 | 1 | 512 | 64 | 70% | 8 |
| Administrator | 1 | 0 | 1 | 480 | 64 | 70% | 7.5 |
| Speech Language Pathologist | 0 | 4 | 4 | 395 | 75 | 82% | 5.1 |
| Mental Health Service Worker | 2 | 1 | 3 | 360 | 45 | 49% | 7.2 |
| Physical Therapy Assistant | 0 | 2 | 2 | 327 | 57 | 62% | 5.7 |
| Nurse Practitioner | 2 | 1 | 3 | 193 | 27 | 29% | 7.1 |
| Occupational Therapy Aide | 0 | 5 | 5 | 164 | 72 | 78% | 1.5 |
| Qualified Social Worker | 0 | 3 | 3 | 146 | 26 | 28% | 5.6 |
| Respiratory Therapy Technician | 0 | 4 | 4 | 130 | 38 | 41% | 3.1 |
| Medical Director | 0 | 1 | 1 | 48 | 26 | 28% | 1.8 |
| Occupational Therapy Assistant | 0 | 1 | 1 | 18 | 4 | 4% | 4.5 |
Federal penalties imposed by CMS for regulatory violations, including civil money penalties (fines) and denials of payment for new Medicare/Medicaid admissions.
Source: CMS Penalties Database (Data as of Jan 2026)
Illinois average: $143K
Illinois average: 3.0
Illinois average: 1.1
No penalties in the past 3 years
No civil money penalties or payment denials were reported in the last 3 years.
These measures show how residents usually do over time at this home, based on health outcomes and preventive care.
Illinois average: 9.7
Illinois average: 18.6
Illinois average: 15.5%
Illinois average: 18.4%
Illinois average: 21.6%
Illinois average: 3.4%
Illinois average: 5.3%
Illinois average: 1.8%
Illinois average: 6.5%
Illinois average: 48.1%
Illinois average: 20.2%
Illinois average: 89.2%
Illinois average: 91.6%
Illinois average: 2.04
Illinois average: 2.25
Illinois average: 68.3%
Illinois average: 2.3%
Illinois average: 63.0%
Illinois average: 26.2%
Illinois average: 14.0%
Illinois average: 0.8%
Illinois average: 53.7%
Illinois average: 50.6%
Quality measures are calculated from Minimum Data Set (MDS) assessments. For most measures, lower percentages indicate better care quality.
40% of new residents, usually for short-term rehab.
10% of new residents, often for short stays.
49% of new residents, often for long-term daily care.
Source: CMS Long-Term Care Facility Characteristics (Data as of Jan 2026)
Residents meet regularly to discuss policies, care quality, and activities
Organized group of residents that meets regularly to discuss facility policies, quality of life, and activities.
Data sourced from CMS Long-Term Care Facility Characteristics quarterly report. Payer mix reflects the current resident census by primary payment source.
Historical financial and operational data for St. James Villas Wellness, Rehab Villas from 2011–2023, based on CMS SNF Cost Reports.
Key figures below are for fiscal year ending in 12/2023.
Based on CMS SNF Cost Report for fiscal year ending in 12/2023.
Most residents stay for extended periods and receive ongoing daily care.
New residents most often arrive under Medicaid (49% of admissions), and a typical Medicaid stay runs around 4 - 5 months.
Coverage residents most often arrive under.
Coverage residents most often leave under.
![]() 1.8 miles from city center
1.8 miles from city center
![]() Estimated distance in miles from Crete's city center to St. James Villas Wellness, Rehab Villas's address, calculated via Google Maps.
Estimated distance in miles from Crete's city center to St. James Villas Wellness, Rehab Villas's address, calculated via Google Maps.
Add your location
Info below is compiled from CMS reports & the IL Dept. of Public Health (IDPH), senior community websites & trusted data sources such as Walk Score & BBB.
Communities are listed from highest to lowest based on our ranking methodology.
| Vi at The Glen | NH AL IL MC | Glenview | 36
Facility
36
IL AVG
85
Rank
#365 / 419 | - | - | 6.15
Facility
6.15
IL AVG
3.10
Rank
#3 / 155 | +48% | +98% | $0
Facility
$0
IL AVG
$151.3k
Rank
#1 / 155 | 6
Facility
6
IL AVG
36.8
Rank
#4 / 155 | 3.0
Facility
3.0
IL AVG
3.7
Rank
#40 / 155 | - | 42 | A+ |
52
Facility
52
IL AVG
51
Rank
#310 / 648 | Pamela Lamb | $6.7MFiscal year ending 12/2023
Facility
$6.7MFiscal year ending 12/2023
IL AVG
$12.2M
Rank
#6 / 154 | $7.6MFiscal year ending 12/2023
Facility
$7.6MFiscal year ending 12/2023
IL AVG
$4.8M
Rank
#64 / 154 | 112.7%Fiscal year ending 12/2023
Facility
112.7%Fiscal year ending 12/2023
IL AVG
44.3%
Rank
#153 / 154 | 146107 | ||||
| Avantara Long Grove | NH HOS MC PC SNF | Long Grove (Edgebrook Downs) | 195
Facility
195
IL AVG
85
Rank
#30 / 419 |
83.6%
Facility
83.6%
IL AVG
73
Rank
#57 / 157 | +15% | 2.60
Facility
2.60
IL AVG
3.10
Rank
#109 / 155 | +33% | -16% | $0
Facility
$0
IL AVG
$151.3k
Rank
#1 / 155 | 27
Facility
27
IL AVG
36.8
Rank
#61 / 155 | 3.4
Facility
3.4
IL AVG
3.7
Rank
#67 / 155 | - | 163 | - |
34
Facility
34
IL AVG
51
Rank
#465 / 648 | Lily Osei | $19.9MFiscal year ending 12/2023
Facility
$19.9MFiscal year ending 12/2023
IL AVG
$12.2M
Rank
#18 / 154 | $9.0MFiscal year ending 12/2023
Facility
$9.0MFiscal year ending 12/2023
IL AVG
$4.8M
Rank
#33 / 154 | 45.2%Fiscal year ending 12/2023
Facility
45.2%Fiscal year ending 12/2023
IL AVG
44.3%
Rank
#134 / 154 | 145868 | ||||
| Bella Terra Streamwood | NH MC PC SNF | Streamwood | 214
Facility
214
IL AVG
85
Rank
#20 / 419 |
61.5%
Facility
61.5%
IL AVG
73
Rank
#127 / 157 | -16% | 2.62
Facility
2.62
IL AVG
3.10
Rank
#109 / 155 | +144% | -16% | $0
Facility
$0
IL AVG
$151.3k
Rank
#1 / 155 | 14
Facility
14
IL AVG
36.8
Rank
#21 / 155 | 2.3
Facility
2.3
IL AVG
3.7
Rank
#14 / 155 | - | 132 | - |
74
Facility
74
IL AVG
51
Rank
#135 / 648 | Forbright Bank | $15.3MFiscal year ending 12/2023
Facility
$15.3MFiscal year ending 12/2023
IL AVG
$12.2M
Rank
#45 / 154 | $5.7MFiscal year ending 12/2023
Facility
$5.7MFiscal year ending 12/2023
IL AVG
$4.8M
Rank
#53 / 154 | 37.4%Fiscal year ending 12/2023
Facility
37.4%Fiscal year ending 12/2023
IL AVG
44.3%
Rank
#113 / 154 | 145701 | ||||
| GreenFields of Geneva | NH AL IL MC SNF | Geneva | 77
Facility
77
IL AVG
85
Rank
#188 / 419 |
54.5%
Facility
54.5%
IL AVG
73
Rank
#139 / 157 | -25% | 4.58
Facility
4.58
IL AVG
3.10
Rank
#24 / 155 | +61% | +48% | $14.2k
Facility
$14.2k
IL AVG
$151.3k
Rank
#79 / 155 | 19
Facility
19
IL AVG
36.8
Rank
#35 / 155 | 4.8
Facility
4.8
IL AVG
3.7
Rank
#128 / 155 | 3 | 42 | A+ |
6
Facility
6
IL AVG
51
Rank
#610 / 648 | Brian Robbins | $20.4MFiscal year ending 03/2024
Facility
$20.4MFiscal year ending 03/2024
IL AVG
$12.2M
Rank
#24 / 154 | $8.9MFiscal year ending 03/2024
Facility
$8.9MFiscal year ending 03/2024
IL AVG
$4.8M
Rank
#41 / 154 | 43.5%Fiscal year ending 03/2024
Facility
43.5%Fiscal year ending 03/2024
IL AVG
44.3%
Rank
#132 / 154 | 146166 | ||||
| St. James Villas Wellness, Rehab Villas | NH MC PC SNF | Crete | 60
Facility
60
IL AVG
85
Rank
#249 / 419 | - | - | 2.83
Facility
2.83
IL AVG
3.10
Rank
#89 / 155 | -41% | -9% | $0
Facility
$0
IL AVG
$151.3k
Rank
#1 / 155 | 37
Facility
37
IL AVG
36.8
Rank
#96 / 155 | 3.4
Facility
3.4
IL AVG
3.7
Rank
#67 / 155 | 1 | 69 | - |
0
Facility
0
IL AVG
51
Rank
#643 / 648 | Adams Vales Accumulation Trust | $8.1MFiscal year ending 12/2023
Facility
$8.1MFiscal year ending 12/2023
IL AVG
$12.2M
Rank
#131 / 154 | $6.5MFiscal year ending 12/2023
Facility
$6.5MFiscal year ending 12/2023
IL AVG
$4.8M
Rank
#84 / 154 | 79.7%Fiscal year ending 12/2023
Facility
79.7%Fiscal year ending 12/2023
IL AVG
44.3%
Rank
#9 / 154 | 145611 |
St. James Villas Wellness, Rehab Villas is legally operated by St. James Property, LLC/South Short Property LLC.
According to IL state health department records, St. James Villas Wellness, Rehab Villas's license number is 5104705.
St. James Villas Wellness, Rehab Villas's occupancy is 100%.
St. James Villas Wellness, Rehab Villas has been operating for approximately 2 years, based on available licensing and registration records.
No, St. James Villas Wellness, Rehab Villas has a no-pet policy.
The team at St. James Villas Wellness, Rehab Villas can be reached at administrator@stjameshc.com.
St. James Villas Wellness, Rehab Villas is registered as a for-profit in IL.
Care Cost Calculator: See Prices in Your Area
Nursing Home Data Explorer
Don’t Wait Too Long: 7 Red Flag Signs Your Parent Needs Assisted Living Now
The True Cost of Assisted Living in 2025 – And How Families Are Paying For It
Understanding Senior Living Costs: Pricing Models, Discounts & Financial Assistance


