St. Mary’s Care Center
CMS overall rating Info CMS (the Centers for Medicare & Medicaid Services) is the federal agency that rates nursing home quality. Its Overall Rating runs from 1 to 5 stars, combining health inspections, staffing, and quality measures, with inspections weighted most heavily.

St. Mary’s Care Center

CMS overall rating Info CMS (the Centers for Medicare & Medicaid Services) is the federal agency that rates nursing home quality. Its Overall Rating runs from 1 to 5 stars, combining health inspections, staffing, and quality measures, with inspections weighted most heavily.
Calculator: See prices in your area
St. Mary’s Care Center accepts Medicare, Medicaid, and private pay.

Overview of St. Mary’s Care Center

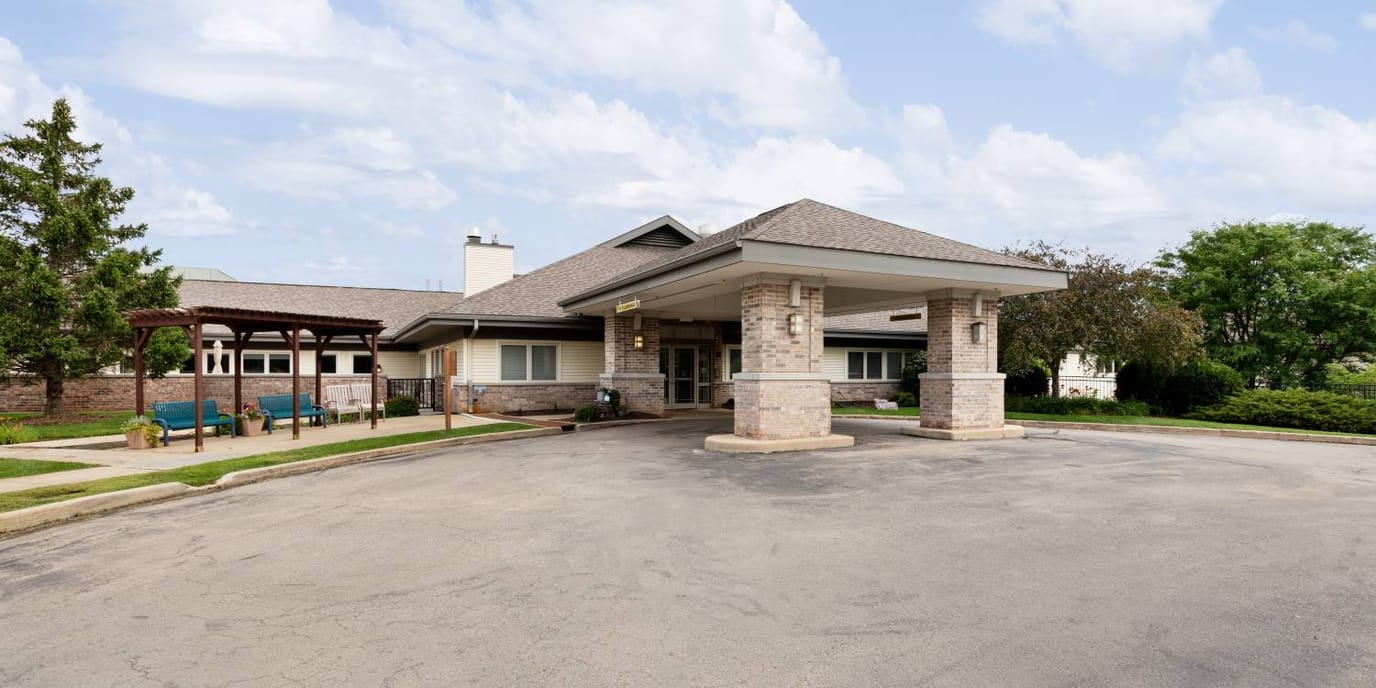
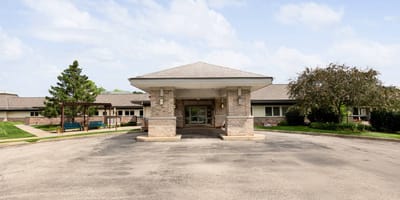
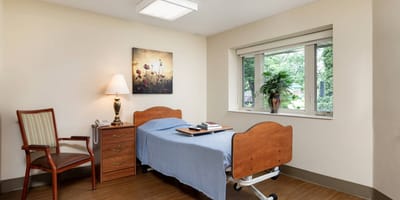
St. Mary’s Care Center is a faith-based nursing home in Madison, WI, that offers long-term care and short-term rehabilitation. Top-notch support is also provided to meet residents’ healthcare needs, ensuring they can recover with ease. The community also participates in Medicare and Medicaid to ease financial burdens.

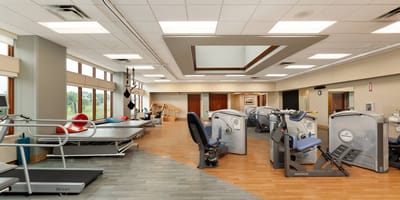
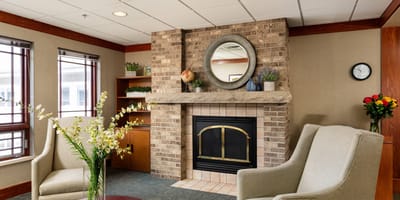
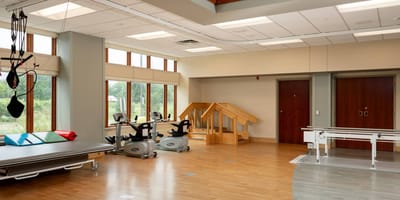
Recreational activities and light exercises are also conducted to keep residents active and socially connected. With physical, occupational, and speech therapy, residents can live to their potential in retirement. The nursing home’s wide range of care options and state-of-the-art amenities create the ideal setting where older adults can find the care they need.

Quality ratings

Measured by Centers for Medicare & Medicaid Services (CMS)

Overall rating Info The Overall CMS Rating combines results from health inspections, staffing levels and quality measures. Health inspections carry the most weight. Staffing and quality scores can increase or decrease the final rating based on performance compared to state and national standards.
▼ 66.7% Below WI avg. ▼ 66.7% Below WI avg.WI average: 3.0Click the badge to see the full State ranking.Click here to see the full State ranking.
Health Inspection Info Based on the results of the facility's three most recent standard inspections and any complaint investigations. CMS reviews the number, scope, and severity of deficiencies, with more recent findings weighted more heavily.
▼ 64.3% Below WI avg. ▼ 64.3% Below WI avg.WI average: 2.8Click the badge to see the full State ranking.Click here to see the full State ranking.
Staffing Info Measures average nursing staff hours per resident per day, including Registered Nurses (RNs) and total nursing staff. Ratings are adjusted based on the level of care residents require and are compared to state and national benchmarks.
▲ 10.5% Above WI avg. ▲ 10.5% Above WI avg.WI average: 3.6Click the badge to see the full State ranking.Click here to see the full State ranking.
Quality Measures Info Based on clinical and physical health indicators reported to CMS, such as hospital readmissions, falls, pressure ulcers, and improvements in mobility. These measures reflect how well residents' health needs are being managed.
▲ 28.5% Above WI avg. ▲ 28.5% Above WI avg.WI average: 3.1Click the badge to see the full State ranking.Click here to see the full State ranking.

Staffing hours breakdown

Info Daily nursing hours per resident by staff type, reported to CMS. Higher is generally better — compare this facility to state and national averages to see where staffing stands.

Hours per resident per day — compared to Wisconsin state averages

Total nursing care / resident Info This home is ranked 53rd out of 178 homes in Wisconsin for nurse hours. Total adjusted nursing hours per resident per day, combining RN, LPN, and aide time. CMS adjusts this for case-mix so facilities can be fairly compared.
4h 43m per day
Rank #53 / 178Nurse hours — State benchmarkedThis home is ranked 53rd out of 178 homes in Wisconsin. Shows adjusted nurse hours per resident per day benchmarked to the Wisconsin average, with a ranking across 178 Wisconsin facilities. More hours mean more direct care. The national average is about 3.5 hrs; below 3.0 is a red flag.Rankings are based only on facilities in Wisconsin that report data for that category. Facilities without available data are excluded from the ranking.Click the rank badge to see the full State ranking.Click here to see the full State ranking.
This facility Wisconsin avg (4h 17m per day)
vs Wisconsin avg
+10%

0 of 6 metrics below state avg

Standout metric Nurse Aide is +24% above state avg
Staff typeHours / Day / Residentvs state avg
Registered Nurse (RN) Info RNs hold the highest nursing license and can assess residents, interpret test results, and direct care plans. More RN hours per day often signals stronger clinical oversight and faster response to health changes. 1h 6m per day ▲ 12% State avg: 59m per day · National avg: 41m per day
LPN / LVN Info Licensed Practical Nurses (LPNs) or Licensed Vocational Nurses (LVNs) deliver routine hands-on care — medication administration, wound dressing, and monitoring vital signs. They work under RN supervision and make up a large share of daily bedside care. 39m per day ■ Avg State avg: 39m per day · National avg: 52m per day
Nurse Aide Info Certified Nurse Aides (CNAs) provide the most direct day-to-day assistance: bathing, dressing, feeding, and mobility. Nurse aide hours are typically the largest staffing category and directly affect residents' quality of life. 3h 10m per day ▲ 24% State avg: 2h 34m per day · National avg: 2h 20m per day
Weekend Total Nursing Info Combined nursing hours (RN + LPN + Nurse Aide) per resident per day on weekends. Staffing often drops on weekends — this figure reveals whether the facility maintains adequate coverage outside of weekday hours. 4h 39m per day ▲ 24% State avg: 3h 45m per day · National avg: 3h 27m per day
Physical Therapist Info Hours per resident per day provided by licensed Physical Therapists (PTs) or PT Assistants. PT services help residents recover mobility after injury or illness and are especially important for post-acute (short-stay) rehabilitation. 4m per day ▲ 19% State avg: 4m per day · National avg: 4m per day
Weekend RN Info Registered nurse hours specifically on weekends. Facilities sometimes reduce RN presence on Saturdays and Sundays — a low weekend RN figure compared to weekday hours can indicate reduced clinical oversight when most administrative staff are absent. 49m per day ▲ 24% State avg: 40m per day · National avg: 29m per day

Capacity and availability

This home usually has availability

Lower occupancy than the Wisconsin average: 70%
Occupancy rate
58.7% Rank #336 / 434Occupancy rate — State benchmarkedThis home is ranked 336th out of 434 homes in Wisconsin. Shows this facility's occupancy rate versus the Wisconsin average, with its Statewide rank out of 434. Higher occupancy signals strong local demand and financial stability.Rankings are based only on facilities in Wisconsin that report data for that category. Facilities without available data are excluded from the ranking.Click the rank badge to see the full State ranking.Click here to see the full State ranking.
Avg. Length of Stay
275 days
Bed community size
184-bed community Rank #6 / 496Bed count — State benchmarkedThis home is ranked 6th out of 496 homes in Wisconsin. Shows this facility's certified or reported bed count compared to other Wisconsin facilities. Larger communities may offer more amenities, programs, and on-site services for residents and families.Rankings are based only on facilities in Wisconsin that report data for that category. Facilities without available data are excluded from the ranking.Click the rank badge to see the full State ranking.Click here to see the full State ranking.
A large-scale community that may provide a wide range of amenities, services, and structured programs.
Walk Score
Walk Score: 43 / 100 Rank #285 / 580Walk Score — State benchmarkedThis home is ranked 285th out of 580 homes in Wisconsin. Shows how walkable this facility's neighborhood is compared to the average Walk Score across Wisconsin facilities. Higher scores benefit residents, families, and staff.Rankings are based only on facilities in Wisconsin that report data for that category. Facilities without available data are excluded from the ranking.Click the rank badge to see the full State ranking.Click here to see the full State ranking.
Somewhat walkable. A few nearby services may be reachable on foot, but most trips require transportation.

Contact St. Mary’s Care Center

Staffing Data

Reporting period: October 1 – December 31, 2025 (Q4 2025). Source: CMS Payroll-Based Journal report.

Total staff 338
Employees 200
Contractors 138
Staff to resident ratio 3.63 : 1
46% more staff per resident than Wisconsin average
Wisconsin average ratio: 2.48 : 1 Wisconsin average ratio: 2.48 : 1See full Wisconsin ranking
Avg staff/day 73
Average shift 8.4 hours
15% better than Wisconsin average
Wisconsin average: 7.3 hours Wisconsin average shift: 7.3 hoursSee full Wisconsin ranking
Total staff hours (quarter) 56,308

Nursing staff breakdown

Q4 2025 · Oct 1 – Dec 31 More info This data comes from the CMS Payroll-Based Journal report covering October 1 – December 31, 2025.
Registered Nurse

Manages medical care and health needs.

RN Staff Info 47 total: 21 full-time employees and 26 contractors. 47
Average shift length Info Average shift length. Calculated as total hours divided by days worked and average staff per day. 9.2 hours
Licensed Practical Nurse

Assists with medical care and medications.

LPN Staff Info 43 total: 21 full-time employees and 22 contractors. 43
Average shift length Info Average shift length. Calculated as total hours divided by days worked and average staff per day. 8.7 hours
Certified Nursing Assistant

Helps with daily care and mobility.

CNA Staff Info 179 total: 108 full-time employees and 71 contractors. 179
Average shift length Info Average shift length. Calculated as total hours divided by days worked and average staff per day. 8.4 hours

Contractor staffing

Q4 2025 · Oct 1 – Dec 31 More info This data comes from the CMS Payroll-Based Journal report covering October 1 – December 31, 2025.

Total hours from contractors

14.3%

8,055 contractor hours this quarter

Certified Nursing Assistant: 71 Registered Nurse: 26 Licensed Practical Nurse: 22 Respiratory Therapy Technician: 6 Physical Therapy Assistant: 5 Speech Language Pathologist: 3 Physical Therapy Aide: 3 Qualified Social Worker: 2

Staff by category

Q4 2025 · Oct 1 – Dec 31 More info This data comes from the CMS Payroll-Based Journal report covering October 1 – December 31, 2025.
Certified Nursing Assistant1087117928,01292100%8.4
Registered Nurse2126478,08392100%9.2
Licensed Practical Nurse2122436,40592100%8.7
Medication Aide/Technician7072,9148896%8.8
Other Dietary Services Staff8082,5078390%7.5
Clinical Nurse Specialist7072,2247986%8.5
Dental Services Staff130131,0966470%8
Occupational Therapy Aide4048226571%6.9
Respiratory Therapy Technician0667237683%6.2
Physical Therapy Assistant0556446773%7.9
Speech Language Pathologist0336047582%6.9
Nurse Practitioner1014806065%8
Administrator1014725964%8
Physical Therapy Aide0334505762%7.7
Qualified Social Worker0224296874%6.3
Dietitian8084183942%7.6
Other Social Services Staff1012533%8.3
179 Certified Nursing Assistant
% of Days 100%
47 Registered Nurse
% of Days 100%
43 Licensed Practical Nurse
% of Days 100%
7 Medication Aide/Technician
% of Days 96%
8 Other Dietary Services Staff
% of Days 90%
7 Clinical Nurse Specialist
% of Days 86%
13 Dental Services Staff
% of Days 70%
4 Occupational Therapy Aide
% of Days 71%
6 Respiratory Therapy Technician
% of Days 83%
5 Physical Therapy Assistant
% of Days 73%
3 Speech Language Pathologist
% of Days 82%
1 Nurse Practitioner
% of Days 65%
1 Administrator
% of Days 64%
3 Physical Therapy Aide
% of Days 62%
2 Qualified Social Worker
% of Days 74%
8 Dietitian
% of Days 42%
1 Other Social Services Staff
% of Days 3%

Penalties and fines

Includes penalties issued in 2023-2025

Federal penalties imposed by CMS for regulatory violations, including civil money penalties (fines) and denials of payment for new Medicare/Medicaid admissions.

Source: CMS Penalties Database (Data as of Jan 2026)

Total fines amount $114K Rank #165 / 180Federal fines — State benchmarkedThis home is ranked 165th out of 180 homes in Wisconsin. Shows this facility's cumulative CMS federal fine dollars versus the Wisconsin average among facilities with fines, and where it ranks among 180 facilities in the pool. Lower total dollars mean a better rank.Rankings are based only on facilities in Wisconsin that report data for that category. Facilities without available data are excluded from the ranking.Click the rank badge to see the full State ranking.Click here to see the full State ranking.
19% higher than Wisconsin average

Wisconsin average: $95K

Number of fines 5
142% more fines than Wisconsin average

Wisconsin average: 2.1

Payment Denials Info Serious action where Medicare and/or Medicaid temporarily stops payments for new residents until issues are fixed. 3
353% more payment denials than Wisconsin average

Wisconsin average: 0.7

Fines amount comparison
This facility $114K
Wisconsin average $95K
Penalty History

Penalties are imposed by CMS for violations of federal nursing home regulations.

7 penalties in the past 3 years

Multiple penalties were reported in the last 3 years.

Civil Money Penalty Info Fines imposed for noncompliance, which can be assessed per day or per instance of violation. Mar 28, 2025
$53K
Civil Money Penalty Info Fines imposed for noncompliance, which can be assessed per day or per instance of violation. Oct 21, 2024
$12K
Payment Denial Info Serious action where Medicare and/or Medicaid temporarily stops payments for new residents until issues are fixed. Oct 21, 2024
8 days
Civil Money Penalty Info Fines imposed for noncompliance, which can be assessed per day or per instance of violation. Sep 12, 2024
$16K

Last updated: Jan 2026

Quality of care over time

These measures show how residents usually do over time at this home, based on health outcomes and preventive care.

High-risk clinical events score Info A composite score based on pressure ulcers, falls with injury, weight loss, walking ability decline, and activities of daily living decline. 12.2
17% worse than Wisconsin average

Wisconsin average: 10.5

Functional decline score Info A composite score based on activities of daily living decline, walking ability decline, and incontinence. 27.1
22% worse than Wisconsin average

Wisconsin average: 22.1

Long-stay resident measures
Need for Help with Daily Activities Increased Info Percent of long-stay residents whose need for help with daily activities has increased 16.4%
7% better than Wisconsin average

Wisconsin average: 17.6%

Walking Ability Worsened Info Percent of long-stay residents whose ability to move independently worsened 29.2%
28% worse than Wisconsin average

Wisconsin average: 22.8%

Low Risk Residents with Bowel/Bladder Incontinence Info Percent of low risk long-stay residents who lose control of their bowels or bladder 35.7%
37% worse than Wisconsin average

Wisconsin average: 26.0%

Falls with Major Injury Info Percent of long-stay residents experiencing one or more falls with major injury 4.3%
36% worse than Wisconsin average

Wisconsin average: 3.2%

High Risk Residents with Pressure Ulcers Info Percent of long-stay high risk residents with pressure ulcers 6.7%
23% worse than Wisconsin average

Wisconsin average: 5.4%

Urinary Tract Infection Info Percent of long-stay residents with a urinary tract infection 2.2%
30% better than Wisconsin average

Wisconsin average: 3.2%

Lost Too Much Weight Info Percent of long-stay residents who lose too much weight 4.5%
8% better than Wisconsin average

Wisconsin average: 4.9%

Depressive Symptoms Info Percent of long-stay residents who have depressive symptoms 1.9%
62% better than Wisconsin average

Wisconsin average: 5.0%

Antipsychotic Use Info Percent of long-stay residents who received an antipsychotic medication 17.6%
10% worse than Wisconsin average

Wisconsin average: 16.1%

Pneumococcal Vaccine Info Percent of long-stay residents assessed and appropriately given the pneumococcal vaccine 96.2%
In line with Wisconsin average

Wisconsin average: 95.9%

Influenza Vaccine Info Percent of long-stay residents assessed and appropriately given the seasonal influenza vaccine 96.9%
In line with Wisconsin average

Wisconsin average: 95.0%

Short-stay resident measures
Pneumococcal Vaccine Info Percent of short-stay residents assessed and appropriately given the pneumococcal vaccine 82.3%
6% worse than Wisconsin average

Wisconsin average: 87.3%

Antipsychotic medication increase Info Percent of short-stay residents who newly received an antipsychotic medication 1.1%
12% better than Wisconsin average

Wisconsin average: 1.2%

Influenza Vaccine Info Percent of short-stay residents assessed and appropriately given the seasonal influenza vaccine 84.9%
In line with Wisconsin average

Wisconsin average: 82.2%

Breakdown by payment type

Medicare

87% of new residents, usually for short-term rehab.

Typical stay 30 days

Private pay

10% of new residents, often for short stays.

Typical stay 2 years

Medicaid

3% of new residents, often for long-term daily care.

Typical stay 15 - 16 years

Facility Characteristics

Source: CMS Long-Term Care Facility Characteristics (Data as of Jan 2026)

Total residents 93
Medicare
10
10.8% of residents
Medicaid
62
66.7% of residents
Private pay or other
21
22.6% of residents
Programs & Services
Residents Group

Residents meet regularly to discuss policies, care quality, and activities

Family Member Group

Family members meet regularly to discuss policies, care quality, and activities

Active Family Council

Organized group of family members that meets regularly to discuss facility policies, resident care, and activities.

Active Resident Council

Organized group of residents that meets regularly to discuss facility policies, quality of life, and activities.

Finances and operations

Based on CMS SNF Cost Report for fiscal year ending in 12/2023.

For-profit
Corporation
Net patient revenue Info Net patient revenue — what the home actually collects for resident care, after contractual allowances, bad debt and discounts are subtracted from its gross charges (CMS cost report, Worksheet G-3). It covers resident care only; money the home earns from other sources is shown separately as "Other income."
$17.1M
Net patient income Info Net patient income: net patient revenue minus the home's total operating expenses. A positive figure means it earns more from resident care than it spends to deliver it; a negative figure means the opposite. It excludes non-operating "other income."
-$3.1M
For-profit Corporation
Net patient revenue Info Net patient revenue — what the home actually collects for resident care, after contractual allowances, bad debt and discounts are subtracted from its gross charges (CMS cost report, Worksheet G-3). It covers resident care only; money the home earns from other sources is shown separately as "Other income."
$17.1M Rank #18 / 183Revenue — State benchmarkedThis home is ranked 18th out of 183 homes in Wisconsin. Shows this facility's annual revenue compared to the Wisconsin average. Higher revenue generally means more resources for staffing and capital — read alongside Payroll %.Rankings are based only on facilities in Wisconsin that report data for that category. Facilities without available data are excluded from the ranking.Click the rank badge to see the full State ranking.Click here to see the full State ranking.
Net patient income Info Net patient income: net patient revenue minus the home's total operating expenses. A positive figure means it earns more from resident care than it spends to deliver it; a negative figure means the opposite. It excludes non-operating "other income."
-$3.1M
Other income Info Money the home earns outside of resident care — such as investments, grants, rentals and other non-operating sources (CMS cost report, Worksheet G-3). It is tracked separately from net patient revenue: it is not part of that figure, and it is not included in net patient income.
$260.7K
Payroll costs Info Staff salaries plus wage-related costs — benefits such as payroll taxes, health insurance and retirement — from the home's own accounting records (CMS cost report, Worksheet A). Contract or agency labor is counted separately, under other operating costs. Rank #5 / 183Payroll — State benchmarkedThis home is ranked 5th out of 183 homes in Wisconsin. Shows total annual staff payroll benchmarked to the Wisconsin average. Higher payroll investment relative to peers often signals better staffing and less reliance on cheaper contract labor.Rankings are based only on facilities in Wisconsin that report data for that category. Facilities without available data are excluded from the ranking.Click the rank badge to see the full State ranking.Click here to see the full State ranking.
$10.7M 62.6% of net patient revenue Info Payroll as a share of revenue: staff salaries and wage-related benefits divided by net patient revenue. A higher figure means more of each revenue dollar goes to staff pay. Rank #29 / 183Payroll % — State benchmarkedThis home is ranked 29th out of 183 homes in Wisconsin. Shows payroll as a percentage of revenue versus the Wisconsin average. Well-run Wisconsin facilities typically land around 62–74% — the top third Statewide. Below 25% may signal understaffing or heavy agency use — read with Staffing ratings.Rankings are based only on facilities in Wisconsin that report data for that category. Facilities without available data are excluded from the ranking.Click the rank badge to see the full State ranking.Click here to see the full State ranking.
Other operating costs Info Everything it costs to run the home apart from payroll — food, utilities, supplies, maintenance, contract labor and administration. Calculated as total operating expense minus payroll (staff salaries and wage-related benefits).
$9.5M
Total costs Info The home's total operating expense for the year — all the costs of running it, salaries included (CMS cost report, Worksheet G-3).
$20.2M

What does this home offer?

Building type icon
Building type icon

Building Type: Single-story

On-site medical care and health services icon

On-site Medical Care and Health Services

Who this home usually serves

TYPE OF STAY

Mostly short-term rehab stays

Most residents typically stay for a few weeks or months before returning home or moving on.

Most new residents arrive under Medicare (87% of admissions), and a typical Medicare stay runs around 30 days.

Admissions
150 total

Coverage residents most often arrive under.

Medicare 87%
Private pay 10%
Medicaid 3%
Discharges
143 total

Coverage residents most often leave under.

Medicare 63%
Private pay 20%
Medicaid 17%

Places of interest near St. Mary’s Care Center

Address 8.6 miles from city center Info Estimated distance in miles from Madison's city center to St. Mary’s Care Center's address, calculated via Google Maps.

Calculate Travel Distance to St. Mary’s Care Center

Add your location

Address

Compare Nursing Homes around Madison

The information below is reported by the Wisconsin Department of Health Services, Division of Quality Assurance.

St. Mary’s Care Center
NH
Madison (Maple Grove Drive) -
184
Facility 184
WI AVG 61
Rank #6 / 496
-
43
Facility 43
WI AVG 42
Rank #285 / 580
-
Oak Park Nursing & Rehab Center
NH
AL
IL
MC
Madison (North Star) -
100
Facility 100
WI AVG 61
Rank #67 / 496
A+
5
Facility 5
WI AVG 42
Rank #533 / 580
1 Bed / 2 Bed
Sun Prairie Senior Living
NH
ADC
AL
Sun Prairie -
42
Facility 42
WI AVG 61
Rank #337 / 496
A+
74
Facility 74
WI AVG 42
Rank #79 / 580
Studio / 1 Bed / 2 Bed
Edgerton Care Center
NH
HC
RC
Edgerton (Stoughton Road) -
61
Facility 61
WI AVG 61
Rank #184 / 496
F
31
Facility 31
WI AVG 42
Rank #371 / 580
-
The Bay at Belmont Health and Rehabilitation Center
NH
HC
MC
PC
RC
Madison (Rolling Meadows) -
83
Facility 83
WI AVG 61
Rank #113 / 496
A+
50
Facility 50
WI AVG 42
Rank #225 / 580
-

Financial Assistance for
Nursing Home in Wisconsin

St. Mary’s Care Center is located in Madison, Wisconsin.
Here are the financial assistance programs available to residents in Wisconsin.

Get Financial aid guidance

Family Care Program

WI Medicaid Family Care

Age 65+ or disabled
General Wisconsin resident, Medicaid-eligible, long-term care need.
Income Limits (2025) ~$2,829/month 300% FBR, individual
Asset Limits $2,000 (individual), $3,000 (couple).
WI

Managed care model; rural/urban balance.

Benefits
Personal care (5-7 hours/day) Respite (240 hours/year) Adult day care ($65/day) Home modifications ($1,500 avg.)

Wisconsin Caregiver Support Program

WI NFCSP Respite

Age Caregiver of someone 60+ (or with dementia)
General Wisconsin resident.
Income Limits No strict limit; prioritizes low-income.
Asset Limits Not applicable.
WI

High rural demand; ADRC coordination.

Benefits
In-home respite (4-6 hours/day) Adult day care (~$65/day) Short-term facility care (up to 5 days)

IRIS (Include, Respect, I Self-Direct)

Wisconsin IRIS

Age 65+ (or disabled 18+)
General WI resident, Medicaid-eligible, NFLOC.
Income Limits (2025) ~$2,829/month; QIT optional.
Asset Limits $2,000 (individual), $3,000 (couple).
WI

Flexible budget; serves ~20,000; participant hires caregivers.

Benefits
Personal care (custom hours) Respite Home mods Equipment Transportation Support services

SeniorCare Prescription Drug Assistance

Wisconsin SeniorCare

Age 65+
General WI resident, US citizen/qualified immigrant, not on full Medicaid.
Income Limits (2025) ~$24,980-$34,980/year (Level 1-2B, individual); varies by level.
Asset Limits None.
WI

Four benefit levels; serves ~50,000 annually.

Benefits
$5 generic/$15 brand copays (Level 1); deductibles ($500-$850) for higher levels; covers most Rx drugs

Medicare Savings Program (MSP)

Wisconsin Medicare Savings Program

Age 65+ or disabled
General WI resident, Medicare Part A/B.
Income Limits (2025) ~$2,510/month (QMB), ~$3,380/month (SLMB), ~$3,598/month (QI)—individual.
Asset Limits $9,430 (individual), $14,130 (couple).
WI

Includes Extra Help for Part D; no waitlist.

Benefits
Covers Part B premiums ($174.70/month) Deductibles ($240/year) Copays (~20%)

Wisconsin Home Energy Assistance Program (WHEAP)

Wisconsin WHEAP

Age 60+ prioritized
General WI resident, low-income household.
Income Limits (2025) ~$3,970/month 185% FPL
Asset Limits Not assessed.
WI

Covers gas, electric, wood; crisis aid available.

Benefits
Heating/electric aid ($300-$1,000/season) Crisis aid ($500 max) Weatherization

VA Aid and Attendance (A&A) and Housebound Benefits

Wisconsin VA Aid and Attendance/Housebound

Age 65+ or disabled veteran/spouse
General WI resident, wartime service, ADL help (A&A) or homebound.
Income Limits (2025) Net income < ~$1,984/month (veteran with dependent, A&A); pension offsets income.
Asset Limits ~$155,356 net worth
WI

High rural veteran use; supports care costs.

Benefits
Cash (~$1,433-$2,642/month veteran, ~$951-$1,318 spouse) for care costs

Property Tax Deferral Loan Program

Wisconsin Property Tax Deferral Loan

Age 65+
General WI resident, homeowner, live in home 6+ months/year.
Income Limits (2025) ~$24,980/year household
Asset Limits Home equity < $500,000; limited other assets.
WI

Saves ~$500-$1,500/year; interest ~2%-3%.

Benefits
Deferred tax payment (~$500-$1,500/year avg.)

Senior Farmers’ Market Nutrition Program (SFMNP)

Wisconsin SFMNP

Age 60+
General WI resident, low-income.
Income Limits (2025) ~$2,322/month 185% FPL
Asset Limits Not assessed.
WI

Vouchers (~$45/season); serves ~15,000 annually.

Benefits
Vouchers (~$45/season) for produce at farmers’ markets

Frequently Asked Questions about St. Mary’s Care Center

What neighborhood is St. Mary’s Care Center in?

St. Mary’s Care Center is in the Maple Grove Drive neighborhood.

Is St. Mary’s Care Center in a walkable area?

St. Mary’s Care Center has a walk score of 43. Somewhat walkable. A few nearby services may be reachable on foot, but most trips require transportation.

What is the occupancy rate at St. Mary’s Care Center?

St. Mary’s Care Center's occupancy is 58.7%.

Does St. Mary’s Care Center operate as a for-profit or non-profit?

St. Mary’s Care Center is registered as a for-profit.

Are there photos of St. Mary’s Care Center?

Yes — there are 7 photos of St. Mary’s Care Center in the photo gallery on this page.

What is the address of St. Mary’s Care Center?

St. Mary’s Care Center is located at 3401 Maple Grove Dr, Madison, WI 53719.

What is the phone number of St. Mary’s Care Center?

(608) 845-1000 will put you in contact with the team at St. Mary’s Care Center.

Guides for Better Senior Living

Care Cost Calculator: See Prices in Your Area

Nursing Home Data Explorer

Don’t Wait Too Long: 7 Red Flag Signs Your Parent Needs Assisted Living Now

The True Cost of Assisted Living in 2025 – And How Families Are Paying For It

Understanding Senior Living Costs: Pricing Models, Discounts & Financial Assistance