Stone River Post Acute
Nursing Home, Hospice Care, Memory Care, Palliative Care & Respite Care · Murfreesboro, TN
CMS overall rating Info CMS (the Centers for Medicare & Medicaid Services) is the federal agency that rates nursing home quality. Its Overall Rating runs from 1 to 5 stars, combining health inspections, staffing, and quality measures, with inspections weighted most heavily.

Stone River Post Acute

Nursing Home, Hospice Care, Memory Care, Palliative Care & Respite Care · Murfreesboro, TN
CMS overall rating Info CMS (the Centers for Medicare & Medicaid Services) is the federal agency that rates nursing home quality. Its Overall Rating runs from 1 to 5 stars, combining health inspections, staffing, and quality measures, with inspections weighted most heavily.
Calculator: See prices in your area
Stone River Post Acute accepts Medicare, Medicaid, and private pay.

Overview of Stone River Post Acute

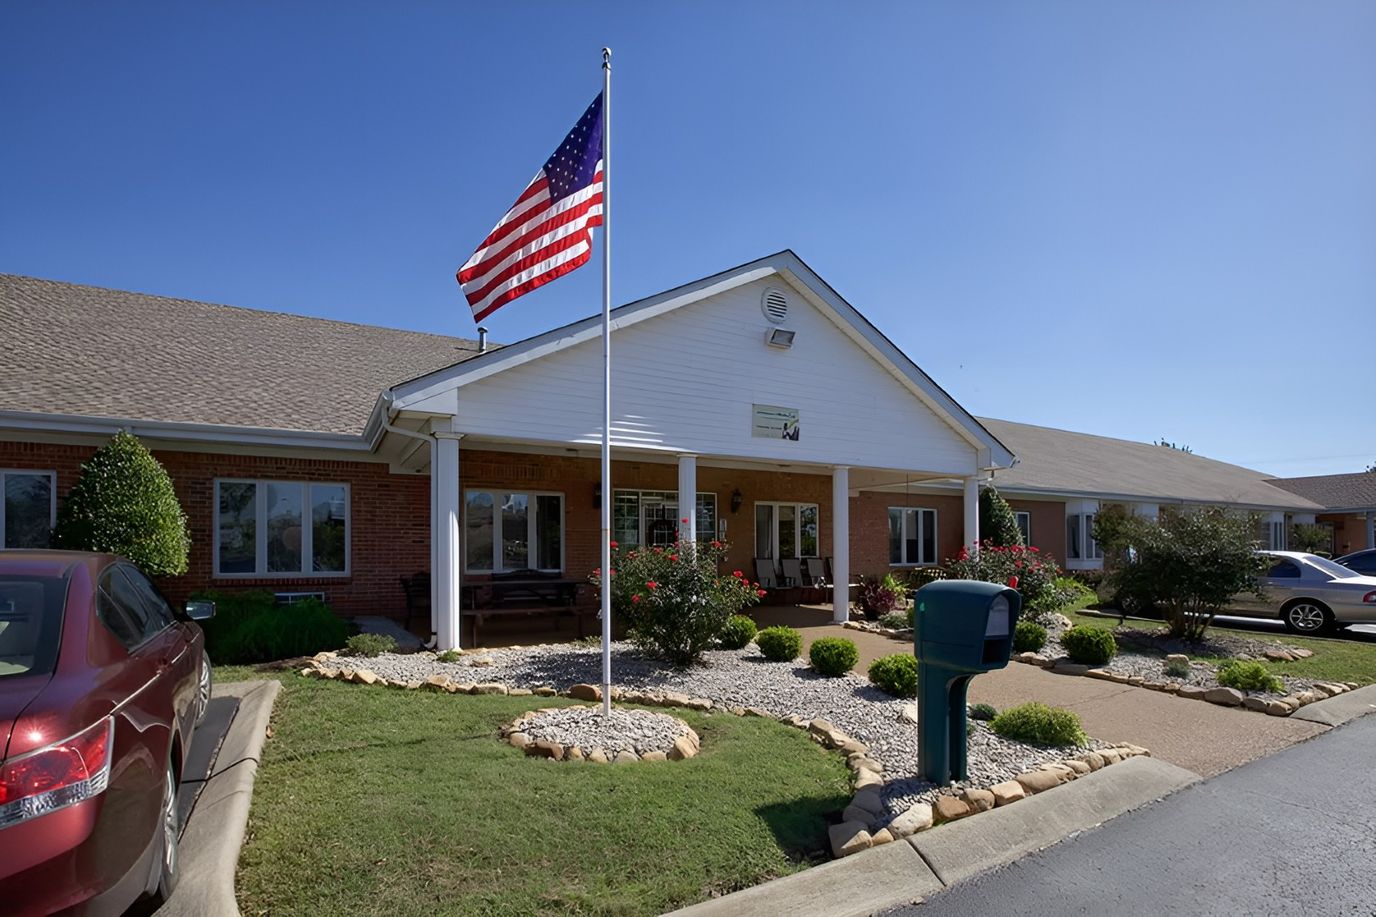
Stone River Post Acute is a nursing home in Murfreesboro, TN, offering skilled nursing, rehabilitation, and respite care. With a nurturing and welcoming environment, the community strives to keep older adults comfortable and safe. Residents also experience a worry-free lifestyle, with 24-hour care, dietitian-supervised meals, and therapy services. Personalized care plans are also created to meet residents’ unique needs and preferences, ensuring they can recover and live to their potential.

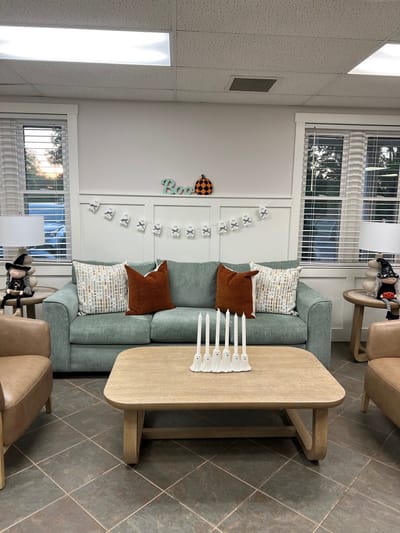
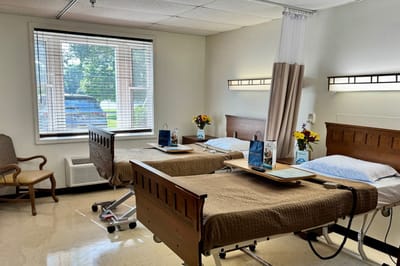
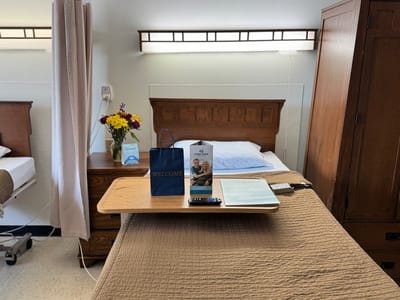
Field trips, parties, and musical performances foster interactions and encourage residents to live actively. Residents can also relax and move around comfortably in its spacious common areas and cozy rooms. Located near restaurants, shops, a bank, and bus stops, the community ensures residents have easy access to their necessities and leisure. Providing exceptional services and top-notch amenities, this nursing home is a good option for senior living in Tennessee.

Quality ratings

Measured by Centers for Medicare & Medicaid Services (CMS)

Overall rating Info The Overall CMS Rating combines results from health inspections, staffing levels and quality measures. Health inspections carry the most weight. Staffing and quality scores can increase or decrease the final rating based on performance compared to state and national standards.
▲ 5.9% Above TN avg. ▲ 5.9% Above TN avg.TN average: 2.8Click the badge to see the full State ranking.Click here to see the full State ranking.
Health Inspection Info Based on the results of the facility's three most recent standard inspections and any complaint investigations. CMS reviews the number, scope, and severity of deficiencies, with more recent findings weighted more heavily.
▲ 7.7% Above TN avg. ▲ 7.7% Above TN avg.TN average: 2.8Click the badge to see the full State ranking.Click here to see the full State ranking.
Staffing Info Measures average nursing staff hours per resident per day, including Registered Nurses (RNs) and total nursing staff. Ratings are adjusted based on the level of care residents require and are compared to state and national benchmarks.
▼ 17.2% Below TN avg. ▼ 17.2% Below TN avg.TN average: 2.4Click the badge to see the full State ranking.Click here to see the full State ranking.
Quality Measures Info Based on clinical and physical health indicators reported to CMS, such as hospital readmissions, falls, pressure ulcers, and improvements in mobility. These measures reflect how well residents' health needs are being managed.
▼ 12.8% Below TN avg. ▼ 12.8% Below TN avg.TN average: 3.4Click the badge to see the full State ranking.Click here to see the full State ranking.

Staffing hours breakdown

Info Daily nursing hours per resident by staff type, reported to CMS. Higher is generally better — compare this facility to state and national averages to see where staffing stands.

Hours per resident per day — compared to Tennessee state averages

Total nursing care / resident Info This home is ranked 79th out of 192 homes in Tennessee for nurse hours. Total adjusted nursing hours per resident per day, combining RN, LPN, and aide time. CMS adjusts this for case-mix so facilities can be fairly compared.
3h 27m per day
Rank #79 / 192Nurse hours — State benchmarkedThis home is ranked 79th out of 192 homes in Tennessee. Shows adjusted nurse hours per resident per day benchmarked to the Tennessee average, with a ranking across 192 Tennessee facilities. More hours mean more direct care. The national average is about 3.5 hrs; below 3.0 is a red flag.Rankings are based only on facilities in Tennessee that report data for that category. Facilities without available data are excluded from the ranking.Click the rank badge to see the full State ranking.Click here to see the full State ranking.
This facility Tennessee avg (3h 38m per day)
vs Tennessee avg
-5%

2 of 6 metrics below state avg

Standout metric Physical Therapist is +40% above state avg
Staff typeHours / Day / Residentvs state avg
Registered Nurse (RN) Info RNs hold the highest nursing license and can assess residents, interpret test results, and direct care plans. More RN hours per day often signals stronger clinical oversight and faster response to health changes. 32m per day ▼ 13% State avg: 37m per day · National avg: 41m per day
LPN / LVN Info Licensed Practical Nurses (LPNs) or Licensed Vocational Nurses (LVNs) deliver routine hands-on care — medication administration, wound dressing, and monitoring vital signs. They work under RN supervision and make up a large share of daily bedside care. 1h 30m per day ▲ 37% State avg: 1h 6m per day · National avg: 52m per day
Nurse Aide Info Certified Nurse Aides (CNAs) provide the most direct day-to-day assistance: bathing, dressing, feeding, and mobility. Nurse aide hours are typically the largest staffing category and directly affect residents' quality of life. 2h 7m per day ■ Avg State avg: 2h 9m per day · National avg: 2h 21m per day
Weekend Total Nursing Info Combined nursing hours (RN + LPN + Nurse Aide) per resident per day on weekends. Staffing often drops on weekends — this figure reveals whether the facility maintains adequate coverage outside of weekday hours. 3h 21m per day ■ Avg State avg: 3h 21m per day · National avg: 3h 26m per day
Physical Therapist Info Hours per resident per day provided by licensed Physical Therapists (PTs) or PT Assistants. PT services help residents recover mobility after injury or illness and are especially important for post-acute (short-stay) rehabilitation. 7m per day ▲ 40% State avg: 5m per day · National avg: 4m per day
Weekend RN Info Registered nurse hours specifically on weekends. Facilities sometimes reduce RN presence on Saturdays and Sundays — a low weekend RN figure compared to weekday hours can indicate reduced clinical oversight when most administrative staff are absent. 12m per day ▼ 52% State avg: 25m per day · National avg: 29m per day

Capacity and availability

Smaller home

May offer a more intimate, personalized care environment.

Total beds 68

This home usually has limited availability

Higher occupancy than the Tennessee average: 73%
Occupancy rate
87.9% Rank #76 / 319Occupancy rate — State benchmarkedThis home is ranked 76th out of 319 homes in Tennessee. Shows this facility's occupancy rate versus the Tennessee average, with its Statewide rank out of 319. Higher occupancy signals strong local demand and financial stability.Rankings are based only on facilities in Tennessee that report data for that category. Facilities without available data are excluded from the ranking.Click the rank badge to see the full State ranking.Click here to see the full State ranking.
Avg. Length of Stay
87 days
Walk Score
Walk Score: 56 / 100 Rank #86 / 553Walk Score — State benchmarkedThis home is ranked 86th out of 553 homes in Tennessee. Shows how walkable this facility's neighborhood is compared to the average Walk Score across Tennessee facilities. Higher scores benefit residents, families, and staff.Rankings are based only on facilities in Tennessee that report data for that category. Facilities without available data are excluded from the ranking.Click the rank badge to see the full State ranking.Click here to see the full State ranking.
Moderately walkable. Some errands can be accomplished on foot, with a mix of nearby amenities.

Contact Stone River Post Acute

Penalties and fines

Federal penalties imposed by CMS for regulatory violations, including civil money penalties (fines) and denials of payment for new Medicare/Medicaid admissions.

Source: CMS Penalties Database

No penalties in the past 3 years

No civil money penalties or payment denials were reported in the last 3 years.

Quality of care over time

These measures show how residents usually do over time at this home, based on health outcomes and preventive care.

Short-stay resident measures
Average Info CMS star rating based on short-stay quality measure performance. 5 stars = much above average, 1 star = much below average.
Re-hospitalized after SNF stay Info Percentage of short-stay residents who were re-hospitalized after their nursing home admission. 21.7%
In line with Tennessee average

Tennessee average: 22.2%

Emergency department visits Info Percentage of short-stay residents who had an outpatient emergency department visit. 13.9%
24% worse than Tennessee average

Tennessee average: 11.2%

Falls with major injury Info Percentage of SNF residents who experience falls with major injury during their stay. 0.0%
100% better than Tennessee average

Tennessee average: 0.8%

Ability to care for self at discharge Info Percentage of residents at or above expected ability to care for themselves at discharge. 50.0%
7% worse than Tennessee average

Tennessee average: 53.7%

Successful return to home or community Info Rate of successful return to home or community from a skilled nursing facility. 44.0%
13% worse than Tennessee average

Tennessee average: 50.6%

Breakdown by payment type

Medicare

18% of new residents, usually for short-term rehab.

Typical stay 26 days

Private pay

75% of new residents, often for short stays.

Typical stay 1 - 2 months

Medicaid

6% of new residents, often for long-term daily care.

Typical stay 2 years

Finances and operations

Based on CMS SNF Cost Report for fiscal year ending in 12/2023.

For-profit
Corporation
Net patient revenue Info Net patient revenue — what the home actually collects for resident care, after contractual allowances, bad debt and discounts are subtracted from its gross charges (CMS cost report, Worksheet G-3). It covers resident care only; money the home earns from other sources is shown separately as "Other income."
$6.7M
Net patient income Info Net patient income: net patient revenue minus the home's total operating expenses. A positive figure means it earns more from resident care than it spends to deliver it; a negative figure means the opposite. It excludes non-operating "other income."
-$989.4K
For-profit Corporation
Net patient revenue Info Net patient revenue — what the home actually collects for resident care, after contractual allowances, bad debt and discounts are subtracted from its gross charges (CMS cost report, Worksheet G-3). It covers resident care only; money the home earns from other sources is shown separately as "Other income."
$6.7M Rank #149 / 196Revenue — State benchmarkedThis home is ranked 149th out of 196 homes in Tennessee. Shows this facility's annual revenue compared to the Tennessee average. Higher revenue generally means more resources for staffing and capital — read alongside Payroll %.Rankings are based only on facilities in Tennessee that report data for that category. Facilities without available data are excluded from the ranking.Click the rank badge to see the full State ranking.Click here to see the full State ranking.
Net patient income Info Net patient income: net patient revenue minus the home's total operating expenses. A positive figure means it earns more from resident care than it spends to deliver it; a negative figure means the opposite. It excludes non-operating "other income."
-$989.4K
Other income Info Money the home earns outside of resident care — such as investments, grants, rentals and other non-operating sources (CMS cost report, Worksheet G-3). It is tracked separately from net patient revenue: it is not part of that figure, and it is not included in net patient income.
$658.2K
Payroll costs Info Staff salaries plus wage-related costs — benefits such as payroll taxes, health insurance and retirement — from the home's own accounting records (CMS cost report, Worksheet A). Contract or agency labor is counted separately, under other operating costs. Rank #134 / 196Payroll — State benchmarkedThis home is ranked 134th out of 196 homes in Tennessee. Shows total annual staff payroll benchmarked to the Tennessee average. Higher payroll investment relative to peers often signals better staffing and less reliance on cheaper contract labor.Rankings are based only on facilities in Tennessee that report data for that category. Facilities without available data are excluded from the ranking.Click the rank badge to see the full State ranking.Click here to see the full State ranking.
$2.9M 43.6% of net patient revenue Info Payroll as a share of revenue: staff salaries and wage-related benefits divided by net patient revenue. A higher figure means more of each revenue dollar goes to staff pay. Rank #108 / 196Payroll % — State benchmarkedThis home is ranked 108th out of 196 homes in Tennessee. Shows payroll as a percentage of revenue versus the Tennessee average. Well-run Tennessee facilities typically land around 50–60% — the top third Statewide. Below 25% may signal understaffing or heavy agency use — read with Staffing ratings.Rankings are based only on facilities in Tennessee that report data for that category. Facilities without available data are excluded from the ranking.Click the rank badge to see the full State ranking.Click here to see the full State ranking.
Other operating costs Info Everything it costs to run the home apart from payroll — food, utilities, supplies, maintenance, contract labor and administration. Calculated as total operating expense minus payroll (staff salaries and wage-related benefits).
$4.7M
Total costs Info The home's total operating expense for the year — all the costs of running it, salaries included (CMS cost report, Worksheet G-3).
$7.6M

What does this home offer?

Housing options icon

Housing Options: Private Rooms

Building type icon
Building type icon

Building Type: Single-story

Housekeeping icon
Housekeeping icon

Housekeeping Services

Social and recreational activities icon

Social and Recreational Activities

On-site medical care and health services icon

On-site Medical Care and Health Services

Rehabilitative support icon

Rehabilitative Support

Who this home usually serves

TYPE OF STAY

Primarily short stays

Residents typically stay for brief periods, with frequent admissions and discharges throughout the year.

Most new residents arrive under private pay (75% of admissions), and a typical private pay stay runs around 1 - 2 months.

Admissions
261 total

Coverage residents most often arrive under.

Medicare 18%
Private pay 75%
Medicaid 6%
Discharges
251 total

Coverage residents most often leave under.

Medicare 20%
Private pay 74%
Medicaid 6%

Places of interest near Stone River Post Acute

Address 2.3 miles from city center Info Estimated distance in miles from Murfreesboro's city center to Stone River Post Acute's address, calculated via Google Maps.

Calculate Travel Distance to Stone River Post Acute

Add your location

Address

Compare Nursing Homes around Murfreesboro

The information below is reported by the Tennessee Department of Health, Division of Health Care Facilities.

4 facilities compared · CMS & TN Dept. of Health data

NHC HealthCare Murfreesboro
NH
HC
NC
Murfreesboro
181
Facility 181
TN AVG 88
Rank #13 / 426
27.6%
Facility 27.6%
TN AVG 73%
Rank #316 / 319
-62%
3.61
Facility 3.61
TN AVG 3.63
Rank #70 / 192
+40%0%
$0
Facility $0
TN AVG $90.9k
Rank #1 / 198
16
Facility 16
TN AVG 15.4
Rank #103 / 196
5.3
Facility 5.3
TN AVG 4.4
Rank #140 / 196
250A+
0
Facility 0
TN AVG 34
Rank #531 / 553
Lynn Foster
$14.3M
Facility $14.3M
TN AVG $11.5M
Rank #60 / 196
$7.8M
Facility $7.8M
TN AVG $4.6M
Rank #38 / 196
54.5%
Facility 54.5%
TN AVG 41%
Rank #51 / 196
445108
Stones River Manor, Inc.
NH
ADC
AL
IL
MC
RC
Murfreesboro
30
Facility 30
TN AVG 88
Rank #411 / 426
91.9%
Facility 91.9%
TN AVG 73%
Rank #47 / 319
+26%
6.09
Facility 6.09
TN AVG 3.63
Rank #3 / 192
-59%+68%
$0
Facility $0
TN AVG $90.9k
Rank #1 / 198
17
Facility 17
TN AVG 15.4
Rank #117 / 196
3.4
Facility 3.4
TN AVG 4.4
Rank #66 / 196
-26-
5
Facility 5
TN AVG 34
Rank #480 / 553
Jeffrey Adcock
$4.7M
Facility $4.7M
TN AVG $11.5M
Rank #184 / 196
$2.6M
Facility $2.6M
TN AVG $4.6M
Rank #184 / 196
55%
Facility 55%
TN AVG 41%
Rank #67 / 196
445534
Park View Meadows
NH
AL
HC
RC
Murfreesboro (Haynes Haven)
42
Facility 42
TN AVG 88
Rank #381 / 426
81.0%
Facility 81.0%
TN AVG 73%
Rank #86 / 319
+11%
3.74
Facility 3.74
TN AVG 3.63
Rank #61 / 192
+29%+3%
$0
Facility $0
TN AVG $90.9k
Rank #1 / 198
16
Facility 16
TN AVG 15.4
Rank #103 / 196
5.3
Facility 5.3
TN AVG 4.4
Rank #140 / 196
-96A+
50
Facility 50
TN AVG 34
Rank #139 / 553
Lakeshore Estates, Inc
$11.7M
Facility $11.7M
TN AVG $11.5M
Rank #73 / 196
$7.0M
Facility $7.0M
TN AVG $4.6M
Rank #53 / 196
60.4%
Facility 60.4%
TN AVG 41%
Rank #55 / 196
445496
AdamsPlace
NH
AL
IL
MC
Murfreesboro (Haynes Haven)
149
Facility 149
TN AVG 88
Rank #39 / 426
67.8%
Facility 67.8%
TN AVG 73%
Rank #23 / 319
-7%
3.71
Facility 3.71
TN AVG 3.63
Rank #61 / 192
+33%+2%
$0
Facility $0
TN AVG $90.9k
Rank #1 / 198
3
Facility 3
TN AVG 15.4
Rank #11 / 196
3.0
Facility 3.0
TN AVG 4.4
Rank #48 / 196
-40-
49
Facility 49
TN AVG 34
Rank #149 / 553
John Winfree
$14.1M
Facility $14.1M
TN AVG $11.5M
Rank #55 / 196
$8.3M
Facility $8.3M
TN AVG $4.6M
Rank #39 / 196
58.9%
Facility 58.9%
TN AVG 41%
Rank #62 / 196
445392

Financial Assistance for
Nursing Home in Tennessee

Stone River Post Acute is located in Murfreesboro, Tennessee.
Here are the financial assistance programs available to residents in Tennessee.

Get Financial aid guidance

CHOICES Program

TN Medicaid CHOICES

Age 65+ or disabled
General Tennessee resident, Medicaid-eligible, nursing home-level care need.
Income Limits (2025) ~$2,829/month 300% FBR, individual
Asset Limits $2,000 (individual), $3,000 (couple).
TN

Managed care model; high rural demand.

Benefits
Personal care (5-7 hours/day) Respite (240 hours/year) Adult day care ($65/day) Home modifications ($1,500 avg.)

Tennessee Options for Community Living

TN Options

Age 60+
General Tennessee resident, at risk of nursing home.
Income Limits ~$2,000/month individual, varies
Asset Limits $5,000 individual
TN

Limited funding; rural/urban balance.

Benefits
In-home care (3-5 hours/week) Respite (up to 10 days/year) Transportation (~5 trips/month)

Medicare Savings Program (MSP)

Tennessee Medicare Savings Program

Age 65+ or disabled
General TN resident, Medicare Part A/B.
Income Limits (2025) ~$2,510/month (QMB), ~$3,380/month (SLMB), ~$3,598/month (QI)—individual.
Asset Limits $9,430 (individual), $14,130 (couple).
TN

Three tiers; includes Extra Help for Part D; no waitlist.

Benefits
Covers Part B premiums ($174.70/month) Deductibles ($240/year) Copays (~20%)

Family Caregiver Support Program (FCSP)

Tennessee Family Caregiver Support Program

Age
General Caregivers of 60+ needing care or 55+ caregivers of others; TN resident; functional needs (2+ ADLs).
Income Limits (2025) No strict cap; prioritizes low-income ~$24,980/year
Asset Limits Not assessed; need-based.
TN

Includes grandparent caregivers; high rural demand.

Benefits
Respite (4-6 hours/week or 5 days/year) Adult day care ($60/day) Training Supplies (~$500/year)

VA Aid and Attendance (A&A) and Housebound Benefits

Tennessee VA Aid and Attendance/Housebound

Age 65+ or disabled veteran/spouse
General TN resident, wartime service, need for ADL help (A&A) or homebound.
Income Limits (2025) Net income < ~$1,984/month (veteran with dependent, A&A); pension offsets income.
Asset Limits ~$155,356 net worth limit
TN

High veteran population; supports rural/urban care needs.

Benefits
Cash (~$1,433-$2,642/month veteran, ~$951-$1,318 spouse) for care costs (e.g., in-home, assisted living)

Elderly Nutrition Program

Tennessee Elderly Nutrition Program

Age 60+
General TN resident; no income limit but prioritizes low-income.
Income Limits (2025) None; donations encouraged.
Asset Limits Not assessed.
TN

Serves ~50,000 annually; 200+ congregate sites plus Meals on Wheels.

Benefits
Congregate meals ($5-$7/meal value) at senior centers Home-delivered meals ($5-$7/meal)

Property Tax Relief Program

Tennessee Property Tax Relief Program

Age 65+
General TN resident, homeowner/renter (or widow/er 50+, disabled 18+).
Income Limits (2025) ~$45,000/year household, excludes half of Social Security
Asset Limits Not assessed; income-focused.
TN

Rebates up to $1,000; serves ~100,000 annually.

Benefits
Tax rebates (~$250-$1,000 based on income; e.g., $1,000 if income < $8,000)

Frequently Asked Questions about Stone River Post Acute

What neighborhood is Stone River Post Acute in?

Stone River Post Acute is in the Haynes Haven neighborhood.

Is Stone River Post Acute in a walkable area?

Stone River Post Acute has a walk score of 56. Moderately walkable. Some errands can be accomplished on foot, with a mix of nearby amenities.

What is the occupancy rate at Stone River Post Acute?

Stone River Post Acute's occupancy is 87.9%.

Does Stone River Post Acute operate as a for-profit or non-profit?

Stone River Post Acute is registered as a for-profit.

Are there photos of Stone River Post Acute?

Yes — there are 6 photos of Stone River Post Acute in the photo gallery on this page.

What is the address of Stone River Post Acute?

Stone River Post Acute is located at 202 Mtcs Rd, Murfreesboro, TN 37129.

What is the phone number of Stone River Post Acute?

(615) 849-8748 will put you in contact with the team at Stone River Post Acute.

Guides for Better Senior Living

Care Cost Calculator: See Prices in Your Area

Nursing Home Data Explorer

Don’t Wait Too Long: 7 Red Flag Signs Your Parent Needs Assisted Living Now

The True Cost of Assisted Living in 2025 – And How Families Are Paying For It

Understanding Senior Living Costs: Pricing Models, Discounts & Financial Assistance