Sugar Loaf Senior Living
Nursing Home, Assisted Living, Hospice Care, Memory Care & Nursing Care · Winona, MN
CMS overall rating Info CMS (the Centers for Medicare & Medicaid Services) is the federal agency that rates nursing home quality. Its Overall Rating runs from 1 to 5 stars, combining health inspections, staffing, and quality measures, with inspections weighted most heavily.

Sugar Loaf Senior Living

Nursing Home, Assisted Living, Hospice Care, Memory Care & Nursing Care · Winona, MN
CMS overall rating Info CMS (the Centers for Medicare & Medicaid Services) is the federal agency that rates nursing home quality. Its Overall Rating runs from 1 to 5 stars, combining health inspections, staffing, and quality measures, with inspections weighted most heavily.
Calculator: See prices in your area
Sugar Loaf Senior Living accepts Medicare, Medicaid, and private pay.

Overview of Sugar Loaf Senior Living

Sugar Loaf Senior Living is a senior living community located in Winona, MN. It offers Assisted Living and Memory Care options for seniors with special needs. The community focuses on providing a comfortable atmosphere and engaging lifestyle for its residents.

Quality ratings

Measured by Centers for Medicare & Medicaid Services (CMS)

Overall rating Info The Overall CMS Rating combines results from health inspections, staffing levels and quality measures. Health inspections carry the most weight. Staffing and quality scores can increase or decrease the final rating based on performance compared to state and national standards.
Health Inspection Info Based on the results of the facility's three most recent standard inspections and any complaint investigations. CMS reviews the number, scope, and severity of deficiencies, with more recent findings weighted more heavily.
Staffing Info Measures average nursing staff hours per resident per day, including Registered Nurses (RNs) and total nursing staff. Ratings are adjusted based on the level of care residents require and are compared to state and national benchmarks.
Quality Measures Info Based on clinical and physical health indicators reported to CMS, such as hospital readmissions, falls, pressure ulcers, and improvements in mobility. These measures reflect how well residents' health needs are being managed.

Staffing hours breakdown

Info Daily nursing hours per resident by staff type, reported to CMS. Higher is generally better — compare this facility to state and national averages to see where staffing stands.

Hours per resident per day — compared to state averages

Total nursing care / resident Info Total adjusted nursing hours per resident per day, combining RN, LPN, and aide time. CMS adjusts this for case-mix so facilities can be fairly compared.
4h 7m per day
Rank #64 / 89Nurse hours — State benchmarkedThis home is ranked 64th out of 89 homes in Minnesota. Shows adjusted nurse hours per resident per day benchmarked to the Minnesota average, with a ranking across 89 Minnesota facilities. More hours mean more direct care. The national average is about 3.5 hrs; below 3.0 is a red flag.Rankings are based only on facilities in Minnesota that report data for that category. Facilities without available data are excluded from the ranking.Click the rank badge to see the full State ranking.Click here to see the full State ranking.
vs avg
Staff typeHours / Day / Residentvs state avg
Registered Nurse (RN) Info RNs hold the highest nursing license and can assess residents, interpret test results, and direct care plans. More RN hours per day often signals stronger clinical oversight and faster response to health changes. 49m per day
LPN / LVN Info Licensed Practical Nurses (LPNs) or Licensed Vocational Nurses (LVNs) deliver routine hands-on care — medication administration, wound dressing, and monitoring vital signs. They work under RN supervision and make up a large share of daily bedside care. 37m per day
Nurse Aide Info Certified Nurse Aides (CNAs) provide the most direct day-to-day assistance: bathing, dressing, feeding, and mobility. Nurse aide hours are typically the largest staffing category and directly affect residents' quality of life. 1h 59m per day
Weekend Total Nursing Info Combined nursing hours (RN + LPN + Nurse Aide) per resident per day on weekends. Staffing often drops on weekends — this figure reveals whether the facility maintains adequate coverage outside of weekday hours. 3h 0m per day
Physical Therapist Info Hours per resident per day provided by licensed Physical Therapists (PTs) or PT Assistants. PT services help residents recover mobility after injury or illness and are especially important for post-acute (short-stay) rehabilitation. 12m per day
Weekend RN Info Registered nurse hours specifically on weekends. Facilities sometimes reduce RN presence on Saturdays and Sundays — a low weekend RN figure compared to weekday hours can indicate reduced clinical oversight when most administrative staff are absent. 33m per day

Capacity and availability

Avg. Length of Stay
72 days
Bed community size
92-bed community Rank #139 / 532Bed count — State benchmarkedThis home is ranked 139th out of 532 homes in Minnesota. Shows this facility's certified or reported bed count compared to other Minnesota facilities. Larger communities may offer more amenities, programs, and on-site services for residents and families.Rankings are based only on facilities in Minnesota that report data for that category. Facilities without available data are excluded from the ranking.Click the rank badge to see the full State ranking.Click here to see the full State ranking.
A larger shared setting that may offer more common spaces and organized community services.
Years in operation
18 years in operation Rank #50 / 137Years in operation — State benchmarkedThis home is ranked 50th out of 137 homes in Minnesota. Shows how long this facility has been in operation compared to other Minnesota facilities. Longer operating histories may benefit residents, families, and staff.Rankings are based only on facilities in Minnesota that report data for that category. Facilities without available data are excluded from the ranking.Click the rank badge to see the full State ranking.Click here to see the full State ranking.
A longer operating history, which may indicate experience navigating regulations and delivering ongoing care.
Walk Score
Walk Score: 51 / 100 Rank #243 / 632Walk Score — State benchmarkedThis home is ranked 243rd out of 632 homes in Minnesota. Shows how walkable this facility's neighborhood is compared to the average Walk Score across Minnesota facilities. Higher scores benefit residents, families, and staff.Rankings are based only on facilities in Minnesota that report data for that category. Facilities without available data are excluded from the ranking.Click the rank badge to see the full State ranking.Click here to see the full State ranking.
Moderately walkable. Some errands can be accomplished on foot, with a mix of nearby amenities.
BBB Rating
BBB Rating: A+ (Not Accredited)
An independent rating from the Better Business Bureau based on factors such as complaint history, transparency, and business practices.
How BBB ratings work

About this community

Occupancy

Occupancy rate
89%
Rank #81 / 331Occupancy rate — State benchmarkedThis home is ranked 81st out of 331 homes in Minnesota. Shows this facility's occupancy rate versus the Minnesota average, with its Statewide rank out of 331. Higher occupancy signals strong local demand and financial stability.Rankings are based only on facilities in Minnesota that report data for that category. Facilities without available data are excluded from the ranking.Click the rank badge to see the full State ranking.Click here to see the full State ranking.
Higher than the Minnesota average: 79.7%
Occupied beds
82 / 92
Average occupied beds in Minnesota homes 59 beds

License Details

Facility TypeAssisted Living
StatusApproved For Dementia Care
CountyWinona

Staffing

Key information about the people who lead and staff this community.

Leadership

ContactRochelle Langlois, Owner/Manager

Staffing & Medical

2 services
Licensed Nurses/CNAs
24-Hour Staffing

Amenities & Lifestyle

Touring HoursMonday-Friday: 9 AM – 5 PM, Saturday: By appointment, Sunday: By appointment

Contact Sugar Loaf Senior Living

Health Inspection History

Inspections since 2022
Total health inspections 6

State average N/A


Last Health inspection on Jul 2025

Total health citations
28 Rank #50 / 90Health citations — State benchmarkedThis home is ranked 50th out of 90 homes in Minnesota. Shows this facility's total health deficiency citations benchmarked to the Minnesota State average, with a ranking across all 90 MN facilities. Lower citation counts earn a better rank.Rankings are based only on facilities in Minnesota that report data for that category. Facilities without available data are excluded from the ranking.Click the rank badge to see the full State ranking.Click here to see the full State ranking.

State average N/A

Citations per inspection
4.67 Rank #64 / 90Citations per inspection — State benchmarkedThis home is ranked 64th out of 90 homes in Minnesota. Shows average deficiency citations per CMS inspection for this facility versus the Minnesota mean across 90 facilities with citation data. Lower is better.Rankings are based only on facilities in Minnesota that report data for that category. Facilities without available data are excluded from the ranking.Click the rank badge to see the full State ranking.Click here to see the full State ranking.

State average N/A


Health citations are formal notices following inspections when they fail to comply with safety and care standards.

19 of 28 citations resulted from standard inspections; 8 of 28 resulted from complaint investigations; and 1 of 28 came from combined inspections (standard and complaint).

Breakdown of citation severity (last 4 years)
Critical health citations
1
In line with State average

State average: N/A


Serious health citations
1
In line with State average

State average: N/A

1 critical citation State average: N/A

1 serious citation State average: N/A

24 moderate citations State average: N/A

2 minor citations State average: N/A
Citations history (last 4 years)
Quality of Care serious citation Jul 15, 2025
Corrected

Quality of Care moderate citation Jul 15, 2025
Corrected

Care Planning moderate citation Jul 15, 2025
Corrected

Resident Rights moderate citation Jul 15, 2025
Corrected

Lawsuit overview for Sugar Loaf Senior Living

Summary of court-record activity tied to this facility, compiled from publicly available case dockets.

Source: State court e-filing records

Total Cases Info Every lawsuit on record involving this facility since the earliest filing. Long-term volume signals overall legal exposure. 10
Lawsuits Info Total lawsuits on record, broken down by case type. Distinguishes lawsuits from other court filings such as probate documents. 1 Conciliation (1)
Active Cases Info Lawsuits still moving through the courts. Active claims can affect day-to-day operations, settlement risk, and insurance posture. 0
Closed Info Cases that have been disposed of — dismissed, settled, or decided. Shows how the facility has historically resolved disputes. 1
Most Recent Info Most recent filing on record. Recent activity means legal disputes are still being raised against this facility. 03/02/2018

Staffing Data

Reporting period: October 1 – December 31, 2025 (Q4 2025). Source: CMS Payroll-Based Journal report.

Total staff 172
Employees 97
Contractors 75
Staff to resident ratio 3.25 : 1
0% compared with State average

State average ratio: 0 : 0

Avg staff/day 33
Average shift 7.3 hours
0% compared with State average

State average: 0 hours

Total staff hours (quarter) 22,061

Nursing staff breakdown

Q4 2025 · Oct 1 – Dec 31 More info This data comes from the CMS Payroll-Based Journal report covering October 1 – December 31, 2025.
Registered Nurse

Manages medical care and health needs.

RN Staff Info 18 total: 8 full-time employees and 10 contractors. 18
Average shift length Info Average shift length. Calculated as total hours divided by days worked and average staff per day. 8 hours
Licensed Practical Nurse

Assists with medical care and medications.

LPN Staff Info 20 total: 13 full-time employees and 7 contractors. 20
Average shift length Info Average shift length. Calculated as total hours divided by days worked and average staff per day. 7.4 hours
Certified Nursing Assistant

Helps with daily care and mobility.

CNA Staff Info 81 total: 29 full-time employees and 52 contractors. 81
Average shift length Info Average shift length. Calculated as total hours divided by days worked and average staff per day. 7.7 hours

Contractor staffing

Q4 2025 · Oct 1 – Dec 31 More info This data comes from the CMS Payroll-Based Journal report covering October 1 – December 31, 2025.

Total hours from contractors

10.4%

2,301 contractor hours this quarter

Certified Nursing Assistant: 52 Registered Nurse: 10 Licensed Practical Nurse: 7 Occupational Therapy Aide: 3 Administrator: 1 Medical Director: 1 Occupational Therapy Assistant: 1

Staff by category

Q4 2025 · Oct 1 – Dec 31 More info This data comes from the CMS Payroll-Based Journal report covering October 1 – December 31, 2025.
Certified Nursing Assistant2952819,13892100%7.7
Registered Nurse810183,02992100%8
Licensed Practical Nurse137202,92192100%7.4
Other Dietary Services Staff4041,0377278%7
Respiratory Therapy Technician8089427379%6.4
Speech Language Pathologist7078407480%5.5
Physical Therapy Aide9097457480%6.2
Physical Therapy Assistant7074986874%5.1
Dental Services Staff2024895964%7.9
Nurse Practitioner1014886166%8
Administrator0114725964%8
Clinical Nurse Specialist1014325459%8
Medication Aide/Technician2023504751%7.4
Dietitian1012526368%4
Qualified Social Worker4042526267%3.8
Occupational Therapy Aide1341451921%6
Medical Director0112089%2.4
Occupational Therapy Assistant0111533%5
81 Certified Nursing Assistant
% of Days 100%
18 Registered Nurse
% of Days 100%
20 Licensed Practical Nurse
% of Days 100%
4 Other Dietary Services Staff
% of Days 78%
8 Respiratory Therapy Technician
% of Days 79%
7 Speech Language Pathologist
% of Days 80%
9 Physical Therapy Aide
% of Days 80%
7 Physical Therapy Assistant
% of Days 74%
2 Dental Services Staff
% of Days 64%
1 Nurse Practitioner
% of Days 66%
1 Administrator
% of Days 64%
1 Clinical Nurse Specialist
% of Days 59%
2 Medication Aide/Technician
% of Days 51%
1 Dietitian
% of Days 68%
4 Qualified Social Worker
% of Days 67%
4 Occupational Therapy Aide
% of Days 21%
1 Medical Director
% of Days 9%
1 Occupational Therapy Assistant
% of Days 3%

Penalties and fines

Includes penalties issued in 2023

Federal penalties imposed by CMS for regulatory violations, including civil money penalties (fines) and denials of payment for new Medicare/Medicaid admissions.

Source: CMS Penalties Database (Data as of Jan 2026)

Total fines amount $16K Rank #57 / 90Federal fines — State benchmarkedThis home is ranked 57th out of 90 homes in Minnesota. Shows this facility's cumulative CMS federal fine dollars versus the Minnesota average among facilities with fines, and where it ranks among 90 facilities in the pool. Lower total dollars mean a better rank.Rankings are based only on facilities in Minnesota that report data for that category. Facilities without available data are excluded from the ranking.Click the rank badge to see the full State ranking.Click here to see the full State ranking.
64% lower than State average

State average: $44K

Number of fines 1
50% fewer fines than State average

State average: 2.0

Payment Denials Info Serious action where Medicare and/or Medicaid temporarily stops payments for new residents until issues are fixed. 0
100% fewer payment denials than State average

State average: 0.4

Fines amount comparison
This facility $16K
State average $44K
Penalty History

Penalties are imposed by CMS for violations of federal nursing home regulations.

1 penalty in the past 3 years

Aug 22, 2023 · $16K

Civil Money Penalty Info Fines imposed for noncompliance, which can be assessed per day or per instance of violation. Aug 22, 2023
$16K

Last updated: Jan 2026

Quality of care over time

These measures show how residents usually do over time at this home, based on health outcomes and preventive care.

High-risk clinical events score Info A composite score based on pressure ulcers, falls with injury, weight loss, walking ability decline, and activities of daily living decline. 14.3
28% worse than State average

State average: 11.1

Functional decline score Info A composite score based on activities of daily living decline, walking ability decline, and incontinence. 28.4
26% worse than State average

State average: 22.6

Long-stay resident measures
Need for Help with Daily Activities Increased Info Percent of long-stay residents whose need for help with daily activities has increased 29.0%
53% worse than State average

State average: 18.9%

Walking Ability Worsened Info Percent of long-stay residents whose ability to move independently worsened 32.9%
38% worse than State average

State average: 23.8%

Low Risk Residents with Bowel/Bladder Incontinence Info Percent of low risk long-stay residents who lose control of their bowels or bladder 23.3%
7% better than State average

State average: 25.0%

Falls with Major Injury Info Percent of long-stay residents experiencing one or more falls with major injury 1.2%
67% better than State average

State average: 3.7%

High Risk Residents with Pressure Ulcers Info Percent of long-stay high risk residents with pressure ulcers 5.6%
In line with State average

State average: 5.4%

Urinary Tract Infection Info Percent of long-stay residents with a urinary tract infection 4.9%
82% worse than State average

State average: 2.7%

Lost Too Much Weight Info Percent of long-stay residents who lose too much weight 2.7%
35% better than State average

State average: 4.1%

Depressive Symptoms Info Percent of long-stay residents who have depressive symptoms 2.1%
52% better than State average

State average: 4.4%

Antipsychotic Use Info Percent of long-stay residents who received an antipsychotic medication 5.1%
70% better than State average

State average: 17.2%

Pneumococcal Vaccine Info Percent of long-stay residents assessed and appropriately given the pneumococcal vaccine 100.0%
In line with State average

State average: 97.3%

Influenza Vaccine Info Percent of long-stay residents assessed and appropriately given the seasonal influenza vaccine 100.0%
In line with State average

State average: 96.0%

Short-stay resident measures
Pneumococcal Vaccine Info Percent of short-stay residents assessed and appropriately given the pneumococcal vaccine 97.2%
9% better than State average

State average: 88.9%

Antipsychotic medication increase Info Percent of short-stay residents who newly received an antipsychotic medication 3.3%
72% worse than State average

State average: 1.9%

Influenza Vaccine Info Percent of short-stay residents assessed and appropriately given the seasonal influenza vaccine 97.8%
18% better than State average

State average: 82.6%

Breakdown by payment type

Medicare

26% of new residents, usually for short-term rehab.

Typical stay 17 days

Private pay

57% of new residents, often for short stays.

Typical stay 1 - 2 months

Medicaid

17% of new residents, often for long-term daily care.

Typical stay 4 - 5 months

Facility Characteristics

Source: CMS Long-Term Care Facility Characteristics (Data as of Jan 2026)

Total residents 53
Medicare
8
15.1% of residents
Medicaid
24
45.3% of residents
Private pay or other
21
39.6% of residents
Programs & Services
Residents Group

Residents meet regularly to discuss policies, care quality, and activities

Active Resident Council

Organized group of residents that meets regularly to discuss facility policies, quality of life, and activities.

Finances and operations

Based on CMS SNF Cost Report for fiscal year ending in 06/2024.

Nonprofit
Nonprofit Corporation
Net patient revenue Info Net patient revenue — what the home actually collects for resident care, after contractual allowances, bad debt and discounts are subtracted from its gross charges (CMS cost report, Worksheet G-3). It covers resident care only; money the home earns from other sources is shown separately as "Other income."
$7.6M
Net patient income Info Net patient income: net patient revenue minus the home's total operating expenses. A positive figure means it earns more from resident care than it spends to deliver it; a negative figure means the opposite. It excludes non-operating "other income."
-$7.1M
Nonprofit Nonprofit Corporation
Net patient revenue Info Net patient revenue — what the home actually collects for resident care, after contractual allowances, bad debt and discounts are subtracted from its gross charges (CMS cost report, Worksheet G-3). It covers resident care only; money the home earns from other sources is shown separately as "Other income."
$7.6M Rank #33 / 89Revenue — State benchmarkedThis home is ranked 33rd out of 89 homes in Minnesota. Shows this facility's annual revenue compared to the Minnesota average. Higher revenue generally means more resources for staffing and capital — read alongside Payroll %.Rankings are based only on facilities in Minnesota that report data for that category. Facilities without available data are excluded from the ranking.Click the rank badge to see the full State ranking.Click here to see the full State ranking.
Net patient income Info Net patient income: net patient revenue minus the home's total operating expenses. A positive figure means it earns more from resident care than it spends to deliver it; a negative figure means the opposite. It excludes non-operating "other income."
-$7.1M
Other income Info Money the home earns outside of resident care — such as investments, grants, rentals and other non-operating sources (CMS cost report, Worksheet G-3). It is tracked separately from net patient revenue: it is not part of that figure, and it is not included in net patient income.
$7.4M
Payroll costs Info Staff salaries plus wage-related costs — benefits such as payroll taxes, health insurance and retirement — from the home's own accounting records (CMS cost report, Worksheet A). Contract or agency labor is counted separately, under other operating costs. Rank #65 / 89Payroll — State benchmarkedThis home is ranked 65th out of 89 homes in Minnesota. Shows total annual staff payroll benchmarked to the Minnesota average. Higher payroll investment relative to peers often signals better staffing and less reliance on cheaper contract labor.Rankings are based only on facilities in Minnesota that report data for that category. Facilities without available data are excluded from the ranking.Click the rank badge to see the full State ranking.Click here to see the full State ranking.
$3.9M 51.5% of net patient revenue Info Payroll as a share of revenue: staff salaries and wage-related benefits divided by net patient revenue. A higher figure means more of each revenue dollar goes to staff pay. Rank #89 / 89Payroll % — State benchmarkedThis home is ranked 89th out of 89 homes in Minnesota. Shows payroll as a percentage of revenue versus the Minnesota average. Well-run Minnesota facilities typically land around 61–68% — the top third Statewide. Below 25% may signal understaffing or heavy agency use — read with Staffing ratings.Rankings are based only on facilities in Minnesota that report data for that category. Facilities without available data are excluded from the ranking.Click the rank badge to see the full State ranking.Click here to see the full State ranking.
Other operating costs Info Everything it costs to run the home apart from payroll — food, utilities, supplies, maintenance, contract labor and administration. Calculated as total operating expense minus payroll (staff salaries and wage-related benefits).
$10.8M
Total costs Info The home's total operating expense for the year — all the costs of running it, salaries included (CMS cost report, Worksheet G-3).
$14.7M

Who this home usually serves

TYPE OF STAY

Mix of rehab and long-term care

This home supports both short-term rehab and long-term care, with residents staying for a wide range of durations.

Most new residents arrive under private pay (57% of admissions), and a typical private pay stay runs around 1 - 2 months.

Admissions
351 total

Coverage residents most often arrive under.

Medicare 26%
Private pay 57%
Medicaid 17%
Discharges
257 total

Coverage residents most often leave under.

Medicare 28%
Private pay 65%
Medicaid 7%

Places of interest near Sugar Loaf Senior Living

Address 0.0 miles from city center Info Estimated distance in miles from Winona's city center to Sugar Loaf Senior Living's address, calculated via Google Maps.

Calculate Travel Distance to Sugar Loaf Senior Living

Add your location

Address

Frequently Asked Questions about Sugar Loaf Senior Living

Is Sugar Loaf Senior Living in a walkable area?

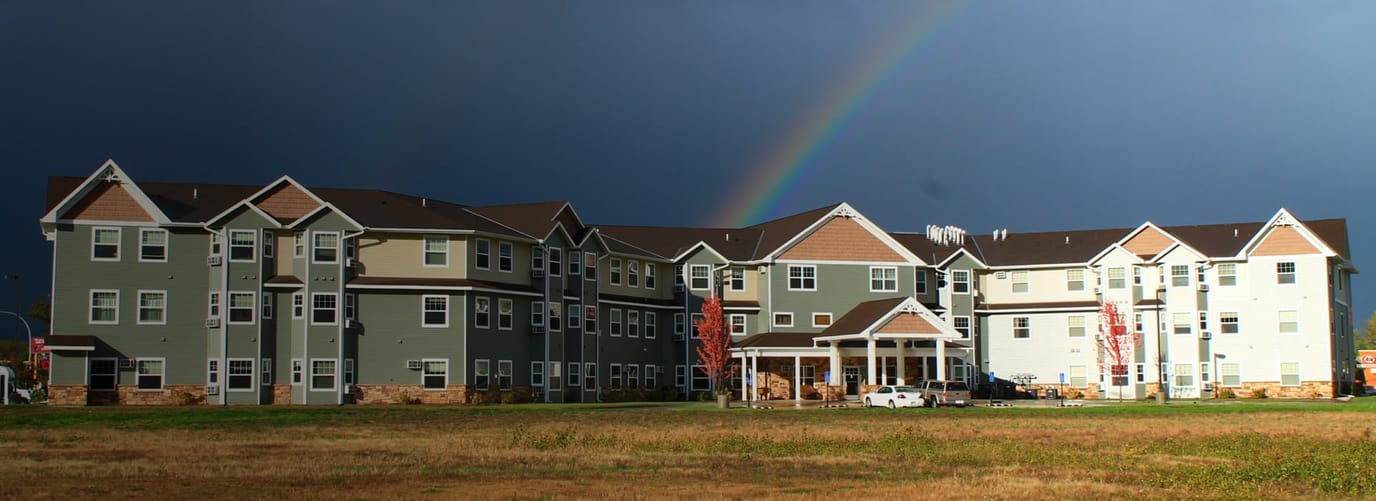
Sugar Loaf Senior Living has a walk score of 51. Moderately walkable. Some errands can be accomplished on foot, with a mix of nearby amenities.

What is the occupancy rate at Sugar Loaf Senior Living?

Sugar Loaf Senior Living's occupancy is 89%.

Does Sugar Loaf Senior Living operate as a for-profit or non-profit?

Sugar Loaf Senior Living is registered as a non-profit in MN.

How many beds does Sugar Loaf Senior Living have?

Sugar Loaf Senior Living has 92 beds.

Are there photos of Sugar Loaf Senior Living?

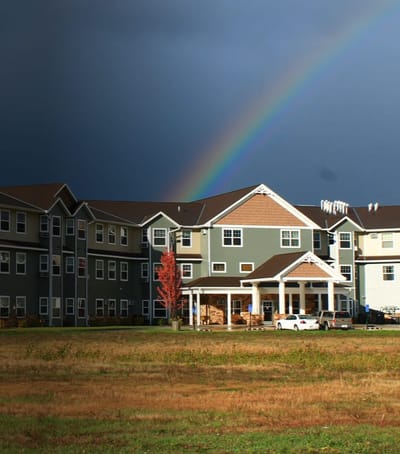
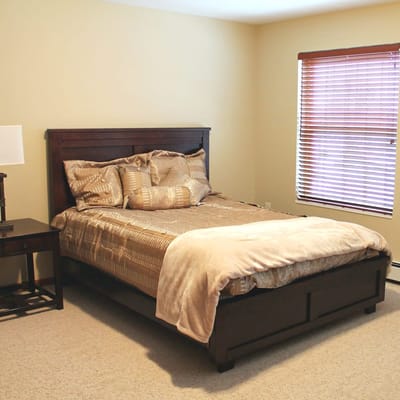
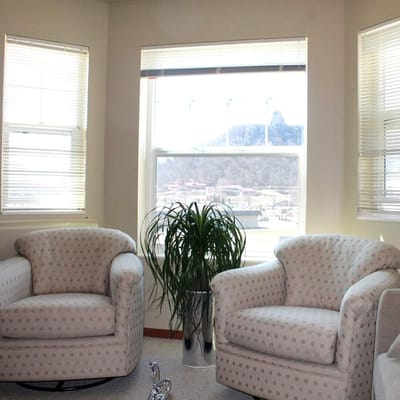
Yes — there are 11 photos of Sugar Loaf Senior Living in the photo gallery on this page.

What is the address of Sugar Loaf Senior Living?

Sugar Loaf Senior Living is located at 765 Menard Road, Winona, MN 55987.

What is the phone number of Sugar Loaf Senior Living?

(507) 452-1277 will put you in contact with the team at Sugar Loaf Senior Living.

Guides for Better Senior Living

Care Cost Calculator: See Prices in Your Area

Nursing Home Data Explorer

Don’t Wait Too Long: 7 Red Flag Signs Your Parent Needs Assisted Living Now

The True Cost of Assisted Living in 2025 – And How Families Are Paying For It

Understanding Senior Living Costs: Pricing Models, Discounts & Financial Assistance