The Greens at Cannondale
Nursing Home, Assisted Living, Memory Care & Respite Care · Wilton, CT
CMS overall rating Info CMS (the Centers for Medicare & Medicaid Services) is the federal agency that rates nursing home quality. Its Overall Rating runs from 1 to 5 stars, combining health inspections, staffing, and quality measures, with inspections weighted most heavily.

The Greens at Cannondale

Nursing Home, Assisted Living, Memory Care & Respite Care · Wilton, CT
CMS overall rating Info CMS (the Centers for Medicare & Medicaid Services) is the federal agency that rates nursing home quality. Its Overall Rating runs from 1 to 5 stars, combining health inspections, staffing, and quality measures, with inspections weighted most heavily.
Calculator: See prices in your area
The Greens at Cannondale accepts Medicare, Medicaid, and private pay.

Overview of The Greens at Cannondale

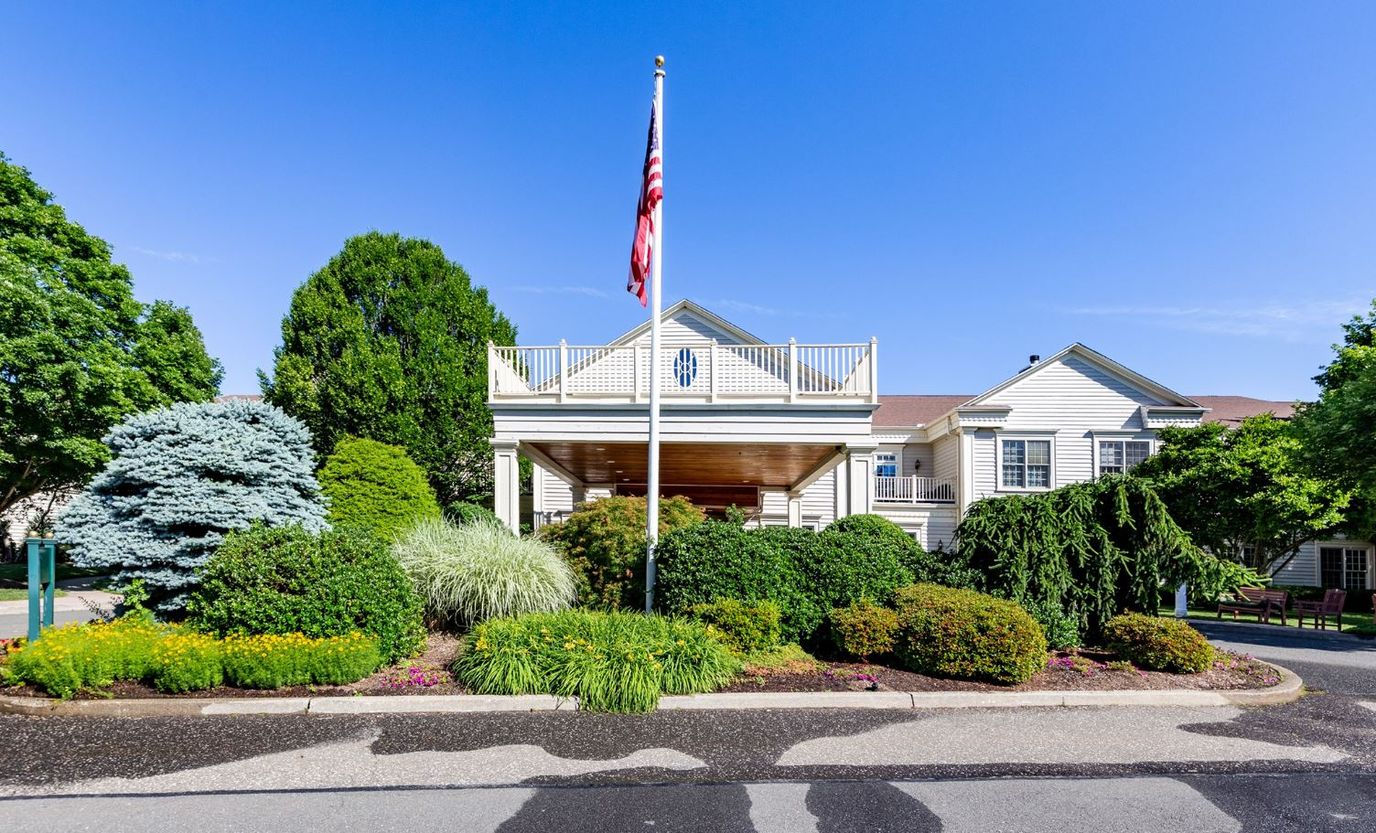
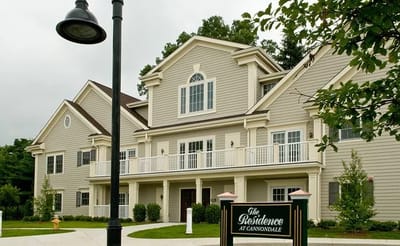
A community with unparalleled care for independent living, memory care, assisted living, skilled nursing, and rehabilitative care, The Greens at Cannondale is delivered with integrity and respect for its seniors. The resident-focused community focuses on conducting results-driven programs with cutting-edge technologies that specifically cater to the varying needs of the residents. The Greens have been committed to providing seniors a safe and comfortable environment for a transformative experience.

The Greens is an expansive community that awaits endless opportunities to be discovered. The nursing home care services include pain management, diabetes management, restorative nursing, wound care, and a team of 24/7 nurses. Assisted living and memory care services include ADLS, medication management, stimulating activities, and enriching programs.

Quality ratings

Measured by Centers for Medicare & Medicaid Services (CMS)

Overall rating Info The Overall CMS Rating combines results from health inspections, staffing levels and quality measures. Health inspections carry the most weight. Staffing and quality scores can increase or decrease the final rating based on performance compared to state and national standards.
▼ 34.2% Below CT avg. ▼ 34.2% Below CT avg.CT average: 3.0Click the badge to see the full State ranking.Click here to see the full State ranking.
Health Inspection Info Based on the results of the facility's three most recent standard inspections and any complaint investigations. CMS reviews the number, scope, and severity of deficiencies, with more recent findings weighted more heavily.
▼ 28.5% Below CT avg. ▼ 28.5% Below CT avg.CT average: 2.8Click the badge to see the full State ranking.Click here to see the full State ranking.
Staffing Info Measures average nursing staff hours per resident per day, including Registered Nurses (RNs) and total nursing staff. Ratings are adjusted based on the level of care residents require and are compared to state and national benchmarks.
▼ 7.5% Below CT avg. ▼ 7.5% Below CT avg.CT average: 3.2Click the badge to see the full State ranking.Click here to see the full State ranking.
Quality Measures Info Based on clinical and physical health indicators reported to CMS, such as hospital readmissions, falls, pressure ulcers, and improvements in mobility. These measures reflect how well residents' health needs are being managed.
▼ 14.7% Below CT avg. ▼ 14.7% Below CT avg.CT average: 3.5Click the badge to see the full State ranking.Click here to see the full State ranking.

Staffing hours breakdown

Info Daily nursing hours per resident by staff type, reported to CMS. Higher is generally better — compare this facility to state and national averages to see where staffing stands.

Hours per resident per day — compared to Connecticut state averages

Total nursing care / resident Info This home is ranked 23rd out of 67 homes in Connecticut for nurse hours. Total adjusted nursing hours per resident per day, combining RN, LPN, and aide time. CMS adjusts this for case-mix so facilities can be fairly compared.
3h 58m per day
Rank #23 / 67Nurse hours — State benchmarkedThis home is ranked 23rd out of 67 homes in Connecticut. Shows adjusted nurse hours per resident per day benchmarked to the Connecticut average, with a ranking across 67 Connecticut facilities. More hours mean more direct care. The national average is about 3.5 hrs; below 3.0 is a red flag.Rankings are based only on facilities in Connecticut that report data for that category. Facilities without available data are excluded from the ranking.Click the rank badge to see the full State ranking.Click here to see the full State ranking.
This facility Connecticut avg (3h 58m per day)
vs Connecticut avg
+0%

3 of 6 metrics below state avg

Standout metric LPN / LVN is +59% above state avg
Staff typeHours / Day / Residentvs state avg
Registered Nurse (RN) Info RNs hold the highest nursing license and can assess residents, interpret test results, and direct care plans. More RN hours per day often signals stronger clinical oversight and faster response to health changes. 26m per day ▼ 38% State avg: 42m per day · National avg: 41m per day
LPN / LVN Info Licensed Practical Nurses (LPNs) or Licensed Vocational Nurses (LVNs) deliver routine hands-on care — medication administration, wound dressing, and monitoring vital signs. They work under RN supervision and make up a large share of daily bedside care. 1h 20m per day ▲ 59% State avg: 50m per day · National avg: 52m per day
Nurse Aide Info Certified Nurse Aides (CNAs) provide the most direct day-to-day assistance: bathing, dressing, feeding, and mobility. Nurse aide hours are typically the largest staffing category and directly affect residents' quality of life. 2h 13m per day ■ Avg State avg: 2h 16m per day · National avg: 2h 20m per day
Weekend Total Nursing Info Combined nursing hours (RN + LPN + Nurse Aide) per resident per day on weekends. Staffing often drops on weekends — this figure reveals whether the facility maintains adequate coverage outside of weekday hours. 3h 37m per day ▲ 5% State avg: 3h 26m per day · National avg: 3h 27m per day
Physical Therapist Info Hours per resident per day provided by licensed Physical Therapists (PTs) or PT Assistants. PT services help residents recover mobility after injury or illness and are especially important for post-acute (short-stay) rehabilitation. 3m per day ▼ 47% State avg: 5m per day · National avg: 4m per day
Weekend RN Info Registered nurse hours specifically on weekends. Facilities sometimes reduce RN presence on Saturdays and Sundays — a low weekend RN figure compared to weekday hours can indicate reduced clinical oversight when most administrative staff are absent. 11m per day ▼ 59% State avg: 27m per day · National avg: 29m per day

Capacity and availability

This home usually has limited availability

Higher occupancy than the Connecticut average: 84%
Occupancy rate
92.6% Rank #26 / 72Occupancy rate — State benchmarkedThis home is ranked 26th out of 72 homes in Connecticut. Shows this facility's occupancy rate versus the Connecticut average, with its Statewide rank out of 72. Higher occupancy signals strong local demand and financial stability.Rankings are based only on facilities in Connecticut that report data for that category. Facilities without available data are excluded from the ranking.Click the rank badge to see the full State ranking.Click here to see the full State ranking.
Avg. Length of Stay
38 days
Bed community size
148-bed community Rank #27 / 123Bed count — State benchmarkedThis home is ranked 27th out of 123 homes in Connecticut. Shows this facility's certified or reported bed count compared to other Connecticut facilities. Larger communities may offer more amenities, programs, and on-site services for residents and families.Rankings are based only on facilities in Connecticut that report data for that category. Facilities without available data are excluded from the ranking.Click the rank badge to see the full State ranking.Click here to see the full State ranking.
A larger shared setting that may offer more common spaces and organized community services.
Years in operation
30 years in operation Rank #8 / 132Years in operation — State benchmarkedThis home is ranked 8th out of 132 homes in Connecticut. Shows how long this facility has been in operation compared to other Connecticut facilities. Longer operating histories may benefit residents, families, and staff.Rankings are based only on facilities in Connecticut that report data for that category. Facilities without available data are excluded from the ranking.Click the rank badge to see the full State ranking.Click here to see the full State ranking.
A longer operating history, which may indicate experience navigating regulations and delivering ongoing care.
Walk Score
Walk Score: 17 / 100 Rank #221 / 264Walk Score — State benchmarkedThis home is ranked 221st out of 264 homes in Connecticut. Shows how walkable this facility's neighborhood is compared to the average Walk Score across Connecticut facilities. Higher scores benefit residents, families, and staff.Rankings are based only on facilities in Connecticut that report data for that category. Facilities without available data are excluded from the ranking.Click the rank badge to see the full State ranking.Click here to see the full State ranking.
Car-dependent. Most errands require a car, with limited nearby walkable options.

About this community

License Details

StatusActive
IssuanceJanuary 4, 2008
ExpirationMarch 31, 2026 Expired
License NumberAL0025

Contact The Greens at Cannondale

Inspection History

In Connecticut, the Department of Public Health, Facility Licensing and Investigations Section conducts mandatory inspections and unannounced surveys to monitor the quality of care in long-term facilities.

Since 2016 · 10 years of data 44 deficiencies 6 inspections

Inspection Scorecard Info This scorecard compares key inspection, deficiency, and complaint metrics at this facility against the Connecticut state average. Metrics rated ≥15% worse than average are highlighted in red; those ≥15% better are highlighted in green.

Since 2016 vs. Connecticut state average
Overall vs. CT average 3 Worse Metrics worse than Connecticut average:
• Total deficiencies (132% above)
• Deficiencies per year (132% above)
• Deficiencies per inspection (387% above)
1 Better Metrics better than Connecticut average:
• Total inspections (54% below)
Latest Inspection April 7, 2025

Deficiencies Info Deficiencies are formal regulatory issues recorded during state inspections.

This FacilityCT Averagevs. CT Avg
Total deficiencies Info Formal regulatory issues recorded by inspectors across all inspection types. 4419 This facility has 132% more total deficiencies than a typical Connecticut nursing home (44 vs. CT avg 19).↑ 132% worse
Deficiencies per year Info Average deficiencies per year since 2016. 4.41.9 This facility has 132% more deficiencies per year than a typical Connecticut nursing home (4.4 vs. CT avg 1.9).↑ 132% worse
Deficiencies per inspection Info Average deficiencies per inspection. 7.31.5 This facility has 387% more deficiencies per inspection than a typical Connecticut nursing home (7.3 vs. CT avg 1.5).↑ 387% worse

Inspections Info State inspections evaluate whether the facility meets health and safety standards.

This FacilityCT Averagevs. CT Avg
Total inspections Info Combined count of all routine and focused inspections. Excludes complaint investigations. 613 This facility has 54% fewer total inspections than a typical Connecticut nursing home (6 vs. CT avg 13).↓ 54% better

Inspection Reports Summary Info An editor-reviewed summary of the themes and findings across this facility's recent inspection reports.

  • June 2, 2022 renewal inspections found no violations and confirmed compliance with Alzheimer's care and infection prevention requirements.
  • February 4, 2025 complaint investigation substantiated violations of Connecticut statutes and regulations, as detailed in a violation letter dated March 19, 2025.
  • January 2, 2020 investigation found failure to perform required two-hour safety checks for a high-fall-risk client, resulting in injury and deficient documentation.

Health Inspection History

Inspections since 2020
Total health inspections 7

Connecticut average 5.7


Last Health inspection on Oct 2024

Total health citations
35 Rank #48 / 69Health citations — State benchmarkedThis home is ranked 48th out of 69 homes in Connecticut. Shows this facility's total health deficiency citations benchmarked to the Connecticut State average, with a ranking across all 69 CT facilities. Lower citation counts earn a better rank.Rankings are based only on facilities in Connecticut that report data for that category. Facilities without available data are excluded from the ranking.Click the rank badge to see the full State ranking.Click here to see the full State ranking.

Connecticut average 32

Citations per inspection
5 Rank #28 / 69Citations per inspection — State benchmarkedThis home is ranked 28th out of 69 homes in Connecticut. Shows average deficiency citations per CMS inspection for this facility versus the Connecticut mean across 69 facilities with citation data. Lower is better.Rankings are based only on facilities in Connecticut that report data for that category. Facilities without available data are excluded from the ranking.Click the rank badge to see the full State ranking.Click here to see the full State ranking.

Connecticut average 5.82


Health citations are formal notices following inspections when they fail to comply with safety and care standards.

25 of 35 citations resulted from standard inspections; and 10 of 35 resulted from complaint investigations.

Breakdown of citation severity (last 6 years)
Critical health citations
2
567% worse than Connecticut average

Connecticut average: 0.3


Serious health citations
1
43% worse than Connecticut average

Connecticut average: 0.7

2 critical citations Connecticut average: 0.3

1 serious citation Connecticut average: 0.7

31 moderate citations Connecticut average: 28.8

1 minor citation Connecticut average: 2.3
Citations history (last 6 years)
Abuse/Neglect moderate citation Oct 09, 2024
Corrected

Infection Control moderate citation Oct 09, 2024
Corrected

Infection Control moderate citation Oct 09, 2024
Corrected

Nursing Services moderate citation Oct 09, 2024
Corrected

Staffing Data

Reporting period: October 1 – December 31, 2025 (Q4 2025). Source: CMS Payroll-Based Journal report.

Total staff 181
Employees 138
Contractors 43
Staff to resident ratio 1.40 : 1
25% fewer staff per resident than Connecticut average
Connecticut average ratio: 1.86 : 1 Connecticut average ratio: 1.86 : 1See full Connecticut ranking
Avg staff/day 74
Average shift 7.9 hours
5% better than Connecticut average
Connecticut average: 7.5 hours Connecticut average shift: 7.5 hoursSee full Connecticut ranking
Total staff hours (quarter) 53,574

Nursing staff breakdown

Q4 2025 · Oct 1 – Dec 31 More info This data comes from the CMS Payroll-Based Journal report covering October 1 – December 31, 2025.
Registered Nurse

Manages medical care and health needs.

RN Staff Info 12 total: 8 full-time employees and 4 contractors. 12
Average shift length Info Average shift length. Calculated as total hours divided by days worked and average staff per day. 8.3 hours
Licensed Practical Nurse

Assists with medical care and medications.

LPN Staff Info 44 total: 28 full-time employees and 16 contractors. 44
Average shift length Info Average shift length. Calculated as total hours divided by days worked and average staff per day. 8 hours
Certified Nursing Assistant

Helps with daily care and mobility.

CNA Staff Info 67 total: 66 full-time employees and 1 contractor. 67
Average shift length Info Average shift length. Calculated as total hours divided by days worked and average staff per day. 8.2 hours

Contractor staffing

Q4 2025 · Oct 1 – Dec 31 More info This data comes from the CMS Payroll-Based Journal report covering October 1 – December 31, 2025.

Total hours from contractors

8.2%

4,377 contractor hours this quarter

Licensed Practical Nurse: 16 Respiratory Therapy Technician: 6 Physical Therapy Assistant: 6 Registered Nurse: 4 Clinical Nurse Specialist: 2 Qualified Social Worker: 2 Medical Director: 2 Occupational Therapy Assistant: 2 Certified Nursing Assistant: 1 Speech Language Pathologist: 1 Physical Therapy Aide: 1

Staff by category

Q4 2025 · Oct 1 – Dec 31 More info This data comes from the CMS Payroll-Based Journal report covering October 1 – December 31, 2025.
Certified Nursing Assistant6616725,09192100%8.2
Licensed Practical Nurse2816449,98892100%8
RN Director of Nursing150155,13892100%8.4
Registered Nurse84122,70892100%8.3
Other Dietary Services Staff8082,69692100%7.4
Clinical Nurse Specialist5271,6646672%7.8
Physical Therapy Assistant0661,2647379%7.5
Dental Services Staff4041,0426672%7.6
Qualified Social Worker0225576368%5.3
Administrator1015126470%8
Respiratory Therapy Technician0664806975%4.9
Dietitian1014756368%7.5
Nurse Practitioner1014716267%7.6
Physical Therapy Aide0114576166%7.5
Speech Language Pathologist0114545863%7.8
Occupational Therapy Aide1013734953%7.6
Medical Director0221313437%3.1
Occupational Therapy Assistant022762729%2.3
67 Certified Nursing Assistant
% of Days 100%
44 Licensed Practical Nurse
% of Days 100%
15 RN Director of Nursing
% of Days 100%
12 Registered Nurse
% of Days 100%
8 Other Dietary Services Staff
% of Days 100%
7 Clinical Nurse Specialist
% of Days 72%
6 Physical Therapy Assistant
% of Days 79%
4 Dental Services Staff
% of Days 72%
2 Qualified Social Worker
% of Days 68%
1 Administrator
% of Days 70%
6 Respiratory Therapy Technician
% of Days 75%
1 Dietitian
% of Days 68%
1 Nurse Practitioner
% of Days 67%
1 Physical Therapy Aide
% of Days 66%
1 Speech Language Pathologist
% of Days 63%
1 Occupational Therapy Aide
% of Days 53%
2 Medical Director
% of Days 37%
2 Occupational Therapy Assistant
% of Days 29%

Penalties and fines

Includes penalties issued in 2024

Federal penalties imposed by CMS for regulatory violations, including civil money penalties (fines) and denials of payment for new Medicare/Medicaid admissions.

Source: CMS Penalties Database (Data as of Jan 2026)

Total fines amount $16K Rank #50 / 69Federal fines — State benchmarkedThis home is ranked 50th out of 69 homes in Connecticut. Shows this facility's cumulative CMS federal fine dollars versus the Connecticut average among facilities with fines, and where it ranks among 69 facilities in the pool. Lower total dollars mean a better rank.Rankings are based only on facilities in Connecticut that report data for that category. Facilities without available data are excluded from the ranking.Click the rank badge to see the full State ranking.Click here to see the full State ranking.
62% lower than Connecticut average

Connecticut average: $44K

Number of fines 1
43% fewer fines than Connecticut average

Connecticut average: 1.7

Payment Denials Info Serious action where Medicare and/or Medicaid temporarily stops payments for new residents until issues are fixed. 0
100% fewer payment denials than Connecticut average

Connecticut average: 0.1

Fines amount comparison
This facility $16K
Connecticut average $44K
Penalty History

Penalties are imposed by CMS for violations of federal nursing home regulations.

1 penalty in the past 3 years

Apr 19, 2024 · $16K

Civil Money Penalty Info Fines imposed for noncompliance, which can be assessed per day or per instance of violation. Apr 19, 2024
$16K

Last updated: Jan 2026

Quality of care over time

These measures show how residents usually do over time at this home, based on health outcomes and preventive care.

High-risk clinical events score Info A composite score based on pressure ulcers, falls with injury, weight loss, walking ability decline, and activities of daily living decline. 10.3
In line with Connecticut average

Connecticut average: 10.4

Functional decline score Info A composite score based on activities of daily living decline, walking ability decline, and incontinence. 22.0
In line with Connecticut average

Connecticut average: 21.1

Long-stay resident measures
Need for Help with Daily Activities Increased Info Percent of long-stay residents whose need for help with daily activities has increased 20.1%
6% worse than Connecticut average

Connecticut average: 18.9%

Walking Ability Worsened Info Percent of long-stay residents whose ability to move independently worsened 17.2%
10% better than Connecticut average

Connecticut average: 19.2%

Low Risk Residents with Bowel/Bladder Incontinence Info Percent of low risk long-stay residents who lose control of their bowels or bladder 28.6%
15% worse than Connecticut average

Connecticut average: 24.9%

Falls with Major Injury Info Percent of long-stay residents experiencing one or more falls with major injury 4.1%
17% worse than Connecticut average

Connecticut average: 3.5%

High Risk Residents with Pressure Ulcers Info Percent of long-stay high risk residents with pressure ulcers 5.1%
10% worse than Connecticut average

Connecticut average: 4.6%

Urinary Tract Infection Info Percent of long-stay residents with a urinary tract infection 3.1%
81% worse than Connecticut average

Connecticut average: 1.7%

Lost Too Much Weight Info Percent of long-stay residents who lose too much weight 5.3%
15% better than Connecticut average

Connecticut average: 6.3%

Depressive Symptoms Info Percent of long-stay residents who have depressive symptoms 9.0%
40% better than Connecticut average

Connecticut average: 15.2%

Antipsychotic Use Info Percent of long-stay residents who received an antipsychotic medication 21.1%
23% worse than Connecticut average

Connecticut average: 17.2%

Pneumococcal Vaccine Info Percent of long-stay residents assessed and appropriately given the pneumococcal vaccine 71.4%
18% worse than Connecticut average

Connecticut average: 87.5%

Influenza Vaccine Info Percent of long-stay residents assessed and appropriately given the seasonal influenza vaccine 87.9%
6% worse than Connecticut average

Connecticut average: 93.5%

Short-stay resident measures
Pneumococcal Vaccine Info Percent of short-stay residents assessed and appropriately given the pneumococcal vaccine 30.2%
57% worse than Connecticut average

Connecticut average: 70.1%

Antipsychotic medication increase Info Percent of short-stay residents who newly received an antipsychotic medication 2.0%
34% worse than Connecticut average

Connecticut average: 1.5%

Influenza Vaccine Info Percent of short-stay residents assessed and appropriately given the seasonal influenza vaccine 33.5%
52% worse than Connecticut average

Connecticut average: 69.8%

Breakdown by payment type

Medicare

40% of new residents, usually for short-term rehab.

Typical stay 13 days

Private pay

56% of new residents, often for short stays.

Typical stay 10 days

Medicaid

4% of new residents, often for long-term daily care.

Typical stay 1 - 2 years

Facility Characteristics

Source: CMS Long-Term Care Facility Characteristics (Data as of Jan 2026)

Total residents 129
Medicare
25
19.4% of residents
Medicaid
67
51.9% of residents
Private pay or other
37
28.7% of residents
Programs & Services
Residents Group

Residents meet regularly to discuss policies, care quality, and activities

Family Member Group

Family members meet regularly to discuss policies, care quality, and activities

Active Family Council

Organized group of family members that meets regularly to discuss facility policies, resident care, and activities.

Active Resident Council

Organized group of residents that meets regularly to discuss facility policies, quality of life, and activities.

Finances and operations

Based on CMS SNF Cost Report for fiscal year ending in 09/2023.

For-profit
Operated by a business corporation.
Net patient revenue Info Net patient revenue — what the home actually collects for resident care, after contractual allowances, bad debt and discounts are subtracted from its gross charges (CMS cost report, Worksheet G-3). It covers resident care only; money the home earns from other sources is shown separately as "Other income."
$16.0M
Net patient income Info Net patient income: net patient revenue minus the home's total operating expenses. A positive figure means it earns more from resident care than it spends to deliver it; a negative figure means the opposite. It excludes non-operating "other income."
-$534.3K
For-profit Operated by a business corporation.
Net patient revenue Info Net patient revenue — what the home actually collects for resident care, after contractual allowances, bad debt and discounts are subtracted from its gross charges (CMS cost report, Worksheet G-3). It covers resident care only; money the home earns from other sources is shown separately as "Other income."
$16.0M Rank #28 / 73Revenue — State benchmarkedThis home is ranked 28th out of 73 homes in Connecticut. Shows this facility's annual revenue compared to the Connecticut average. Higher revenue generally means more resources for staffing and capital — read alongside Payroll %.Rankings are based only on facilities in Connecticut that report data for that category. Facilities without available data are excluded from the ranking.Click the rank badge to see the full State ranking.Click here to see the full State ranking.
Net patient income Info Net patient income: net patient revenue minus the home's total operating expenses. A positive figure means it earns more from resident care than it spends to deliver it; a negative figure means the opposite. It excludes non-operating "other income."
-$534.3K
Other income Info Money the home earns outside of resident care — such as investments, grants, rentals and other non-operating sources (CMS cost report, Worksheet G-3). It is tracked separately from net patient revenue: it is not part of that figure, and it is not included in net patient income.
$185.2K
Payroll costs Info Staff salaries plus wage-related costs — benefits such as payroll taxes, health insurance and retirement — from the home's own accounting records (CMS cost report, Worksheet A). Contract or agency labor is counted separately, under other operating costs. Rank #27 / 73Payroll — State benchmarkedThis home is ranked 27th out of 73 homes in Connecticut. Shows total annual staff payroll benchmarked to the Connecticut average. Higher payroll investment relative to peers often signals better staffing and less reliance on cheaper contract labor.Rankings are based only on facilities in Connecticut that report data for that category. Facilities without available data are excluded from the ranking.Click the rank badge to see the full State ranking.Click here to see the full State ranking.
$10.3M 64.3% of net patient revenue Info Payroll as a share of revenue: staff salaries and wage-related benefits divided by net patient revenue. A higher figure means more of each revenue dollar goes to staff pay. Rank #48 / 73Payroll % — State benchmarkedThis home is ranked 48th out of 73 homes in Connecticut. Shows payroll as a percentage of revenue versus the Connecticut average. Well-run Connecticut facilities typically land around 51–66% — the top third Statewide. Below 25% may signal understaffing or heavy agency use — read with Staffing ratings.Rankings are based only on facilities in Connecticut that report data for that category. Facilities without available data are excluded from the ranking.Click the rank badge to see the full State ranking.Click here to see the full State ranking.
Other operating costs Info Everything it costs to run the home apart from payroll — food, utilities, supplies, maintenance, contract labor and administration. Calculated as total operating expense minus payroll (staff salaries and wage-related benefits).
$6.2M
Total costs Info The home's total operating expense for the year — all the costs of running it, salaries included (CMS cost report, Worksheet G-3).
$16.5M

What does this home offer?

Pets allowed icon
Pets allowed icon

Pets Allowed

Housing options icon

Housing Options: Suite

Building type icon
Building type icon

Building Type: Two-story

Transportation services icon

Transportation Services

Fitness and recreation icon

Fitness and Recreation

Who this home usually serves

TYPE OF STAY

Mix of rehab and long-term care

This home supports both short-term rehab and long-term care, with residents staying for a wide range of durations.

Most new residents arrive under private pay (56% of admissions), and a typical private pay stay runs around 10 days.

Admissions
1,290 total

Coverage residents most often arrive under.

Medicare 40%
Private pay 56%
Medicaid 4%
Discharges
1,077 total

Coverage residents most often leave under.

Medicare 24%
Private pay 71%
Medicaid 5%

Places of interest near The Greens at Cannondale

Address 1.6 miles from city center Info Estimated distance in miles from Wilton's city center to The Greens at Cannondale's address, calculated via Google Maps.

Calculate Travel Distance to The Greens at Cannondale

Add your location

Address

Compare Nursing Homes around Danbury

The information below is reported by the Connecticut Department of Public Health, Facility Licensing and Investigations Section.

5 facilities compared · CMS & CT Dept. of Health data

Hancock Hall
NH
NC
RC
Danbury
96
Facility 96
CT AVG 111
Rank #67 / 123
95.8%
Facility 95.8%
CT AVG 84%
Rank #8 / 72
+14%
3.59
Facility 3.59
CT AVG 3.97
Rank #44 / 67
+1%-10%
$0
Facility $0
CT AVG $43.8k
Rank #1 / 69
12
Facility 12
CT AVG 32.0
Rank #4 / 69
3.0
Facility 3.0
CT AVG 5.8
Rank #3 / 69
-87-
20
Facility 20
CT AVG 47
Rank #211 / 264
-
$16.1M
Facility $16.1M
CT AVG $19.0M
Rank #48 / 73
$7.1M
Facility $7.1M
CT AVG $7.2M
Rank #53 / 73
44%
Facility 44%
CT AVG 42.4%
Rank #29 / 73
75414
Filosa Nursing Home and Rehabilitation Center
NH
AL
Danbury (Beckettville)
64
Facility 64
CT AVG 111
Rank #92 / 123
93.5%
Facility 93.5%
CT AVG 84%
Rank #22 / 72
+11%
3.24
Facility 3.24
CT AVG 3.97
Rank #60 / 67
+1%-18%
$0
Facility $0
CT AVG $43.8k
Rank #1 / 69
16
Facility 16
CT AVG 32.0
Rank #16 / 69
5.3
Facility 5.3
CT AVG 5.8
Rank #38 / 69
-57A+
50
Facility 50
CT AVG 47
Rank #117 / 264
Danbury Opco LLC
$10.7M
Facility $10.7M
CT AVG $19.0M
Rank #67 / 73
$5.0M
Facility $5.0M
CT AVG $7.2M
Rank #69 / 73
46.4%
Facility 46.4%
CT AVG 42.4%
Rank #24 / 73
75074
Bethel Health Care Center
NH
HC
PC
RC
Bethel (Stony Hill)
161
Facility 161
CT AVG 111
Rank #20 / 123
95.0%
Facility 95.0%
CT AVG 84%
Rank #10 / 72
+13%
3.68
Facility 3.68
CT AVG 3.97
Rank #36 / 67
-40%-7%
$16.0k
Facility $16.0k
CT AVG $43.8k
Rank #49 / 69
31
Facility 31
CT AVG 32.0
Rank #42 / 69
6.2
Facility 6.2
CT AVG 5.8
Rank #46 / 69
2153-
8
Facility 8
CT AVG 47
Rank #249 / 264
Bethel Investors, LLC
$26.3M
Facility $26.3M
CT AVG $19.0M
Rank #12 / 73
$15.0M
Facility $15.0M
CT AVG $7.2M
Rank #9 / 73
57.3%
Facility 57.3%
CT AVG 42.4%
Rank #23 / 73
75400
The Greens at Cannondale
NH
AL
MC
RC
Wilton (Cannondale)
148
Facility 148
CT AVG 111
Rank #27 / 123
92.6%
Facility 92.6%
CT AVG 84%
Rank #26 / 72
+10%
3.97
Facility 3.97
CT AVG 3.97
Rank #23 / 67
-39%0%
$16.5k
Facility $16.5k
CT AVG $43.8k
Rank #50 / 69
35
Facility 35
CT AVG 32.0
Rank #48 / 69
5.0
Facility 5.0
CT AVG 5.8
Rank #28 / 69
3123-
17
Facility 17
CT AVG 47
Rank #221 / 264
Fred Rzepka
$16.0M
Facility $16.0M
CT AVG $19.0M
Rank #28 / 73
$10.3M
Facility $10.3M
CT AVG $7.2M
Rank #27 / 73
64.3%
Facility 64.3%
CT AVG 42.4%
Rank #48 / 73
75317
Civita Care Center at Danbury
NH
HC
PC
RC
Danbury
180
Facility 180
CT AVG 111
Rank #16 / 123
61.7%
Facility 61.7%
CT AVG 84%
Rank #68 / 72
-27%
6.24
Facility 6.24
CT AVG 3.97
Rank #1 / 67
+73%+57%
$9.1k
Facility $9.1k
CT AVG $43.8k
Rank #43 / 69
47
Facility 47
CT AVG 32.0
Rank #60 / 69
7.8
Facility 7.8
CT AVG 5.8
Rank #62 / 69
1111-
74
Facility 74
CT AVG 47
Rank #50 / 264
-
$10.6M
Facility $10.6M
CT AVG $19.0M
Rank #69 / 73
$6.0M
Facility $6.0M
CT AVG $7.2M
Rank #56 / 73
56.4%
Facility 56.4%
CT AVG 42.4%
Rank #5 / 73
75274

Financial Assistance for
Nursing Home in Connecticut

The Greens at Cannondale is located in Wilton, Connecticut.
Here are the financial assistance programs available to residents in Connecticut.

Get Financial aid guidance

Connecticut Home Care Program for Elders

CHCPE

Age 65+
General Connecticut resident, at risk of nursing home placement.
Income Limits State-funded: ~$1,600/month; Medicaid: ~$2,829/month 300% FBR
Asset Limits $1,600 (state), $2,000 (Medicaid, individual).
CT

Two tiers (state and Medicaid); waitlists possible.

Benefits
In-home care (4-6 hours/day) Adult day care (~$70/day) Meals Respite (up to 14 days/year)

Statewide Respite Care Program

CT Respite Care

Age
General Caregiver of senior with dementia, Connecticut resident.
Income Limits ~$2,500/month individual, varies
Asset Limits $40,000 individual
CT

Limited to dementia caregivers; capped funding.

Benefits
In-home respite (up to 30 days/year) Adult day care (~$70/day)

Congregate Housing Services Program (CHSP)

Connecticut Congregate Housing Services Program

Age 62+
General Connecticut resident, frail but not needing 24/7 care, resides in CHSP-eligible housing.
Income Limits (2025) ~$41,000/year individual, adjusted annually
Asset Limits Not specified; focus is income-based.
CT

Limited to 14 state-subsidized sites; participants pay 10% of service costs.

Benefits
Personal care (3-5 hours/day) Meals ($5-$7/meal) Housekeeping Transportation (~5 trips/month)

Medicare Savings Program (MSP)

Connecticut Medicare Savings Program

Age 65+ or disabled
General Connecticut resident, enrolled in Medicare Part A/B.
Income Limits (2025) ~$2,510/month (individual, QMB); ~$3,380/month (SLMB); ~$3,598/month (ALMB)—adjusted annually.
Asset Limits None since 2023 policy change.
CT

Three tiers (Qualified Medicare Beneficiary, Specified Low-Income, Additional Low-Income); no asset test.

Benefits
Covers Medicare Part B premiums ($174.70/month) Deductibles ($240/year) Copays (~20% of services)

Frequently Asked Questions about The Greens at Cannondale

What neighborhood is The Greens at Cannondale in?

The Greens at Cannondale is in the Cannondale neighborhood of Wilton.

Is The Greens at Cannondale in a walkable area?

The Greens at Cannondale has a walk score of 17. Car-dependent. Most errands require a car, with limited nearby walkable options.

What is the license number of The Greens at Cannondale?

According to CT state health department records, The Greens at Cannondale's license number is AL0025.

When does The Greens at Cannondale's license expire?

According to CT state health department records, The Greens at Cannondale's license expires on March 31, 2026.

What is the occupancy rate at The Greens at Cannondale?

The Greens at Cannondale's occupancy is 74.9%.

Does The Greens at Cannondale operate as a for-profit or non-profit?

The Greens at Cannondale is registered as a for-profit in CT.

Are there photos of The Greens at Cannondale?

Yes — there are 5 photos of The Greens at Cannondale in the photo gallery on this page.

Guides for Better Senior Living

Care Cost Calculator: See Prices in Your Area

Nursing Home Data Explorer

Don’t Wait Too Long: 7 Red Flag Signs Your Parent Needs Assisted Living Now

The True Cost of Assisted Living in 2025 – And How Families Are Paying For It

Understanding Senior Living Costs: Pricing Models, Discounts & Financial Assistance