


Total staff
238
Employees
210
Contractors
28
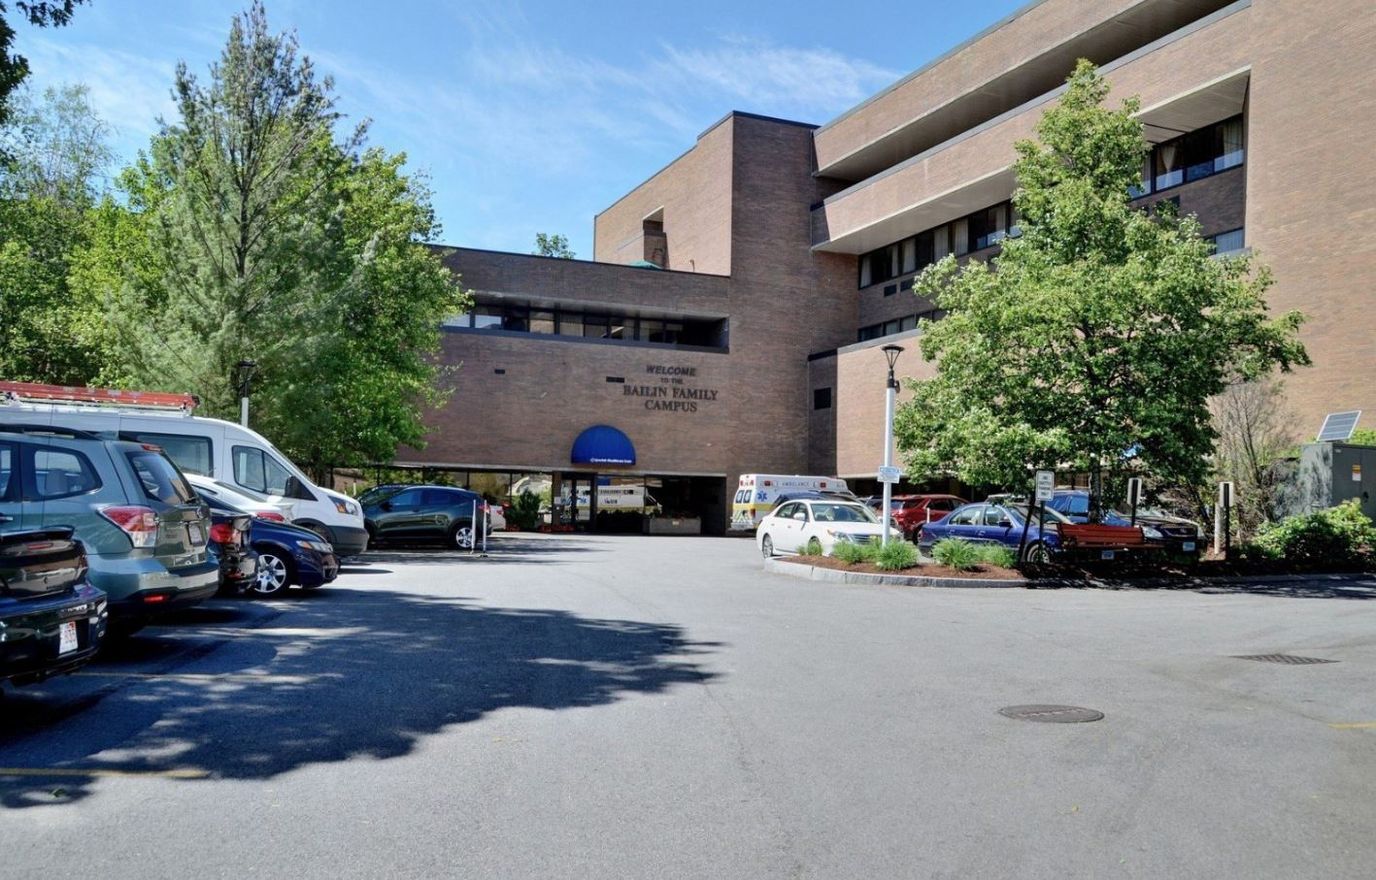
The Jewish Healthcare Center is at 629 Salisbury St in Worcester, Massachusetts; it’s a car-dependent neighborhood with a Walk Score of 12. The building holds 141 beds, and the profile lists nursing home, assisted living, home care, hospice care, and nursing care as part of what the facility offers. That is an unusually wide range of designations for a single address, which is worth verifying if the specific service type matters for a particular family’s situation.
The numbers that tell you the most about daily life here are the staffing and the length-of-stay figures. Total nursing care runs 4 hours and 28 minutes per resident per day, with registered nurses delivering about 26 minutes of that and nurse aides accounting for 2 hours and 39 minutes. The average stay is 72 days, just over two months. That is a short-stay profile, consistent with a facility organized around post-acute recovery and rehabilitation rather than long-term placement.
Occupancy sits at 91.8% in a 141-bed building, which means availability tends to be limited. Families planning a placement here should factor that into timing. Payment pathways include Medicare, Medicaid, and private pay, which lines up with the short-stay model where Medicare is often the primary payer on admission.
For adults stepping down from a hospital stay and needing structured nursing and rehabilitation support in Worcester, The Jewish Healthcare Center is a high-occupancy, multi-service facility built around that kind of transition.
| Staff type | Hours / Day / Resident | vs state avg |
|---|---|---|
|
Registered Nurse (RN)
| 26m per day | ▼ 34% State avg: 39m per day · National avg: 41m per day |
|
LPN / LVN
| 1h 23m per day | ▲ 44% State avg: 58m per day · National avg: 52m per day |
|
Nurse Aide
| 2h 39m per day | ▲ 17% State avg: 2h 16m per day · National avg: 2h 21m per day |
|
Weekend Total Nursing
| 3h 54m per day | ▲ 13% State avg: 3h 27m per day · National avg: 3h 26m per day |
|
Physical Therapist
| 4m per day | ▼ 4% State avg: 4m per day · National avg: 4m per day |
|
Weekend RN
| 14m per day | ▼ 51% State avg: 28m per day · National avg: 29m per day |
Reporting period: October 1 – December 31, 2025 (Q4 2025). Source: CMS Payroll-Based Journal report.
Manages medical care and health needs.
Assists with medical care and medications.
Helps with daily care and mobility.
Total hours from contractors
831 contractor hours this quarter
| Certified Nursing Assistant | 102 | 0 | 102 | 32,245 | 92 | 100% | 7.8 |
| Licensed Practical Nurse | 38 | 16 | 54 | 12,596 | 92 | 100% | 8.2 |
| RN Director of Nursing | 10 | 0 | 10 | 4,265 | 88 | 96% | 8.7 |
| Other Dietary Services Staff | 15 | 0 | 15 | 3,238 | 86 | 93% | 6.6 |
| Registered Nurse | 11 | 10 | 21 | 3,054 | 92 | 100% | 7.8 |
| Speech Language Pathologist | 6 | 0 | 6 | 1,464 | 81 | 88% | 7.1 |
| Dietitian | 3 | 0 | 3 | 1,448 | 67 | 73% | 8 |
| Physical Therapy Assistant | 6 | 0 | 6 | 1,415 | 87 | 95% | 8.2 |
| Clinical Nurse Specialist | 4 | 0 | 4 | 1,289 | 64 | 70% | 7.9 |
| Physical Therapy Aide | 4 | 0 | 4 | 1,216 | 71 | 77% | 7.4 |
| Nurse Practitioner | 2 | 0 | 2 | 896 | 64 | 70% | 8 |
| Respiratory Therapy Technician | 2 | 0 | 2 | 775 | 70 | 76% | 8.7 |
| Mental Health Service Worker | 2 | 0 | 2 | 748 | 59 | 64% | 8.6 |
| Occupational Therapy Aide | 2 | 0 | 2 | 715 | 60 | 65% | 7.8 |
| Administrator | 1 | 0 | 1 | 512 | 64 | 70% | 8 |
| Qualified Social Worker | 2 | 0 | 2 | 446 | 59 | 64% | 6.5 |
| Medical Director | 0 | 1 | 1 | 80 | 26 | 28% | 3.1 |
| Occupational Therapy Assistant | 0 | 1 | 1 | 51 | 10 | 11% | 5.1 |
Federal penalties imposed by CMS for regulatory violations, including civil money penalties (fines) and denials of payment for new Medicare/Medicaid admissions.
Source: CMS Penalties Database (Data as of Jan 2026)
Massachusetts average: $72K
Massachusetts average: 1.7
Massachusetts average: 0.1
No penalties in the past 3 years
No civil money penalties or payment denials were reported in the last 3 years.
These measures show how residents usually do over time at this home, based on health outcomes and preventive care.
Massachusetts average: 10.2
Massachusetts average: 20.0
Massachusetts average: 18.7%
Massachusetts average: 19.3%
Massachusetts average: 22.1%
Massachusetts average: 3.6%
Massachusetts average: 4.7%
Massachusetts average: 2.1%
Massachusetts average: 5.2%
Massachusetts average: 10.7%
Massachusetts average: 20.3%
Massachusetts average: 91.9%
Massachusetts average: 94.8%
Massachusetts average: 1.86
Massachusetts average: 1.54
Massachusetts average: 76.7%
Massachusetts average: 1.3%
Massachusetts average: 77.7%
Massachusetts average: 25.8%
Massachusetts average: 11.8%
Massachusetts average: 0.8%
Massachusetts average: 53.7%
Massachusetts average: 50.6%
Quality measures are calculated from Minimum Data Set (MDS) assessments. For most measures, lower percentages indicate better care quality.
35% of new residents, usually for short-term rehab.
63% of new residents, often for short stays.
2% of new residents, often for long-term daily care.
Source: CMS Long-Term Care Facility Characteristics (Data as of Jan 2026)
Residents meet regularly to discuss policies, care quality, and activities
Organized group of residents that meets regularly to discuss facility policies, quality of life, and activities.
Data sourced from CMS Long-Term Care Facility Characteristics quarterly report. Payer mix reflects the current resident census by primary payment source.
Historical financial and operational data for The Jewish Healthcare Center from 2011–2023, based on CMS SNF Cost Reports.
Key figures below are for fiscal year ending in 12/2023.
Based on CMS SNF Cost Report for fiscal year ending in 12/2023.
Residents typically stay for brief periods, with frequent admissions and discharges throughout the year.
Most new residents arrive under private pay (63% of admissions), and a typical private pay stay runs around 1 - 2 months.
Coverage residents most often arrive under.
Coverage residents most often leave under.
![]() 3.5 miles from city center
3.5 miles from city center
![]() Estimated distance in miles from Worcester's city center to The Jewish Healthcare Center's address, calculated via Google Maps.
Estimated distance in miles from Worcester's city center to The Jewish Healthcare Center's address, calculated via Google Maps.
Add your location
Info below is compiled from CMS reports & the MA Executive Office of Elder Affairs, senior community websites & trusted data sources such as Walk Score & BBB.
Communities are listed from highest to lowest based on our ranking methodology.
| The Lillie Mansion at Lutheran | NH AL MC PC RESC RC SNF | Worcester (Central Business District) | 150
Facility
150
MA AVG
94
Rank
#29 / 276 |
68.0%
Facility
68.0%
MA AVG
78.3
Rank
#64 / 81 | -13% | 4.28
Facility
4.28
MA AVG
3.93
Rank
#18 / 86 | -19% | +9% | $0
Facility
$0
MA AVG
$76.6k
Rank
#1 / 87 | 11
Facility
11
MA AVG
32.7
Rank
#9 / 86 | 5.5
Facility
5.5
MA AVG
7.2
Rank
#36 / 86 | 1 | 102 | - |
88
Facility
88
MA AVG
53
Rank
#63 / 498 | Frederic Jenoure | $16.4MFiscal year ending 06/2024
Facility
$16.4MFiscal year ending 06/2024
MA AVG
$17.4M
Rank
#29 / 89 | $10.2MFiscal year ending 06/2024
Facility
$10.2MFiscal year ending 06/2024
MA AVG
$6.5M
Rank
#44 / 89 | 62.1%Fiscal year ending 06/2024
Facility
62.1%Fiscal year ending 06/2024
MA AVG
43.6%
Rank
#65 / 89 | 225379 | ||||
| Holy Trinity Nursing and Rehabilitation Center | NH RC SNF | Worcester (Indian Lake East) | 113
Facility
113
MA AVG
94
Rank
#74 / 276 |
89.8%
Facility
89.8%
MA AVG
78.3
Rank
#28 / 81 | +15% | 3.97
Facility
3.97
MA AVG
3.93
Rank
#34 / 86 | -44% | +1% | $0
Facility
$0
MA AVG
$76.6k
Rank
#1 / 87 | 10
Facility
10
MA AVG
32.7
Rank
#8 / 86 | 3.3
Facility
3.3
MA AVG
7.2
Rank
#9 / 86 | 2 | 102 | - |
59
Facility
59
MA AVG
53
Rank
#220 / 498 | Nicholas Apostola | $12.8MFiscal year ending 12/2023
Facility
$12.8MFiscal year ending 12/2023
MA AVG
$17.4M
Rank
#54 / 89 | $9.6MFiscal year ending 12/2023
Facility
$9.6MFiscal year ending 12/2023
MA AVG
$6.5M
Rank
#46 / 89 | 75%Fiscal year ending 12/2023
Facility
75%Fiscal year ending 12/2023
MA AVG
43.6%
Rank
#26 / 89 | 225648 | ||||
| The Jewish Healthcare Center | NH AL HC HOS SNF | Worcester (West Tatnuck) | 141
Facility
141
MA AVG
94
Rank
#37 / 276 |
93.5%
Facility
93.5%
MA AVG
78.3
Rank
#15 / 81 | +19% | 4.47
Facility
4.47
MA AVG
3.93
Rank
#13 / 86 | -31% | +14% | $10.5k
Facility
$10.5k
MA AVG
$76.6k
Rank
#57 / 87 | 23
Facility
23
MA AVG
32.7
Rank
#34 / 86 | 4.6
Facility
4.6
MA AVG
7.2
Rank
#24 / 86 | 3 | 132 | - |
12
Facility
12
MA AVG
53
Rank
#455 / 498 | Jay Aframe | $19.0MFiscal year ending 12/2023
Facility
$19.0MFiscal year ending 12/2023
MA AVG
$17.4M
Rank
#30 / 89 | $17.3MFiscal year ending 12/2023
Facility
$17.3MFiscal year ending 12/2023
MA AVG
$6.5M
Rank
#7 / 89 | 91.1%Fiscal year ending 12/2023
Facility
91.1%Fiscal year ending 12/2023
MA AVG
43.6%
Rank
#7 / 89 | 225173 | ||||
| Notre Dame du Lac | NH AL HOS MC PC RC SNF | Worcester (Booth Apartments Area) | 110
Facility
110
MA AVG
94
Rank
#80 / 276 | - | - | 4.14
Facility
4.14
MA AVG
3.93
Rank
#27 / 86 | -5% | +5% | $0
Facility
$0
MA AVG
$76.6k
Rank
#1 / 87 | 16
Facility
16
MA AVG
32.7
Rank
#21 / 86 | 4.0
Facility
4.0
MA AVG
7.2
Rank
#16 / 86 | - | 118 | - |
13
Facility
13
MA AVG
53
Rank
#449 / 498 | Ellen Agritelley | $16.3MFiscal year ending 12/2023
Facility
$16.3MFiscal year ending 12/2023
MA AVG
$17.4M
Rank
#45 / 89 | $12.7MFiscal year ending 12/2023
Facility
$12.7MFiscal year ending 12/2023
MA AVG
$6.5M
Rank
#22 / 89 | 77.8%Fiscal year ending 12/2023
Facility
77.8%Fiscal year ending 12/2023
MA AVG
43.6%
Rank
#16 / 89 | 225577 | ||||
| Parsons Hill Rehabilitation and Health Care Center | NH HOS RC SNF | Worcester (Webster Square) | 162
Facility
162
MA AVG
94
Rank
#21 / 276 |
91.4%
Facility
91.4%
MA AVG
78.3
Rank
#25 / 81 | +17% | 3.50
Facility
3.50
MA AVG
3.93
Rank
#65 / 86 | -75% | -11% | $0
Facility
$0
MA AVG
$76.6k
Rank
#1 / 87 | 50
Facility
50
MA AVG
32.7
Rank
#75 / 86 | 6.3
Facility
6.3
MA AVG
7.2
Rank
#45 / 86 | - | 148 | - |
76
Facility
76
MA AVG
53
Rank
#146 / 498 | - | $18.5MFiscal year ending 12/2023
Facility
$18.5MFiscal year ending 12/2023
MA AVG
$17.4M
Rank
#15 / 89 | $12.2MFiscal year ending 12/2023
Facility
$12.2MFiscal year ending 12/2023
MA AVG
$6.5M
Rank
#25 / 89 | 65.6%Fiscal year ending 12/2023
Facility
65.6%Fiscal year ending 12/2023
MA AVG
43.6%
Rank
#74 / 89 | 225390 |
The Jewish Healthcare Center is located in Worcester, Massachusetts.
Here are the financial assistance programs available to residents in Massachusetts.
The Jewish Healthcare Center is in the West Tatnuck neighborhood.
The Jewish Healthcare Center has a walk score of 12. Car-dependent. Most errands require a car, with limited nearby walkable options.
The Jewish Healthcare Center's occupancy is 91.8%.
No, The Jewish Healthcare Center has a no-pet policy.
The Jewish Healthcare Center is registered as a non-profit.
Yes — there are 4 photos of The Jewish Healthcare Center in the photo gallery on this page.
The Jewish Healthcare Center is located at 629 Salisbury St, Worcester, MA 01609.
Care Cost Calculator: See Prices in Your Area
Nursing Home Data Explorer
Don’t Wait Too Long: 7 Red Flag Signs Your Parent Needs Assisted Living Now
The True Cost of Assisted Living in 2025 – And How Families Are Paying For It
Understanding Senior Living Costs: Pricing Models, Discounts & Financial Assistance


