The Landon at Lake Highlands
Nursing Home, Independent Living & Respite Care · Dallas, TX
CMS overall rating Info CMS (the Centers for Medicare & Medicaid Services) is the federal agency that rates nursing home quality. Its Overall Rating runs from 1 to 5 stars, combining health inspections, staffing, and quality measures, with inspections weighted most heavily.

The Landon at Lake Highlands

Nursing Home, Independent Living & Respite Care · Dallas, TX
CMS overall rating Info CMS (the Centers for Medicare & Medicaid Services) is the federal agency that rates nursing home quality. Its Overall Rating runs from 1 to 5 stars, combining health inspections, staffing, and quality measures, with inspections weighted most heavily.
Calculator: See prices in your area
The Landon at Lake Highlands accepts Medicare, Medicaid, and private pay.

Overview of The Landon at Lake Highlands

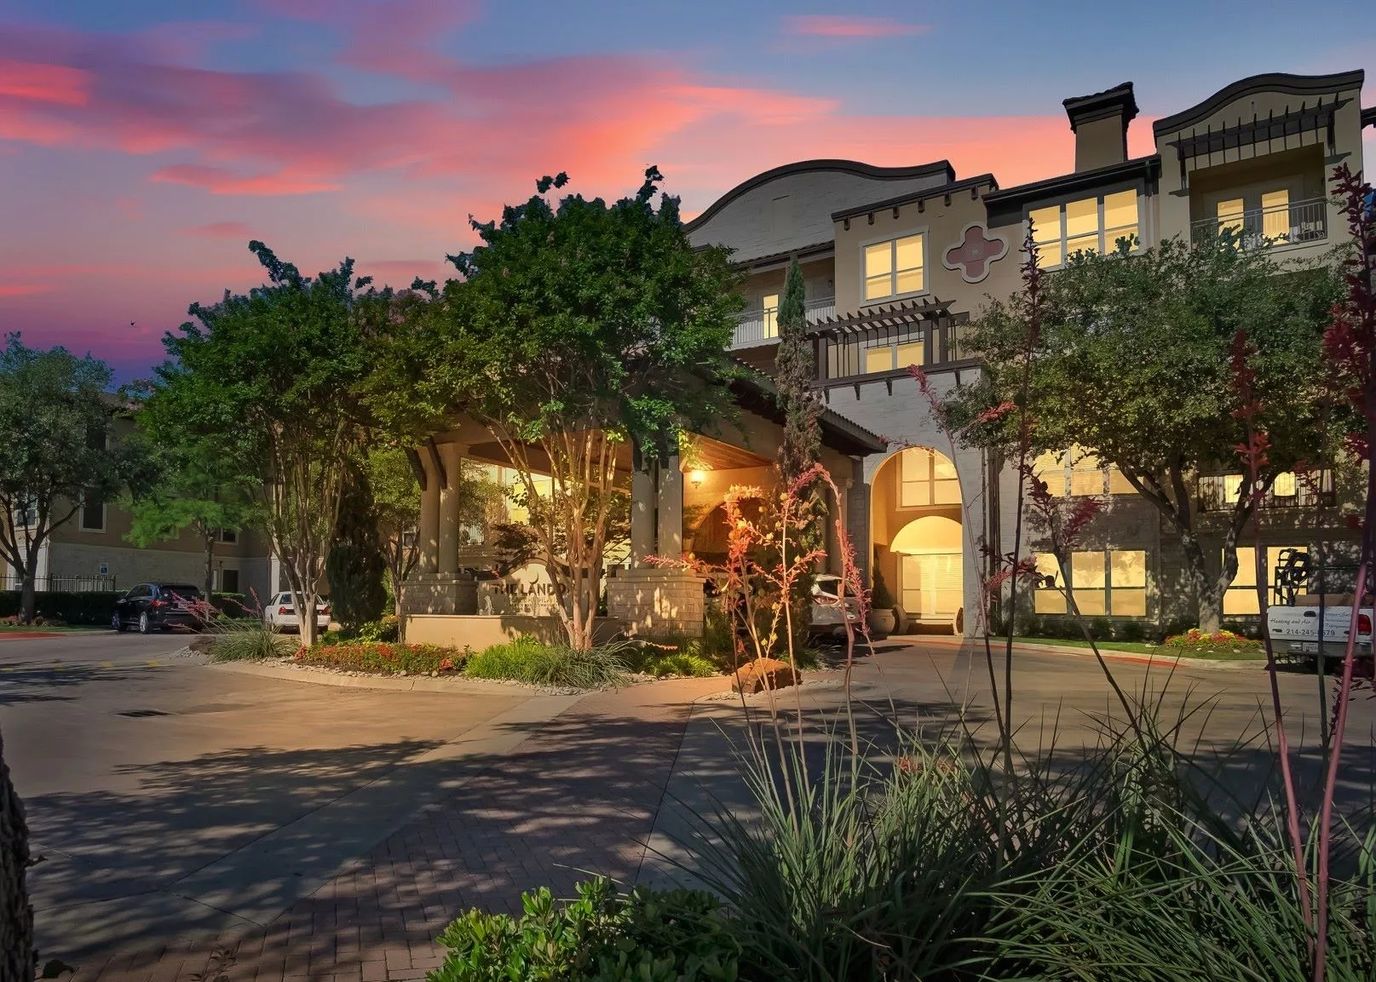
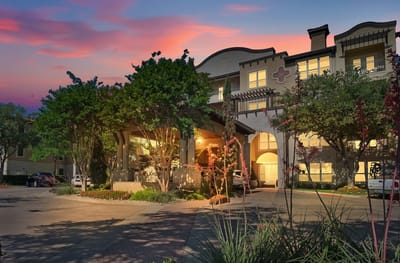
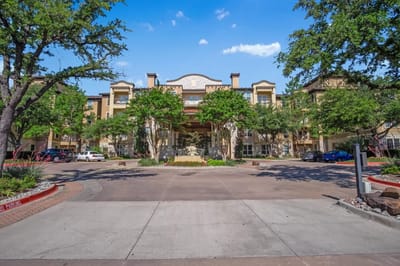
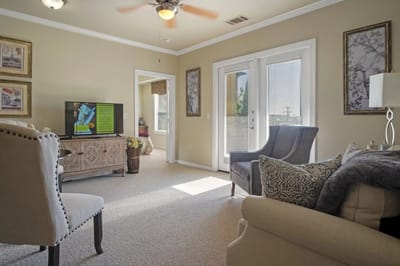
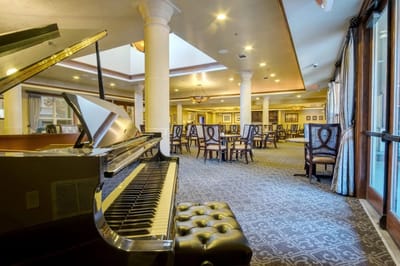
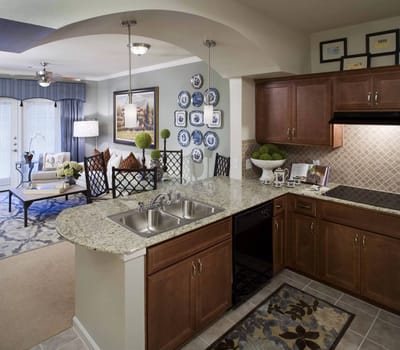
Ranked as one of the best independent living homes for seniors in Dallas, The Landon at Lake Highlands is an upscale community with amenities that promote fun and relaxation in an inviting environment. The vibrant community encourages seniors to build an active social life while not worrying about any chores to do. The Landon at Lake Highlands is outstanding in its service for combining passion and care in the comfort of a home.
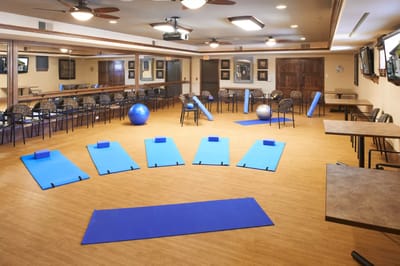
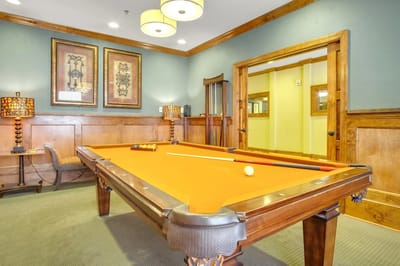
As a proud member of the Grace MGMT community, expect comprehensive luxury services offered to allow flexibility for families, including respite care, short-term stays, and specialized care. Community features include amenities and services such as housekeeping, laundry, social events, recreational activities, fitness classes, medication management, and transportation.

(214) 343-6400

Quality ratings

Measured by Centers for Medicare & Medicaid Services (CMS)

Overall rating Info The Overall CMS Rating combines results from health inspections, staffing levels and quality measures. Health inspections carry the most weight. Staffing and quality scores can increase or decrease the final rating based on performance compared to state and national standards.
▼ 28.4% Below TX avg. ▼ 28.4% Below TX avg.TX average: 2.8Click the badge to see the full State ranking.Click here to see the full State ranking.
Health Inspection Info Based on the results of the facility's three most recent standard inspections and any complaint investigations. CMS reviews the number, scope, and severity of deficiencies, with more recent findings weighted more heavily.
▼ 63.8% Below TX avg. ▼ 63.8% Below TX avg.TX average: 2.8Click the badge to see the full State ranking.Click here to see the full State ranking.
Staffing Info Measures average nursing staff hours per resident per day, including Registered Nurses (RNs) and total nursing staff. Ratings are adjusted based on the level of care residents require and are compared to state and national benchmarks.
▲ 41.4% Above TX avg. ▲ 41.4% Above TX avg.TX average: 2.1Click the badge to see the full State ranking.Click here to see the full State ranking.
Quality Measures Info Based on clinical and physical health indicators reported to CMS, such as hospital readmissions, falls, pressure ulcers, and improvements in mobility. These measures reflect how well residents' health needs are being managed.
▲ 33.2% Above TX avg. ▲ 33.2% Above TX avg.TX average: 3.8Click the badge to see the full State ranking.Click here to see the full State ranking.

Staffing hours breakdown

Info Daily nursing hours per resident by staff type, reported to CMS. Higher is generally better — compare this facility to state and national averages to see where staffing stands.

Hours per resident per day — compared to Texas state averages

Total nursing care / resident Info This home is ranked 56th out of 296 homes in Texas for nurse hours. Total adjusted nursing hours per resident per day, combining RN, LPN, and aide time. CMS adjusts this for case-mix so facilities can be fairly compared.
4h 18m per day
Rank #56 / 296Nurse hours — State benchmarkedThis home is ranked 56th out of 296 homes in Texas. Shows adjusted nurse hours per resident per day benchmarked to the Texas average, with a ranking across 296 Texas facilities. More hours mean more direct care. The national average is about 3.5 hrs; below 3.0 is a red flag.Ranking totals vary by category as each rank only includes facilities that report data for that metric. Homes missing that data point aren't included in the ranking.Click the rank badge to see the full State ranking.Click here to see the full State ranking.
This facility Texas avg (3h 38m per day)
vs Texas avg
+18%

1 of 6 metrics below state avg

Standout metric Physical Therapist is +100% above state avg
Staff typeHours / Day / Residentvs state avg
Registered Nurse (RN) Info RNs hold the highest nursing license and can assess residents, interpret test results, and direct care plans. More RN hours per day often signals stronger clinical oversight and faster response to health changes. 23m per day ▼ 8% State avg: 25m per day · National avg: 41m per day
LPN / LVN Info Licensed Practical Nurses (LPNs) or Licensed Vocational Nurses (LVNs) deliver routine hands-on care — medication administration, wound dressing, and monitoring vital signs. They work under RN supervision and make up a large share of daily bedside care. 1h 46m per day ▲ 87% State avg: 57m per day · National avg: 52m per day
Nurse Aide Info Certified Nurse Aides (CNAs) provide the most direct day-to-day assistance: bathing, dressing, feeding, and mobility. Nurse aide hours are typically the largest staffing category and directly affect residents' quality of life. 2h 17m per day ▲ 13% State avg: 2h 1m per day · National avg: 2h 20m per day
Weekend Total Nursing Info Combined nursing hours (RN + LPN + Nurse Aide) per resident per day on weekends. Staffing often drops on weekends — this figure reveals whether the facility maintains adequate coverage outside of weekday hours. 4h 0m per day ▲ 33% State avg: 3h 0m per day · National avg: 3h 27m per day
Physical Therapist Info Hours per resident per day provided by licensed Physical Therapists (PTs) or PT Assistants. PT services help residents recover mobility after injury or illness and are especially important for post-acute (short-stay) rehabilitation. 8m per day ▲ 100% State avg: 4m per day · National avg: 4m per day
Weekend RN Info Registered nurse hours specifically on weekends. Facilities sometimes reduce RN presence on Saturdays and Sundays — a low weekend RN figure compared to weekday hours can indicate reduced clinical oversight when most administrative staff are absent. 20m per day ■ Avg State avg: 20m per day · National avg: 29m per day

Capacity and availability

This home usually has limited availability

Higher occupancy than the Texas average: 63.5%
Occupancy rate
89.6% Rank #20 / 304Occupancy rate — State benchmarkedThis home is ranked 20th out of 304 homes in Texas. Shows this facility's occupancy rate versus the Texas average, with its Statewide rank out of 304. Higher occupancy signals strong local demand and financial stability.Ranking totals vary by category as each rank only includes facilities that report data for that metric. Homes missing that data point aren't included in the ranking.Click the rank badge to see the full State ranking.Click here to see the full State ranking.
Avg. Length of Stay
46 days
Bed community size
126-bed community Rank #160 / 988Bed count — State benchmarkedThis home is ranked 160th out of 988 homes in Texas. Shows this facility's certified or reported bed count compared to other Texas facilities. Larger communities may offer more amenities, programs, and on-site services for residents and families.Ranking totals vary by category as each rank only includes facilities that report data for that metric. Homes missing that data point aren't included in the ranking.Click the rank badge to see the full State ranking.Click here to see the full State ranking.
A larger shared setting that may offer more common spaces and organized community services.
Walk Score
Walk Score: 73 / 100 Rank #95 / 1391Walk Score — State benchmarkedThis home is ranked 95th out of 1391 homes in Texas. Shows how walkable this facility's neighborhood is compared to the average Walk Score across Texas facilities. Higher scores benefit residents, families, and staff.Ranking totals vary by category as each rank only includes facilities that report data for that metric. Homes missing that data point aren't included in the ranking.Click the rank badge to see the full State ranking.Click here to see the full State ranking.
Very walkable. Most errands can be accomplished on foot, and many essentials are within a short walk.

About this community

Therapy & Rehabilitation

1 service
Respite Care

Amenities & Lifestyle

Fitness Center
Heated Pool
Grille & Bistro
Champagne Lounge
Rooftop Terrace
Art Studio
Library
Billiards Room
Theater
Specific ProgramsGraceful Respite Stays, Vibrant Living Program, Graceful Dining, Veterans Benefits

Contact The Landon at Lake Highlands

Staffing Data

Reporting period: October 1 – December 31, 2025 (Q4 2025). Source: CMS Payroll-Based Journal report.

Total staff 190
Employees 180
Contractors 10
Staff to resident ratio 1.51 : 1
0% compared with Texas average
Texas average ratio: 1.48 : 1 Texas average ratio: 1.48 : 1See full Texas ranking
Avg staff/day 80
Average shift 7.9 hours
0% compared with Texas average
Texas average: 8.1 hours Texas average shift: 8.1 hoursSee full Texas ranking
Total staff hours (quarter) 58,117

Nursing staff breakdown

Q4 2025 · Oct 1 – Dec 31 More info This data comes from the CMS Payroll-Based Journal report covering October 1 – December 31, 2025.
Registered Nurse

Manages medical care and health needs.

RN Staff Info All 10 RN Staff are full-time employees. No contractors work on this role. 10
Average shift length Info Average shift length. Calculated as total hours divided by days worked and average staff per day. 8.9 hours
Licensed Practical Nurse

Assists with medical care and medications.

LPN Staff Info 46 total: 39 full-time employees and 7 contractors. 46
Average shift length Info Average shift length. Calculated as total hours divided by days worked and average staff per day. 9.1 hours
Certified Nursing Assistant

Helps with daily care and mobility.

CNA Staff Info All 68 CNA Staff are full-time employees. No contractors work on this role. 68
Average shift length Info Average shift length. Calculated as total hours divided by days worked and average staff per day. 7.6 hours

Contractor staffing

Q4 2025 · Oct 1 – Dec 31 More info This data comes from the CMS Payroll-Based Journal report covering October 1 – December 31, 2025.

Total hours from contractors

0.6%

334 contractor hours this quarter

Licensed Practical Nurse: 7 Occupational Therapy Assistant: 1 Medical Director: 1 Occupational Therapy Aide: 1

Staff by category

Q4 2025 · Oct 1 – Dec 31 More info This data comes from the CMS Payroll-Based Journal report covering October 1 – December 31, 2025.
Certified Nursing Assistant6806823,01492100%7.6
Licensed Practical Nurse3974614,67892100%9.1
RN Director of Nursing9094,3188491%8.2
Registered Nurse100102,61792100%8.9
Speech Language Pathologist8081,9478997%6.3
Other Dietary Services Staff4041,9017278%7.7
Physical Therapy Aide6061,5468997%6.6
Medication Aide/Technician3031,5439199%9.4
Respiratory Therapy Technician9091,4368390%6.1
Physical Therapy Assistant110111,3638795%6.1
Clinical Nurse Specialist3031,0828896%9.5
Qualified Social Worker4047316773%7
Nurse Practitioner2024966267%8
Dietitian1014886166%8
Administrator1014645863%8
Mental Health Service Worker2022242830%8
Occupational Therapy Aide0111451314%11.2
Occupational Therapy Assistant011791112%7.2
Medical Director011482830%1.7
68 Certified Nursing Assistant
% of Days 100%
46 Licensed Practical Nurse
% of Days 100%
9 RN Director of Nursing
% of Days 91%
10 Registered Nurse
% of Days 100%
8 Speech Language Pathologist
% of Days 97%
4 Other Dietary Services Staff
% of Days 78%
6 Physical Therapy Aide
% of Days 97%
3 Medication Aide/Technician
% of Days 99%
9 Respiratory Therapy Technician
% of Days 90%
11 Physical Therapy Assistant
% of Days 95%
3 Clinical Nurse Specialist
% of Days 96%
4 Qualified Social Worker
% of Days 73%
2 Nurse Practitioner
% of Days 67%
1 Dietitian
% of Days 66%
1 Administrator
% of Days 63%
2 Mental Health Service Worker
% of Days 30%
1 Occupational Therapy Aide
% of Days 14%
1 Occupational Therapy Assistant
% of Days 12%
1 Medical Director
% of Days 30%

Penalties and fines

Includes penalties issued in 2024-2025

Federal penalties imposed by CMS for regulatory violations, including civil money penalties (fines) and denials of payment for new Medicare/Medicaid admissions.

Source: CMS Penalties Database (Data as of Jan 2026)

Total fines amount $35K Rank #172 / 301Federal fines — State benchmarkedThis home is ranked 172nd out of 301 homes in Texas. Shows this facility's cumulative CMS federal fine dollars versus the Texas average among facilities with fines, and where it ranks among 301 facilities in the pool. Lower total dollars mean a better rank.Ranking totals vary by category as each rank only includes facilities that report data for that metric. Homes missing that data point aren't included in the ranking.Click the rank badge to see the full State ranking.Click here to see the full State ranking.
56% lower than Texas average

Texas average: $80K

Number of fines 3
21% more fines than Texas average

Texas average: 2.5

Payment Denials Info Serious action where Medicare and/or Medicaid temporarily stops payments for new residents until issues are fixed. 0
100% fewer payment denials than Texas average

Texas average: 0.2

Fines amount comparison
This facility $35K
Texas average $80K
Penalty History

Penalties are imposed by CMS for violations of federal nursing home regulations.

3 penalties in the past 3 years

Multiple penalties were reported in the last 3 years.

Civil Money Penalty Info Fines imposed for noncompliance, which can be assessed per day or per instance of violation. Aug 28, 2025
$18K
Civil Money Penalty Info Fines imposed for noncompliance, which can be assessed per day or per instance of violation. Oct 24, 2024
$9K
Civil Money Penalty Info Fines imposed for noncompliance, which can be assessed per day or per instance of violation. Apr 18, 2024
$8K

Last updated: Jan 2026

Quality of care over time

These measures show how residents usually do over time at this home, based on health outcomes and preventive care.

High-risk clinical events score Info A composite score based on pressure ulcers, falls with injury, weight loss, walking ability decline, and activities of daily living decline. 12.0
39% worse than Texas average

Texas average: 8.6

Functional decline score Info A composite score based on activities of daily living decline, walking ability decline, and incontinence. 20.8
30% worse than Texas average

Texas average: 16.0

Long-stay resident measures
Need for Help with Daily Activities Increased Info Percent of long-stay residents whose need for help with daily activities has increased 15.9%
In line with Texas average

Texas average: 16.2%

Walking Ability Worsened Info Percent of long-stay residents whose ability to move independently worsened 28.6%
76% worse than Texas average

Texas average: 16.2%

Low Risk Residents with Bowel/Bladder Incontinence Info Percent of low risk long-stay residents who lose control of their bowels or bladder 17.9%
14% worse than Texas average

Texas average: 15.7%

Falls with Major Injury Info Percent of long-stay residents experiencing one or more falls with major injury 3.4%
In line with Texas average

Texas average: 3.2%

High Risk Residents with Pressure Ulcers Info Percent of long-stay high risk residents with pressure ulcers 6.2%
41% worse than Texas average

Texas average: 4.4%

Urinary Tract Infection Info Percent of long-stay residents with a urinary tract infection 0.0%
100% better than Texas average

Texas average: 0.8%

Lost Too Much Weight Info Percent of long-stay residents who lose too much weight 5.7%
65% worse than Texas average

Texas average: 3.5%

Depressive Symptoms Info Percent of long-stay residents who have depressive symptoms 6.0%
111% worse than Texas average

Texas average: 2.9%

Antipsychotic Use Info Percent of long-stay residents who received an antipsychotic medication 4.2%
47% better than Texas average

Texas average: 7.9%

Pneumococcal Vaccine Info Percent of long-stay residents assessed and appropriately given the pneumococcal vaccine 90.3%
7% worse than Texas average

Texas average: 97.3%

Influenza Vaccine Info Percent of long-stay residents assessed and appropriately given the seasonal influenza vaccine 98.6%
In line with Texas average

Texas average: 97.9%

Short-stay resident measures
Pneumococcal Vaccine Info Percent of short-stay residents assessed and appropriately given the pneumococcal vaccine 40.1%
56% worse than Texas average

Texas average: 90.4%

Antipsychotic medication increase Info Percent of short-stay residents who newly received an antipsychotic medication 0.5%
68% better than Texas average

Texas average: 1.4%

Influenza Vaccine Info Percent of short-stay residents assessed and appropriately given the seasonal influenza vaccine 45.4%
48% worse than Texas average

Texas average: 88.0%

Breakdown by payment type

Medicare

33% of new residents, usually for short-term rehab.

Typical stay 28 days

Private pay

65% of new residents, often for short stays.

Typical stay 1 - 2 months

Medicaid

1% of new residents, often for long-term daily care.

Typical stay 2 - 3 years

Facility Characteristics

Source: CMS Long-Term Care Facility Characteristics (Data as of Jan 2026)

Total residents 126
Medicare
103
81.7% of residents
Medicaid
23
18.3% of residents
Programs & Services
Residents Group

Residents meet regularly to discuss policies, care quality, and activities

Active Resident Council

Organized group of residents that meets regularly to discuss facility policies, quality of life, and activities.

Finances and operations

Based on CMS SNF Cost Report for fiscal year ending in 12/2023.

Voluntary non-profit community
Operated by a church.
Net patient revenue Info Net patient revenue — what the home actually collects for resident care, after contractual allowances, bad debt and discounts are subtracted from its gross charges (CMS cost report, Worksheet G-3). It covers resident care only; money the home earns from other sources is shown separately as "Other income."
$15.4M
Net patient income Info Net patient income: net patient revenue minus the home's total operating expenses. A positive figure means it earns more from resident care than it spends to deliver it; a negative figure means the opposite. It excludes non-operating "other income."
-$69.6K
Voluntary non-profit community Operated by a church.
Net patient revenue Info Net patient revenue — what the home actually collects for resident care, after contractual allowances, bad debt and discounts are subtracted from its gross charges (CMS cost report, Worksheet G-3). It covers resident care only; money the home earns from other sources is shown separately as "Other income."
$15.4M Rank #40 / 304Revenue — State benchmarkedThis home is ranked 40th out of 304 homes in Texas. Shows this facility's annual revenue compared to the Texas average. Higher revenue generally means more resources for staffing and capital — read alongside Payroll %.Ranking totals vary by category as each rank only includes facilities that report data for that metric. Homes missing that data point aren't included in the ranking.Click the rank badge to see the full State ranking.Click here to see the full State ranking.
Net patient income Info Net patient income: net patient revenue minus the home's total operating expenses. A positive figure means it earns more from resident care than it spends to deliver it; a negative figure means the opposite. It excludes non-operating "other income."
-$69.6K
Other income Info Money the home earns outside of resident care — such as investments, grants, rentals and other non-operating sources (CMS cost report, Worksheet G-3). It is tracked separately from net patient revenue: it is not part of that figure, and it is not included in net patient income.
$122.6K
Payroll costs Info Staff salaries plus wage-related costs — benefits such as payroll taxes, health insurance and retirement — from the home's own accounting records (CMS cost report, Worksheet A). Contract or agency labor is counted separately, under other operating costs. Rank #34 / 304Payroll — State benchmarkedThis home is ranked 34th out of 304 homes in Texas. Shows total annual staff payroll benchmarked to the Texas average. Higher payroll investment relative to peers often signals better staffing and less reliance on cheaper contract labor.Ranking totals vary by category as each rank only includes facilities that report data for that metric. Homes missing that data point aren't included in the ranking.Click the rank badge to see the full State ranking.Click here to see the full State ranking.
$9.3M 60.2% of net patient revenue Info Payroll as a share of revenue: staff salaries and wage-related benefits divided by net patient revenue. A higher figure means more of each revenue dollar goes to staff pay. Rank #149 / 304Payroll % — State benchmarkedThis home is ranked 149th out of 304 homes in Texas. Shows payroll as a percentage of revenue versus the Texas average. Well-run Texas facilities typically land around 51–63% — the top third Statewide. Below 25% may signal understaffing or heavy agency use — read with Staffing ratings.Ranking totals vary by category as each rank only includes facilities that report data for that metric. Homes missing that data point aren't included in the ranking.Click the rank badge to see the full State ranking.Click here to see the full State ranking.
Other operating costs Info Everything it costs to run the home apart from payroll — food, utilities, supplies, maintenance, contract labor and administration. Calculated as total operating expense minus payroll (staff salaries and wage-related benefits).
$6.2M
Total costs Info The home's total operating expense for the year — all the costs of running it, salaries included (CMS cost report, Worksheet G-3).
$15.5M

Who this home usually serves

TYPE OF STAY

Primarily short stays

Residents typically stay for brief periods, with frequent admissions and discharges throughout the year.

Most new residents arrive under private pay (65% of admissions), and a typical private pay stay runs around 1 - 2 months.

Admissions
905 total

Coverage residents most often arrive under.

Medicare 33%
Private pay 65%
Medicaid 1%
Discharges
898 total

Coverage residents most often leave under.

Medicare 32%
Private pay 67%
Medicaid 1%

Places of interest near The Landon at Lake Highlands

Address 8.1 miles from city center Info Estimated distance in miles from Dallas's city center to The Landon at Lake Highlands's address, calculated via Google Maps. — 3.54 miles to nearest hospital (Texas Health Presbyterian Hospital Dallas)

Calculate Travel Distance to The Landon at Lake Highlands

Add your location

Address

Compare Independent Living around Dallas

The Landon at Lake Highlands
IL
NH
RC
Dallas (The L Streets) -
126
Facility 126
TX AVG 80
Rank #160 / 988
-
73
Facility 73
TX AVG 41
Rank #95 / 1391
-
The Legacy Midtown Park
IL
AL
HC
MC
NH
Dallas (Vickery Meadow) -
98
Facility 98
TX AVG 80
Rank #376 / 988
-
45
Facility 45
TX AVG 41
Rank #628 / 1391
Studio / 1 Bed / 2 Bed
Christian Care Communities and Services – Mesquite
IL
AL
MC
NH
RC
Mesquite -
180
Facility 180
TX AVG 80
Rank #26 / 988
-
31
Facility 31
TX AVG 41
Rank #914 / 1391
Studio / 1 Bed / 2 Bed
Presbyterian Village North
IL
AL
MC
NH
RC
Dallas (Lake Highlands) -
88
Facility 88
TX AVG 80
Rank #441 / 988
-
61
Facility 61
TX AVG 41
Rank #269 / 1391
-
Signature Pointe
IL
HC
MC
NH
PC
RC
Dallas (Far North Dallas) -
195
Facility 195
TX AVG 80
Rank #14 / 988
A+
81
Facility 81
TX AVG 41
Rank #30 / 1391
Studio / 1 Bed / 2 Bed

Financial Assistance for
Independent Living in Texas

The Landon at Lake Highlands is located in Dallas, Texas.
Here are the financial assistance programs available to residents in Texas.

Get Financial aid guidance

Community Care for the Aged and Disabled (CCAD)

TX Medicaid CCAD

Age 65+ or disabled
General Texas resident, Medicaid-eligible, care need (not always nursing home level).
Income Limits (2025) ~$2,829/month 300% FBR, individual
Asset Limits $2,000 (individual), $3,000 (couple).
TX

Large state; rural access challenges.

Benefits
Personal care (5-7 hours/day) Respite (240 hours/year) Adult day care (~$60/day) Home aides

Texas Community Care Services

TX CCS

Age 60+
General Texas resident, at risk of decline.
Income Limits ~$2,000/month individual, varies
Asset Limits $5,000 individual
TX

Limited funding; high demand in urban areas.

Benefits
In-home care (3-5 hours/week) Respite (up to 10 days/year) Transportation (~5 trips/month)

Area Agency on Aging (AAA) Services

Texas AAA Services

Age 60+
General TX resident; no income/asset limits.
Income Limits (2025) None; donations encouraged.
Asset Limits Not assessed.
TX

28 AAAs; includes Meals on Wheels in some areas.

Benefits
Meals (~$5-$7/meal) Transportation Homemaker services (~4 hours/week) Respite (~5 days/year) Legal aid

Medicare Savings Program (MSP)

Texas Medicare Savings Program

Age 65+ or disabled
General TX resident, Medicare Part A/B.
Income Limits (2025) ~$2,510/month (QMB), ~$3,380/month (SLMB), ~$3,598/month (QI)—individual.
Asset Limits $9,430 (individual), $14,130 (couple).
TX

Includes Extra Help for Part D; no waitlist.

Benefits
Covers Part B premiums ($174.70/month) Deductibles ($240/year) Copays (~20%)

Family Caregiver Support Program (FCSP)

Texas Family Caregiver Support Program

Age
General Caregivers of 60+ needing care or 55+ caregivers of others; TX resident; 2+ ADLs.
Income Limits (2025) No strict cap; prioritizes low-income ~$24,980/year
Asset Limits Not assessed.
TX

High rural demand; includes grandparent caregivers.

Benefits
Respite (4-6 hours/week or 5 days/year) Adult day care ($60/day) Training Supplies (~$500/year)

VA Aid and Attendance (A&A) and Housebound Benefits

Texas VA Aid and Attendance/Housebound

Age 65+ or disabled veteran/spouse
General TX resident, wartime service, ADL help (A&A) or homebound.
Income Limits (2025) Net income < ~$1,984/month (veteran with dependent, A&A); pension offsets income.
Asset Limits ~$155,356 net worth
TX

High veteran population; supports rural/urban needs.

Benefits
Cash (~$1,433-$2,642/month veteran, ~$951-$1,318 spouse) for care costs

Property Tax Exemption for Seniors

Texas Senior Property Tax Exemption

Age 65+
General TX resident, homeowner (homestead).
Income Limits (2025) None; tax-based eligibility.
Asset Limits Not assessed.
TX

$25,000+ exemption; optional freeze in some counties; saves ~$500-$1,000/year.

Benefits
Tax exemption or freeze (~$500-$1,000/year savings)

Senior Farmers’ Market Nutrition Program (SFMNP)

Texas SFMNP

Age 60+
General TX resident, low-income.
Income Limits (2025) ~$2,322/month 185% FPL
Asset Limits Not assessed.
TX

Vouchers (~$50/season); serves ~20,000 via 28 AAAs.

Benefits
Vouchers (~$50/season) for produce at farmers’ markets

Frequently Asked Questions about The Landon at Lake Highlands

What neighborhood is The Landon at Lake Highlands in?

The Landon at Lake Highlands is in the The L Streets neighborhood.

Is The Landon at Lake Highlands in a walkable area?

The Landon at Lake Highlands has a walk score of 73. Very walkable. Most errands can be accomplished on foot, and many essentials are within a short walk.

What is the occupancy rate at The Landon at Lake Highlands?

The Landon at Lake Highlands's occupancy is 89.6%.

Are there photos of The Landon at Lake Highlands?

Yes — there are 11 photos of The Landon at Lake Highlands in the photo gallery on this page.

What is the phone number of The Landon at Lake Highlands?

(214) 343-6400 will put you in contact with the team at The Landon at Lake Highlands.

Is The Landon at Lake Highlands Medicare or Medicaid certified?

Yes — The Landon at Lake Highlands is a CMS-certified provider of Medicare and Medicaid.

Guides for Better Senior Living

Care Cost Calculator: See Prices in Your Area

Nursing Home Data Explorer

Don’t Wait Too Long: 7 Red Flag Signs Your Parent Needs Assisted Living Now

The True Cost of Assisted Living in 2025 – And How Families Are Paying For It

Understanding Senior Living Costs: Pricing Models, Discounts & Financial Assistance