The Pines Post Acute and Memory Care
Nursing Home & Memory Care · Clintonville, WI
CMS overall rating Info CMS (the Centers for Medicare & Medicaid Services) is the federal agency that rates nursing home quality. Its Overall Rating runs from 1 to 5 stars, combining health inspections, staffing, and quality measures, with inspections weighted most heavily.

The Pines Post Acute and Memory Care

Nursing Home & Memory Care · Clintonville, WI
CMS overall rating Info CMS (the Centers for Medicare & Medicaid Services) is the federal agency that rates nursing home quality. Its Overall Rating runs from 1 to 5 stars, combining health inspections, staffing, and quality measures, with inspections weighted most heavily.
Calculator: See prices in your area
The Pines Post Acute and Memory Care accepts Medicare, Medicaid, and private pay.

Overview of The Pines Post Acute and Memory Care

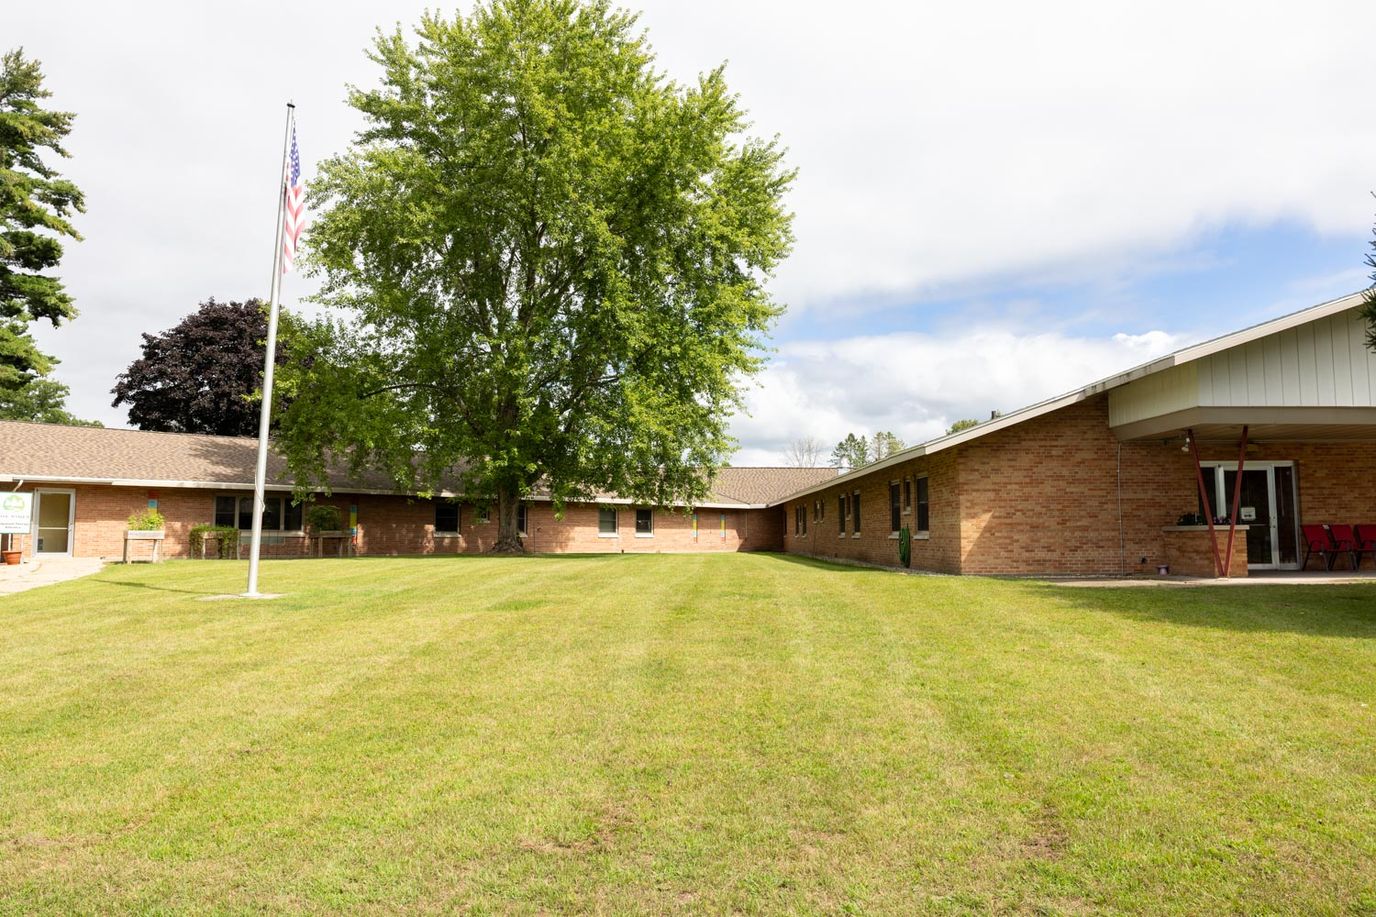
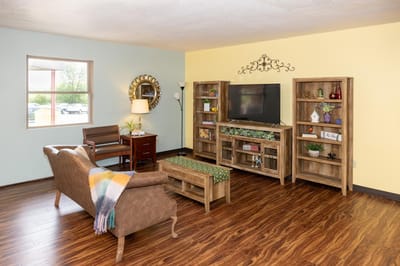
The Pines Post Acute and Memory Care is a skilled nursing and memory care community owned by Cloverleaf Healthcare LLC and managed by administrator Zachary Moan in Clintonville, Wisconsin. Operating as part of the Ensign Services network, a national healthcare organization with an extensive portfolio of post-acute properties, the community brings operational oversight and standardized clinical protocols to Waupaca County. Along with a 50-bed capacity, Medicare is accepted for covered services.

With 50 licensed beds, the community is able to provide a more personalized care experience, which allows staff members to develop a close familiarity with residents and their daily routines. At the same time, its affiliation with Ensign Services provides families with the assurance of professional management standards and clinical resources, commonly provided in larger healthcare organizations.

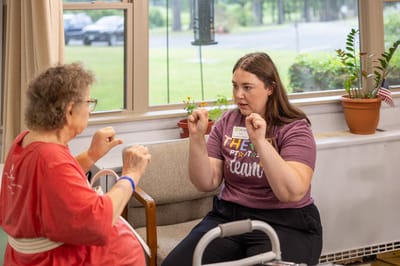
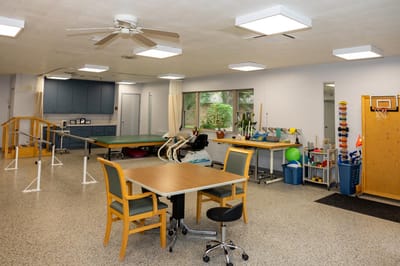
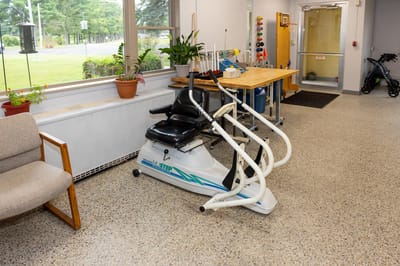
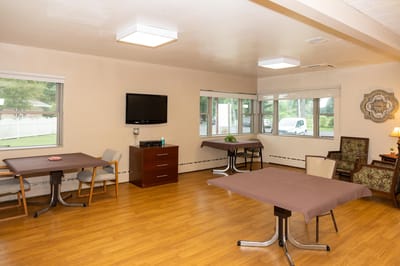
The community offers 24-hour staffing, skilled nursing care, in-house rehabilitation therapy, and specialized memory care programming. Compared to other communities that only provide general skilled nursing, the community’s memory care provides dedicated care for those living with Alzheimer’s disease and other forms of dementia. Monthly activity calendars, religious services, and a dining program that features nutritious meals tailored to individual resident needs are also provided for social engagement.

The Pines Post Acute and Memory Care is an ideal choice for individuals in Clintonville and the central Wisconsin region who require skilled nursing, short-term post-acute rehabilitation, or specialized memory care, particularly those looking for a dedicated memory care environment within a skilled nursing community. With this, the community minimizes the residents’ need to move to a different community as their cognitive needs change. For those who value the professional consistency of a managed healthcare network, the community’s affiliation with Ensign Services serves as a reliable sign.

Quality ratings

Measured by Centers for Medicare & Medicaid Services (CMS)

Overall rating Info The Overall CMS Rating combines results from health inspections, staffing levels and quality measures. Health inspections carry the most weight. Staffing and quality scores can increase or decrease the final rating based on performance compared to state and national standards.
Health Inspection Info Based on the results of the facility's three most recent standard inspections and any complaint investigations. CMS reviews the number, scope, and severity of deficiencies, with more recent findings weighted more heavily.
Staffing Info Measures average nursing staff hours per resident per day, including Registered Nurses (RNs) and total nursing staff. Ratings are adjusted based on the level of care residents require and are compared to state and national benchmarks.
Quality Measures Info Based on clinical and physical health indicators reported to CMS, such as hospital readmissions, falls, pressure ulcers, and improvements in mobility. These measures reflect how well residents' health needs are being managed.

Staffing hours breakdown

Info Daily nursing hours per resident by staff type, reported to CMS. Higher is generally better — compare this facility to state and national averages to see where staffing stands.

Hours per resident per day — compared to state averages

Total nursing care / resident Info Total adjusted nursing hours per resident per day, combining RN, LPN, and aide time. CMS adjusts this for case-mix so facilities can be fairly compared.
4h 36m per day
Rank #58 / 178Nurse hours — State benchmarkedThis home is ranked 58th out of 178 homes in Wisconsin. Shows adjusted nurse hours per resident per day benchmarked to the Wisconsin average, with a ranking across 178 Wisconsin facilities. More hours mean more direct care. The national average is about 3.5 hrs; below 3.0 is a red flag.Rankings are based only on facilities in Wisconsin that report data for that category. Facilities without available data are excluded from the ranking.Click the rank badge to see the full State ranking.Click here to see the full State ranking.
vs avg

1 of 6 metrics below state avg

Standout metric Registered Nurse (RN) is +21% above state avg
Staff typeHours / Day / Residentvs state avg
Registered Nurse (RN) Info RNs hold the highest nursing license and can assess residents, interpret test results, and direct care plans. More RN hours per day often signals stronger clinical oversight and faster response to health changes. 1h 10m per day ▲ 21% State avg: 58m per day · National avg: 41m per day
LPN / LVN Info Licensed Practical Nurses (LPNs) or Licensed Vocational Nurses (LVNs) deliver routine hands-on care — medication administration, wound dressing, and monitoring vital signs. They work under RN supervision and make up a large share of daily bedside care. 38m per day ■ Avg State avg: 38m per day · National avg: 52m per day
Nurse Aide Info Certified Nurse Aides (CNAs) provide the most direct day-to-day assistance: bathing, dressing, feeding, and mobility. Nurse aide hours are typically the largest staffing category and directly affect residents' quality of life. 2h 40m per day ▲ 3% State avg: 2h 35m per day · National avg: 2h 20m per day
Weekend Total Nursing Info Combined nursing hours (RN + LPN + Nurse Aide) per resident per day on weekends. Staffing often drops on weekends — this figure reveals whether the facility maintains adequate coverage outside of weekday hours. 4h 5m per day ▲ 10% State avg: 3h 43m per day · National avg: 3h 26m per day
Physical Therapist Info Hours per resident per day provided by licensed Physical Therapists (PTs) or PT Assistants. PT services help residents recover mobility after injury or illness and are especially important for post-acute (short-stay) rehabilitation. 2m per day ▼ 43% State avg: 4m per day · National avg: 4m per day
Weekend RN Info Registered nurse hours specifically on weekends. Facilities sometimes reduce RN presence on Saturdays and Sundays — a low weekend RN figure compared to weekday hours can indicate reduced clinical oversight when most administrative staff are absent. 45m per day ▲ 12% State avg: 40m per day · National avg: 28m per day

Capacity and availability

Avg. Length of Stay
150 days
Bed community size
50-bed community Rank #235 / 496Bed count — State benchmarkedThis home is ranked 235th out of 496 homes in Wisconsin. Shows this facility's certified or reported bed count compared to other Wisconsin facilities. Larger communities may offer more amenities, programs, and on-site services for residents and families.Rankings are based only on facilities in Wisconsin that report data for that category. Facilities without available data are excluded from the ranking.Click the rank badge to see the full State ranking.Click here to see the full State ranking.
A moderately sized community that may balance personal attention with shared amenities and social activities.
Walk Score
Walk Score: 56 / 100 Rank #180 / 580Walk Score — State benchmarkedThis home is ranked 180th out of 580 homes in Wisconsin. Shows how walkable this facility's neighborhood is compared to the average Walk Score across Wisconsin facilities. Higher scores benefit residents, families, and staff.Rankings are based only on facilities in Wisconsin that report data for that category. Facilities without available data are excluded from the ranking.Click the rank badge to see the full State ranking.Click here to see the full State ranking.
Moderately walkable. Some errands can be accomplished on foot, with a mix of nearby amenities.

About this community

Occupancy

Occupancy rate
60%
Rank #332 / 434Occupancy rate — State benchmarkedThis home is ranked 332nd out of 434 homes in Wisconsin. Shows this facility's occupancy rate versus the Wisconsin average, with its Statewide rank out of 434. Higher occupancy signals strong local demand and financial stability.Rankings are based only on facilities in Wisconsin that report data for that category. Facilities without available data are excluded from the ranking.Click the rank badge to see the full State ranking.Click here to see the full State ranking.
Lower than the Wisconsin average: 70%
Occupied beds
30 / 50
Average occupied beds in Wisconsin homes 54 beds

License Details

Facility TypeSkilled Care
CountyWaupaca
Certification TypeTitle 18 SNF Title 19 NF

Ownership & Operating Entity

The Pines Post Acute and Memory Care is legally operated by Zachary Moan.

Owner NameCloverleaf Healthcare LLC
Profit StatusNonprofit
Nonprofit OwnershipYes

Payment & Insurance

1 service
Accept Medicare

Therapy & Rehabilitation

1 service
Rehabilitation Services

Staffing & Medical

1 service
24-Hour Staffing

Contact Information

Fax(715) 823-1503

Amenities & Lifestyle

Activities
Specific ProgramsIn-House Therapy, Stay Active, Videos & Photos
Religious Services

Dining & Nutrition

Food DescriptionNutritious satisfying menus are provided.

Contact The Pines Post Acute and Memory Care

Health Inspection History

Inspections since 2022
Total health inspections 4

State average N/A


Last Health inspection on May 2025

Total health citations
10 Rank #36 / 180Health citations — State benchmarkedThis home is ranked 36th out of 180 homes in Wisconsin. Shows this facility's total health deficiency citations benchmarked to the Wisconsin State average, with a ranking across all 180 WI facilities. Lower citation counts earn a better rank.Rankings are based only on facilities in Wisconsin that report data for that category. Facilities without available data are excluded from the ranking.Click the rank badge to see the full State ranking.Click here to see the full State ranking.

State average N/A

Citations per inspection
2.5 Rank #28 / 180Citations per inspection — State benchmarkedThis home is ranked 28th out of 180 homes in Wisconsin. Shows average deficiency citations per CMS inspection for this facility versus the Wisconsin mean across 180 facilities with citation data. Lower is better.Rankings are based only on facilities in Wisconsin that report data for that category. Facilities without available data are excluded from the ranking.Click the rank badge to see the full State ranking.Click here to see the full State ranking.

State average N/A


Health citations are formal notices following inspections when they fail to comply with safety and care standards.

8 of 10 citations resulted from standard inspections; and 2 of 10 resulted from complaint investigations.

Breakdown of citation severity (last 4 years)
Critical health citations
0
In line with State average

State average: N/A


Serious health citations
0
In line with State average

State average: N/A

0 critical citations State average: N/A

0 serious citations State average: N/A

9 moderate citations State average: N/A

1 minor citation State average: N/A
Citations history (last 4 years)
Quality of Care moderate citation May 12, 2025
Corrected

Resident Rights moderate citation May 12, 2025
Corrected

Infection Control moderate citation Jan 29, 2025
Corrected

Nutrition moderate citation Jan 29, 2025
Corrected

Staffing Data

Reporting period: October 1 – December 31, 2025 (Q4 2025). Source: CMS Payroll-Based Journal report.

Total staff 152
Employees 120
Contractors 32
Staff to resident ratio 2.87 : 1
0% compared with State average

State average ratio: 0 : 0

Avg staff/day 43
Average shift 6.5 hours
0% compared with State average

State average: 0 hours

Total staff hours (quarter) 25,590

Nursing staff breakdown

Q4 2025 · Oct 1 – Dec 31 More info This data comes from the CMS Payroll-Based Journal report covering October 1 – December 31, 2025.
Registered Nurse

Manages medical care and health needs.

RN Staff Info All 20 RN Staff are full-time employees. No contractors work on this role. 20
Average shift length Info Average shift length. Calculated as total hours divided by days worked and average staff per day. 7.2 hours
Licensed Practical Nurse

Assists with medical care and medications.

LPN Staff Info All 10 LPN Staff are full-time employees. No contractors work on this role. 10
Average shift length Info Average shift length. Calculated as total hours divided by days worked and average staff per day. 7 hours
Certified Nursing Assistant

Helps with daily care and mobility.

CNA Staff Info 71 total: 69 full-time employees and 2 contractors. 71
Average shift length Info Average shift length. Calculated as total hours divided by days worked and average staff per day. 6.5 hours

Contractor staffing

Q4 2025 · Oct 1 – Dec 31 More info This data comes from the CMS Payroll-Based Journal report covering October 1 – December 31, 2025.

Total hours from contractors

9.7%

2,475 contractor hours this quarter

Speech Language Pathologist: 10 Respiratory Therapy Technician: 8 Physical Therapy Aide: 7 Physical Therapy Assistant: 4 Certified Nursing Assistant: 2 Qualified Social Worker: 1

Staff by category

Q4 2025 · Oct 1 – Dec 31 More info This data comes from the CMS Payroll-Based Journal report covering October 1 – December 31, 2025.
Certified Nursing Assistant6927112,08192100%6.5
Registered Nurse200203,89792100%7.2
Licensed Practical Nurse100102,97592100%7
Clinical Nurse Specialist4041,2016368%7.9
Mental Health Service Worker2029416672%7.7
Speech Language Pathologist010106537076%4.1
Nurse Practitioner1014725964%8
Administrator1014645863%8
Other Dietary Services Staff1014616368%7.3
Medication Aide/Technician4044605863%6.7
Dietitian1014496166%7.4
Occupational Therapy Aide1014396874%6.5
Physical Therapy Assistant0443796571%5.4
Physical Therapy Aide0773326773%4.1
Respiratory Therapy Technician0881796065%2
Nurse Aide in Training6061072022%5.1
Qualified Social Worker0111004650%2.2
71 Certified Nursing Assistant
% of Days 100%
20 Registered Nurse
% of Days 100%
10 Licensed Practical Nurse
% of Days 100%
4 Clinical Nurse Specialist
% of Days 68%
2 Mental Health Service Worker
% of Days 72%
10 Speech Language Pathologist
% of Days 76%
1 Nurse Practitioner
% of Days 64%
1 Administrator
% of Days 63%
1 Other Dietary Services Staff
% of Days 68%
4 Medication Aide/Technician
% of Days 63%
1 Dietitian
% of Days 66%
1 Occupational Therapy Aide
% of Days 74%
4 Physical Therapy Assistant
% of Days 71%
7 Physical Therapy Aide
% of Days 73%
8 Respiratory Therapy Technician
% of Days 65%
6 Nurse Aide in Training
% of Days 22%
1 Qualified Social Worker
% of Days 50%

Penalties and fines

Federal penalties imposed by CMS for regulatory violations, including civil money penalties (fines) and denials of payment for new Medicare/Medicaid admissions.

Source: CMS Penalties Database

No penalties in the past 3 years

No civil money penalties or payment denials were reported in the last 3 years.

Quality of care over time

These measures show how residents usually do over time at this home, based on health outcomes and preventive care.

High-risk clinical events score Info A composite score based on pressure ulcers, falls with injury, weight loss, walking ability decline, and activities of daily living decline. 9.6
8% better than State average

State average: 10.5

Functional decline score Info A composite score based on activities of daily living decline, walking ability decline, and incontinence. 18.4
17% better than State average

State average: 22.1

Long-stay resident measures
Significantly above average Info CMS star rating based on long-stay quality measure performance. 5 stars = significantly above average, 1 star = significantly below average.
Need for Help with Daily Activities Increased Info Percent of long-stay residents whose need for help with daily activities has increased 17.2%
In line with State average

State average: 17.6%

Walking Ability Worsened Info Percent of long-stay residents whose ability to move independently worsened 19.1%
16% better than State average

State average: 22.8%

Low Risk Residents with Bowel/Bladder Incontinence Info Percent of low risk long-stay residents who lose control of their bowels or bladder 18.8%
28% better than State average

State average: 26.0%

Falls with Major Injury Info Percent of long-stay residents experiencing one or more falls with major injury 3.8%
19% worse than State average

State average: 3.2%

High Risk Residents with Pressure Ulcers Info Percent of long-stay high risk residents with pressure ulcers 4.5%
18% better than State average

State average: 5.4%

Urinary Tract Infection Info Percent of long-stay residents with a urinary tract infection 4.5%
42% worse than State average

State average: 3.2%

Lost Too Much Weight Info Percent of long-stay residents who lose too much weight 3.5%
28% better than State average

State average: 4.9%

Depressive Symptoms Info Percent of long-stay residents who have depressive symptoms 3.3%
36% better than State average

State average: 5.0%

Antipsychotic Use Info Percent of long-stay residents who received an antipsychotic medication 10.7%
34% better than State average

State average: 16.1%

Pneumococcal Vaccine Info Percent of long-stay residents assessed and appropriately given the pneumococcal vaccine 100.0%
In line with State average

State average: 95.9%

Influenza Vaccine Info Percent of long-stay residents assessed and appropriately given the seasonal influenza vaccine 39.1%
59% worse than State average

State average: 95.0%

Short-stay resident measures
Pneumococcal Vaccine Info Percent of short-stay residents assessed and appropriately given the pneumococcal vaccine 98.6%
13% better than State average

State average: 87.3%

Antipsychotic medication increase Info Percent of short-stay residents who newly received an antipsychotic medication 1.0%
22% better than State average

State average: 1.2%

Influenza Vaccine Info Percent of short-stay residents assessed and appropriately given the seasonal influenza vaccine 91.2%
11% better than State average

State average: 82.2%

Breakdown by payment type

Medicare

33% of new residents, usually for short-term rehab.

Typical stay 1 - 2 months

Private pay

65% of new residents, often for short stays.

Typical stay 4 - 5 months

Medicaid

2% of new residents, often for long-term daily care.

Typical stay 6 - 7 years

Facility Characteristics

Source: CMS Long-Term Care Facility Characteristics (Data as of Jan 2026)

Total residents 53
Medicare
17
32.1% of residents
Medicaid
23
43.4% of residents
Private pay or other
13
24.5% of residents
Programs & Services
Residents Group

Residents meet regularly to discuss policies, care quality, and activities

Active Resident Council

Organized group of residents that meets regularly to discuss facility policies, quality of life, and activities.

Finances and operations

Based on CMS SNF Cost Report for fiscal year ending in 12/2023.

Nonprofit
Nonprofit Corporation
Net patient revenue Info Net patient revenue — what the home actually collects for resident care, after contractual allowances, bad debt and discounts are subtracted from its gross charges (CMS cost report, Worksheet G-3). It covers resident care only; money the home earns from other sources is shown separately as "Other income."
$6.8M
Net patient income Info Net patient income: net patient revenue minus the home's total operating expenses. A positive figure means it earns more from resident care than it spends to deliver it; a negative figure means the opposite. It excludes non-operating "other income."
$125.7K
Nonprofit Nonprofit Corporation
Net patient revenue Info Net patient revenue — what the home actually collects for resident care, after contractual allowances, bad debt and discounts are subtracted from its gross charges (CMS cost report, Worksheet G-3). It covers resident care only; money the home earns from other sources is shown separately as "Other income."
$6.8M Rank #113 / 183Revenue — State benchmarkedThis home is ranked 113th out of 183 homes in Wisconsin. Shows this facility's annual revenue compared to the Wisconsin average. Higher revenue generally means more resources for staffing and capital — read alongside Payroll %.Rankings are based only on facilities in Wisconsin that report data for that category. Facilities without available data are excluded from the ranking.Click the rank badge to see the full State ranking.Click here to see the full State ranking.
Net patient income Info Net patient income: net patient revenue minus the home's total operating expenses. A positive figure means it earns more from resident care than it spends to deliver it; a negative figure means the opposite. It excludes non-operating "other income."
$125.7K
Other income Info Money the home earns outside of resident care — such as investments, grants, rentals and other non-operating sources (CMS cost report, Worksheet G-3). It is tracked separately from net patient revenue: it is not part of that figure, and it is not included in net patient income.
$268.9K
Payroll costs Info Staff salaries plus wage-related costs — benefits such as payroll taxes, health insurance and retirement — from the home's own accounting records (CMS cost report, Worksheet A). Contract or agency labor is counted separately, under other operating costs. Rank #92 / 183Payroll — State benchmarkedThis home is ranked 92nd out of 183 homes in Wisconsin. Shows total annual staff payroll benchmarked to the Wisconsin average. Higher payroll investment relative to peers often signals better staffing and less reliance on cheaper contract labor.Rankings are based only on facilities in Wisconsin that report data for that category. Facilities without available data are excluded from the ranking.Click the rank badge to see the full State ranking.Click here to see the full State ranking.
$4.4M 64.9% of net patient revenue Info Payroll as a share of revenue: staff salaries and wage-related benefits divided by net patient revenue. A higher figure means more of each revenue dollar goes to staff pay. Rank #49 / 183Payroll % — State benchmarkedThis home is ranked 49th out of 183 homes in Wisconsin. Shows payroll as a percentage of revenue versus the Wisconsin average. Well-run Wisconsin facilities typically land around 62–74% — the top third Statewide. Below 25% may signal understaffing or heavy agency use — read with Staffing ratings.Rankings are based only on facilities in Wisconsin that report data for that category. Facilities without available data are excluded from the ranking.Click the rank badge to see the full State ranking.Click here to see the full State ranking.
Other operating costs Info Everything it costs to run the home apart from payroll — food, utilities, supplies, maintenance, contract labor and administration. Calculated as total operating expense minus payroll (staff salaries and wage-related benefits).
$2.2M
Total costs Info The home's total operating expense for the year — all the costs of running it, salaries included (CMS cost report, Worksheet G-3).
$6.6M

Who this home usually serves

TYPE OF STAY

Primarily short stays

Residents typically stay for brief periods, with frequent admissions and discharges throughout the year.

Most new residents arrive under private pay (65% of admissions), and a typical private pay stay runs around 4 - 5 months.

Admissions
112 total

Coverage residents most often arrive under.

Medicare 33%
Private pay 65%
Medicaid 2%
Discharges
116 total

Coverage residents most often leave under.

Medicare 27%
Private pay 71%
Medicaid 3%

Places of interest near The Pines Post Acute and Memory Care

Address 0.0 miles from city center Info Estimated distance in miles from Clintonville's city center to The Pines Post Acute and Memory Care's address, calculated via Google Maps.

Calculate Travel Distance to The Pines Post Acute and Memory Care

Add your location

Address

Compare Nursing Homes around the area

The information below is reported by the Wisconsin Department of Health Services, Division of Quality Assurance.

The Pines Post Acute and Memory Care
NH
MC
Clintonville -50 - 56 -
Waunakee Valley Senior Living
NH
AL
IL
MC
Waunakee (Country Aire) $695 - $2,69594 - 51 Studio / 1 Bed / 2 Bed
The Waters of Pewaukee
NH
AL
IL
MC
Waukesha (City Of Pewaukee) $6,300 - $8,10016 - 13 Cottage / Studio / 1 Bed / 2 Bed
Harbor Haven Health & Rehabilitation
NH
HC
MC
PC
Fond Du Lac -85 - 57 Private / Semi-Private Rooms
Meadowbrook at Oconto Falls
NH
HC
RC
Oconto Falls -99 A+ 25 -

Frequently Asked Questions about The Pines Post Acute and Memory Care

Who is the owner of The Pines Post Acute and Memory Care?

The legal owner and operator of The Pines Post Acute and Memory Care is Cloverleaf Healthcare Llc.

Is The Pines Post Acute and Memory Care in a walkable area?

The Pines Post Acute and Memory Care has a walk score of 56. Moderately walkable. Some errands can be accomplished on foot, with a mix of nearby amenities.

What is the occupancy rate at The Pines Post Acute and Memory Care?

The Pines Post Acute and Memory Care's occupancy is 60%.

Does The Pines Post Acute and Memory Care operate as a for-profit or non-profit?

The Pines Post Acute and Memory Care is registered as a non-profit in WI.

Who is the administrator of The Pines Post Acute and Memory Care?

Zachary Moan is the administrator of The Pines Post Acute and Memory Care.

How many beds does The Pines Post Acute and Memory Care have?

The Pines Post Acute and Memory Care has 50 beds.

Are there photos of The Pines Post Acute and Memory Care?

Yes — there are 6 photos of The Pines Post Acute and Memory Care in the photo gallery on this page.

Guides for Better Senior Living

Care Cost Calculator: See Prices in Your Area

Nursing Home Data Explorer

Don’t Wait Too Long: 7 Red Flag Signs Your Parent Needs Assisted Living Now

The True Cost of Assisted Living in 2025 – And How Families Are Paying For It

Understanding Senior Living Costs: Pricing Models, Discounts & Financial Assistance