The Rose Schnitzer Manor at Cedar Sinai Park
Nursing Home & Assisted Living · Portland, OR
CMS overall rating Info CMS (the Centers for Medicare & Medicaid Services) is the federal agency that rates nursing home quality. Its Overall Rating runs from 1 to 5 stars, combining health inspections, staffing, and quality measures, with inspections weighted most heavily.

The Rose Schnitzer Manor at Cedar Sinai Park

Nursing Home & Assisted Living · Portland, OR
CMS overall rating Info CMS (the Centers for Medicare & Medicaid Services) is the federal agency that rates nursing home quality. Its Overall Rating runs from 1 to 5 stars, combining health inspections, staffing, and quality measures, with inspections weighted most heavily.
Calculator: See prices in your area
The Rose Schnitzer Manor at Cedar Sinai Park accepts Medicare, Medicaid, and private pay.

Overview of The Rose Schnitzer Manor at Cedar Sinai Park

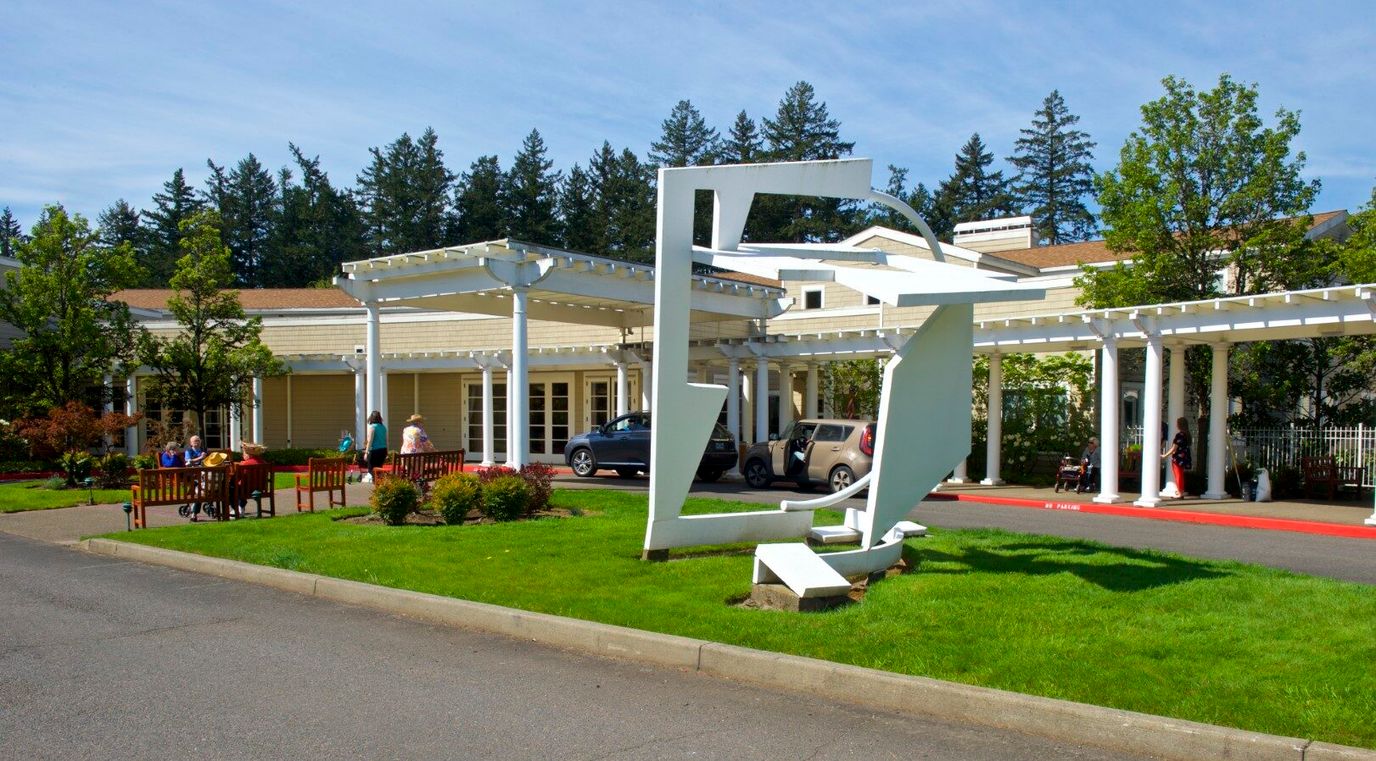
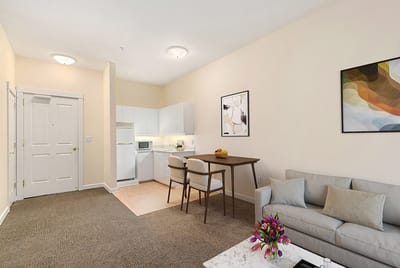
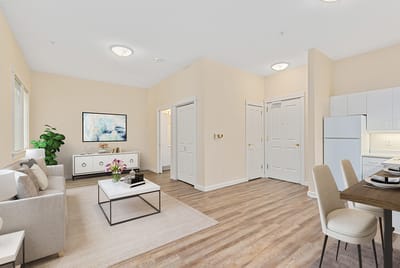
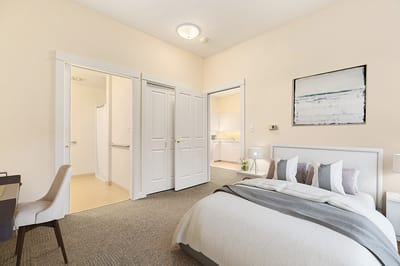
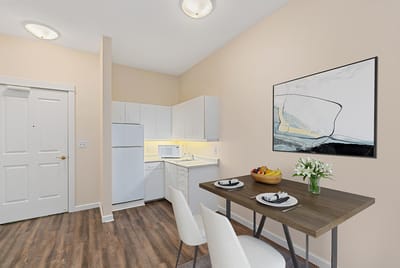
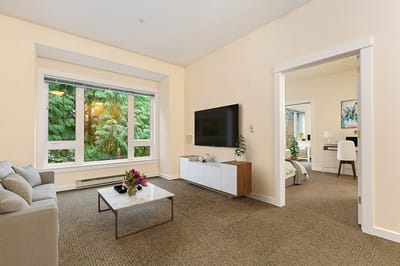
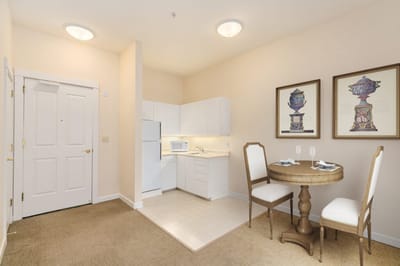
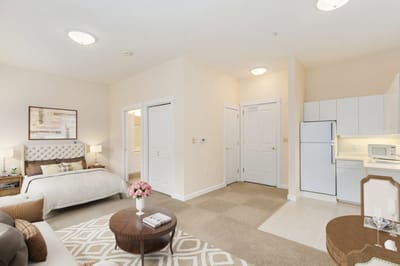
Live a fulfilling retirement life in The Rose Schnitzer Manor at Cedar Sinai Park, a warm and inviting community in Portland, OR, offering assisted living, skilled nursing, and adult day services. Their kind and reliable team warmly welcome residents into their well-designed accommodations and provide them with comprehensive daily living assistance. For residents living with a condition that requires long-term care, their exceptional skilled nursing team is available 24/7 to accommodate their needs.

Dedicated to creating a vibrant and enriching environment, the community features a wide array of stimulating activities tailored to residents’ interests and abilities. Access to physical, occupational, and speech therapies are also available to ensure residents looking to maintain their mobility or recover from an injury have the services they need. Here, you’ll experience true comfort surrounded by genuine people and friendly residents.

Quality ratings

Measured by Centers for Medicare & Medicaid Services (CMS)

Overall rating Info The Overall CMS Rating combines results from health inspections, staffing levels and quality measures. Health inspections carry the most weight. Staffing and quality scores can increase or decrease the final rating based on performance compared to state and national standards.
▼ 33.3% Below OR avg. ▼ 33.3% Below OR avg.OR average: 3.0Click the badge to see the full State ranking.Click here to see the full State ranking.
Health Inspection Info Based on the results of the facility's three most recent standard inspections and any complaint investigations. CMS reviews the number, scope, and severity of deficiencies, with more recent findings weighted more heavily.
▼ 27.6% Below OR avg. ▼ 27.6% Below OR avg.OR average: 2.8Click the badge to see the full State ranking.Click here to see the full State ranking.
Staffing Info Measures average nursing staff hours per resident per day, including Registered Nurses (RNs) and total nursing staff. Ratings are adjusted based on the level of care residents require and are compared to state and national benchmarks.
▲ 7.7% Above OR avg. ▲ 7.7% Above OR avg.OR average: 3.7Click the badge to see the full State ranking.Click here to see the full State ranking.
Quality Measures Info Based on clinical and physical health indicators reported to CMS, such as hospital readmissions, falls, pressure ulcers, and improvements in mobility. These measures reflect how well residents' health needs are being managed.
▲ 16.1% Above OR avg. ▲ 16.1% Above OR avg.OR average: 3.4Click the badge to see the full State ranking.Click here to see the full State ranking.

Staffing hours breakdown

Info Daily nursing hours per resident by staff type, reported to CMS. Higher is generally better — compare this facility to state and national averages to see where staffing stands.

Hours per resident per day — compared to Oregon state averages

Total nursing care / resident Info This home is ranked 45th out of 97 homes in Oregon for nurse hours. Total adjusted nursing hours per resident per day, combining RN, LPN, and aide time. CMS adjusts this for case-mix so facilities can be fairly compared.
5h 14m per day
Rank #45 / 97Nurse hours — State benchmarkedThis home is ranked 45th out of 97 homes in Oregon. Shows adjusted nurse hours per resident per day benchmarked to the Oregon average, with a ranking across 97 Oregon facilities. More hours mean more direct care. The national average is about 3.5 hrs; below 3.0 is a red flag.Rankings are based only on facilities in Oregon that report data for that category. Facilities without available data are excluded from the ranking.Click the rank badge to see the full State ranking.Click here to see the full State ranking.
This facility Oregon avg (5h 15m per day)
vs Oregon avg
+0%

1 of 6 metrics below state avg

Standout metric Physical Therapist is +68% above state avg
Staff typeHours / Day / Residentvs state avg
Registered Nurse (RN) Info RNs hold the highest nursing license and can assess residents, interpret test results, and direct care plans. More RN hours per day often signals stronger clinical oversight and faster response to health changes. 41m per day ■ Avg State avg: 42m per day · National avg: 41m per day
LPN / LVN Info Licensed Practical Nurses (LPNs) or Licensed Vocational Nurses (LVNs) deliver routine hands-on care — medication administration, wound dressing, and monitoring vital signs. They work under RN supervision and make up a large share of daily bedside care. 46m per day ▼ 17% State avg: 55m per day · National avg: 52m per day
Nurse Aide Info Certified Nurse Aides (CNAs) provide the most direct day-to-day assistance: bathing, dressing, feeding, and mobility. Nurse aide hours are typically the largest staffing category and directly affect residents' quality of life. 3h 48m per day ▲ 10% State avg: 3h 27m per day · National avg: 2h 20m per day
Weekend Total Nursing Info Combined nursing hours (RN + LPN + Nurse Aide) per resident per day on weekends. Staffing often drops on weekends — this figure reveals whether the facility maintains adequate coverage outside of weekday hours. 4h 46m per day ▲ 5% State avg: 4h 32m per day · National avg: 3h 27m per day
Physical Therapist Info Hours per resident per day provided by licensed Physical Therapists (PTs) or PT Assistants. PT services help residents recover mobility after injury or illness and are especially important for post-acute (short-stay) rehabilitation. 9m per day ▲ 68% State avg: 5m per day · National avg: 4m per day
Weekend RN Info Registered nurse hours specifically on weekends. Facilities sometimes reduce RN presence on Saturdays and Sundays — a low weekend RN figure compared to weekday hours can indicate reduced clinical oversight when most administrative staff are absent. 30m per day ▲ 11% State avg: 27m per day · National avg: 29m per day

Capacity and availability

This home usually has availability

Lower occupancy than the Oregon average: 65.7%
Occupancy rate
49% Rank #82 / 95Occupancy rate — State benchmarkedThis home is ranked 82nd out of 95 homes in Oregon. Shows this facility's occupancy rate versus the Oregon average, with its Statewide rank out of 95. Higher occupancy signals strong local demand and financial stability.Rankings are based only on facilities in Oregon that report data for that category. Facilities without available data are excluded from the ranking.Click the rank badge to see the full State ranking.Click here to see the full State ranking.
Avg. Length of Stay
121 days
Bed community size
92-bed community Rank #69 / 351Bed count — State benchmarkedThis home is ranked 69th out of 351 homes in Oregon. Shows this facility's certified or reported bed count compared to other Oregon facilities. Larger communities may offer more amenities, programs, and on-site services for residents and families.Rankings are based only on facilities in Oregon that report data for that category. Facilities without available data are excluded from the ranking.Click the rank badge to see the full State ranking.Click here to see the full State ranking.
A larger shared setting that may offer more common spaces and organized community services.
Walk Score
Walk Score: 33 / 100 Rank #376 / 476Walk Score — State benchmarkedThis home is ranked 376th out of 476 homes in Oregon. Shows how walkable this facility's neighborhood is compared to the average Walk Score across Oregon facilities. Higher scores benefit residents, families, and staff.Rankings are based only on facilities in Oregon that report data for that category. Facilities without available data are excluded from the ranking.Click the rank badge to see the full State ranking.Click here to see the full State ranking.
Somewhat walkable. A few nearby services may be reachable on foot, but most trips require transportation.

Safety & Compliance

Wheelchair Accessible

Therapy & Rehabilitation

1 service
Respite Care

Staffing & Medical

2 services
Nursing Services
24-Hour Staffing

Additional Policies & Features

HousekeepingYes
Linen ServiceYes

Amenities & Lifestyle

Beautiful
Light-Filled Apartments
Weekly Housekeeping And Linen Service
Concierge Services
Pet-Friendly Community
Assistance With Medication Management
Access To Engaging Activities
Wellness Programs
Cultural Events
Smoke-Free Environment
Activities
Specific ProgramsActive Assisted Living, In-Home Caregiving, Adult Day Service, Wellness Support Programs
Religious ServicesWeekly Jewish Shabbat services as well as holiday services and celebrations for people of all faiths
Operating HoursOpen for calls 24/7 (including holidays).

Dining & Nutrition

Food DescriptionThree delicious and nutritious meals daily; private dining room and in-home dining available.

Contact The Rose Schnitzer Manor at Cedar Sinai Park

Staffing Data

Reporting period: October 1 – December 31, 2025 (Q4 2025). Source: CMS Payroll-Based Journal report.

Total staff 292
Employees 115
Contractors 177
Staff to resident ratio 3.74 : 1
28% more staff per resident than Oregon average
Oregon average ratio: 2.93 : 1 Oregon average ratio: 2.93 : 1See full Oregon ranking
Avg staff/day 54
Average shift 8.5 hours
9% better than Oregon average
Oregon average: 7.8 hours Oregon average shift: 7.8 hoursSee full Oregon ranking
Total staff hours (quarter) 42,306

Nursing staff breakdown

Q4 2025 · Oct 1 – Dec 31 More info This data comes from the CMS Payroll-Based Journal report covering October 1 – December 31, 2025.
Registered Nurse

Manages medical care and health needs.

RN Staff Info 43 total: 11 full-time employees and 32 contractors. 43
Average shift length Info Average shift length. Calculated as total hours divided by days worked and average staff per day. 8.7 hours
Licensed Practical Nurse

Assists with medical care and medications.

LPN Staff Info 39 total: 12 full-time employees and 27 contractors. 39
Average shift length Info Average shift length. Calculated as total hours divided by days worked and average staff per day. 9.6 hours
Certified Nursing Assistant

Helps with daily care and mobility.

CNA Staff Info 136 total: 53 full-time employees and 83 contractors. 136
Average shift length Info Average shift length. Calculated as total hours divided by days worked and average staff per day. 8.9 hours

Contractor staffing

Q4 2025 · Oct 1 – Dec 31 More info This data comes from the CMS Payroll-Based Journal report covering October 1 – December 31, 2025.

Total hours from contractors

9%

3,817 contractor hours this quarter

Certified Nursing Assistant: 83 Registered Nurse: 32 Licensed Practical Nurse: 27 Respiratory Therapy Technician: 14 Physical Therapy Assistant: 12 Medication Aide/Technician: 3 Speech Language Pathologist: 2 Qualified Social Worker: 2 Medical Director: 1 Occupational Therapy Assistant: 1

Staff by category

Q4 2025 · Oct 1 – Dec 31 More info This data comes from the CMS Payroll-Based Journal report covering October 1 – December 31, 2025.
Certified Nursing Assistant538313622,63592100%8.9
Licensed Practical Nurse1227394,97292100%9.6
Registered Nurse1132434,29892100%8.7
Medication Aide/Technician113143,94792100%10.5
Physical Therapy Assistant1012221,5008087%5.6
Respiratory Therapy Technician614201,0757582%6.1
Mental Health Service Worker2021,0056672%8.5
Speech Language Pathologist2245997278%5.5
Administrator1015126470%8
Nurse Practitioner1015126470%8
Dietitian1014476065%7.5
RN Director of Nursing1013725257%7.1
Qualified Social Worker3253596571%4.3
Occupational Therapy Assistant0113367%5.5
Medical Director011303033%1
Physical Therapy Aide1011178%1.5
136 Certified Nursing Assistant
% of Days 100%
39 Licensed Practical Nurse
% of Days 100%
43 Registered Nurse
% of Days 100%
14 Medication Aide/Technician
% of Days 100%
22 Physical Therapy Assistant
% of Days 87%
20 Respiratory Therapy Technician
% of Days 82%
2 Mental Health Service Worker
% of Days 72%
4 Speech Language Pathologist
% of Days 78%
1 Administrator
% of Days 70%
1 Nurse Practitioner
% of Days 70%
1 Dietitian
% of Days 65%
1 RN Director of Nursing
% of Days 57%
5 Qualified Social Worker
% of Days 71%
1 Occupational Therapy Assistant
% of Days 7%
1 Medical Director
% of Days 33%
1 Physical Therapy Aide
% of Days 8%

Penalties and fines

Includes penalties issued in 2024

Federal penalties imposed by CMS for regulatory violations, including civil money penalties (fines) and denials of payment for new Medicare/Medicaid admissions.

Source: CMS Penalties Database (Data as of Jan 2026)

Total fines amount $38K Rank #83 / 98Federal fines — State benchmarkedThis home is ranked 83rd out of 98 homes in Oregon. Shows this facility's cumulative CMS federal fine dollars versus the Oregon average among facilities with fines, and where it ranks among 98 facilities in the pool. Lower total dollars mean a better rank.Rankings are based only on facilities in Oregon that report data for that category. Facilities without available data are excluded from the ranking.Click the rank badge to see the full State ranking.Click here to see the full State ranking.
36% lower than Oregon average

Oregon average: $60K

Number of fines 8
373% more fines than Oregon average

Oregon average: 1.7

Payment Denials Info Serious action where Medicare and/or Medicaid temporarily stops payments for new residents until issues are fixed. 0
100% fewer payment denials than Oregon average

Oregon average: 0.1

Fines amount comparison
This facility $38K
Oregon average $60K
Penalty History

Penalties are imposed by CMS for violations of federal nursing home regulations.

1 penalty in the past 3 years

Aug 2, 2024 · $11K

Civil Money Penalty Info Fines imposed for noncompliance, which can be assessed per day or per instance of violation. Aug 2, 2024
$11K

Last updated: Jan 2026

Quality of care over time

These measures show how residents usually do over time at this home, based on health outcomes and preventive care.

High-risk clinical events score Info A composite score based on pressure ulcers, falls with injury, weight loss, walking ability decline, and activities of daily living decline. 10.9
In line with Oregon average

Oregon average: 10.5

Functional decline score Info A composite score based on activities of daily living decline, walking ability decline, and incontinence. 23.9
14% worse than Oregon average

Oregon average: 21.1

Long-stay resident measures
Need for Help with Daily Activities Increased Info Percent of long-stay residents whose need for help with daily activities has increased 16.3%
In line with Oregon average

Oregon average: 16.3%

Walking Ability Worsened Info Percent of long-stay residents whose ability to move independently worsened 22.8%
9% better than Oregon average

Oregon average: 24.9%

Low Risk Residents with Bowel/Bladder Incontinence Info Percent of low risk long-stay residents who lose control of their bowels or bladder 32.6%
44% worse than Oregon average

Oregon average: 22.6%

Falls with Major Injury Info Percent of long-stay residents experiencing one or more falls with major injury 2.8%
18% worse than Oregon average

Oregon average: 2.4%

High Risk Residents with Pressure Ulcers Info Percent of long-stay high risk residents with pressure ulcers 7.0%
In line with Oregon average

Oregon average: 6.9%

Urinary Tract Infection Info Percent of long-stay residents with a urinary tract infection 0.7%
66% better than Oregon average

Oregon average: 2.1%

Lost Too Much Weight Info Percent of long-stay residents who lose too much weight 5.4%
In line with Oregon average

Oregon average: 5.3%

Depressive Symptoms Info Percent of long-stay residents who have depressive symptoms 3.9%
17% better than Oregon average

Oregon average: 4.6%

Antipsychotic Use Info Percent of long-stay residents who received an antipsychotic medication 9.1%
31% better than Oregon average

Oregon average: 13.2%

Pneumococcal Vaccine Info Percent of long-stay residents assessed and appropriately given the pneumococcal vaccine 97.2%
In line with Oregon average

Oregon average: 95.7%

Influenza Vaccine Info Percent of long-stay residents assessed and appropriately given the seasonal influenza vaccine 100.0%
5% better than Oregon average

Oregon average: 95.2%

Short-stay resident measures
Pneumococcal Vaccine Info Percent of short-stay residents assessed and appropriately given the pneumococcal vaccine 98.7%
14% better than Oregon average

Oregon average: 86.2%

Antipsychotic medication increase Info Percent of short-stay residents who newly received an antipsychotic medication 0.0%
100% better than Oregon average

Oregon average: 1.8%

Influenza Vaccine Info Percent of short-stay residents assessed and appropriately given the seasonal influenza vaccine 98.2%
21% better than Oregon average

Oregon average: 81.2%

Breakdown by payment type

Medicare

15% of new residents, usually for short-term rehab.

Typical stay 19 days

Private pay

67% of new residents, often for short stays.

Typical stay 1 - 2 months

Medicaid

18% of new residents, often for long-term daily care.

Typical stay 7 - 8 months

Facility Characteristics

Source: CMS Long-Term Care Facility Characteristics (Data as of Jan 2026)

Total residents 78
Medicare
30
38.5% of residents
Medicaid
30
38.5% of residents
Private pay or other
18
23.1% of residents
Programs & Services
Residents Group

Residents meet regularly to discuss policies, care quality, and activities

Active Resident Council

Organized group of residents that meets regularly to discuss facility policies, quality of life, and activities.

Finances and operations

Based on CMS SNF Cost Report for fiscal year ending in 06/2024.

For-profit
Operated by a single business entity.
Net patient revenue Info Net patient revenue — what the home actually collects for resident care, after contractual allowances, bad debt and discounts are subtracted from its gross charges (CMS cost report, Worksheet G-3). It covers resident care only; money the home earns from other sources is shown separately as "Other income."
$9.1M
Net patient income Info Net patient income: net patient revenue minus the home's total operating expenses. A positive figure means it earns more from resident care than it spends to deliver it; a negative figure means the opposite. It excludes non-operating "other income."
-$2.8M
For-profit Operated by a single business entity.
Net patient revenue Info Net patient revenue — what the home actually collects for resident care, after contractual allowances, bad debt and discounts are subtracted from its gross charges (CMS cost report, Worksheet G-3). It covers resident care only; money the home earns from other sources is shown separately as "Other income."
$9.1M Rank #66 / 93Revenue — State benchmarkedThis home is ranked 66th out of 93 homes in Oregon. Shows this facility's annual revenue compared to the Oregon average. Higher revenue generally means more resources for staffing and capital — read alongside Payroll %.Rankings are based only on facilities in Oregon that report data for that category. Facilities without available data are excluded from the ranking.Click the rank badge to see the full State ranking.Click here to see the full State ranking.
Net patient income Info Net patient income: net patient revenue minus the home's total operating expenses. A positive figure means it earns more from resident care than it spends to deliver it; a negative figure means the opposite. It excludes non-operating "other income."
-$2.8M
Other income Info Money the home earns outside of resident care — such as investments, grants, rentals and other non-operating sources (CMS cost report, Worksheet G-3). It is tracked separately from net patient revenue: it is not part of that figure, and it is not included in net patient income.
$7.9K
Payroll costs Info Staff salaries plus wage-related costs — benefits such as payroll taxes, health insurance and retirement — from the home's own accounting records (CMS cost report, Worksheet A). Contract or agency labor is counted separately, under other operating costs. Rank #41 / 93Payroll — State benchmarkedThis home is ranked 41st out of 93 homes in Oregon. Shows total annual staff payroll benchmarked to the Oregon average. Higher payroll investment relative to peers often signals better staffing and less reliance on cheaper contract labor.Rankings are based only on facilities in Oregon that report data for that category. Facilities without available data are excluded from the ranking.Click the rank badge to see the full State ranking.Click here to see the full State ranking.
$5.6M 61.3% of net patient revenue Info Payroll as a share of revenue: staff salaries and wage-related benefits divided by net patient revenue. A higher figure means more of each revenue dollar goes to staff pay. Rank #12 / 93Payroll % — State benchmarkedThis home is ranked 12th out of 93 homes in Oregon. Shows payroll as a percentage of revenue versus the Oregon average. Well-run Oregon facilities typically land around 51–62% — the top third Statewide. Below 25% may signal understaffing or heavy agency use — read with Staffing ratings.Rankings are based only on facilities in Oregon that report data for that category. Facilities without available data are excluded from the ranking.Click the rank badge to see the full State ranking.Click here to see the full State ranking.
Other operating costs Info Everything it costs to run the home apart from payroll — food, utilities, supplies, maintenance, contract labor and administration. Calculated as total operating expense minus payroll (staff salaries and wage-related benefits).
$6.3M
Total costs Info The home's total operating expense for the year — all the costs of running it, salaries included (CMS cost report, Worksheet G-3).
$11.9M

What does this home offer?

Pets allowed icon
Pets allowed icon

Pets Allowed

Housing options icon

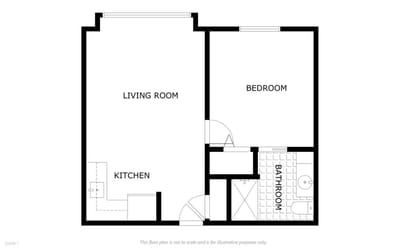
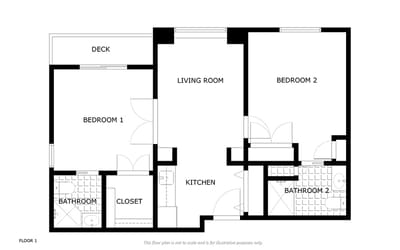
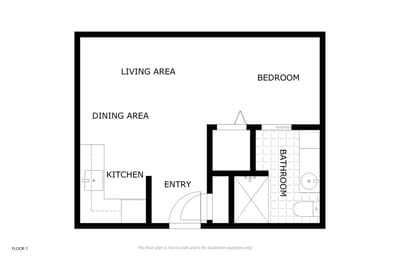
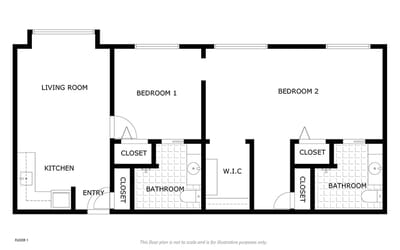
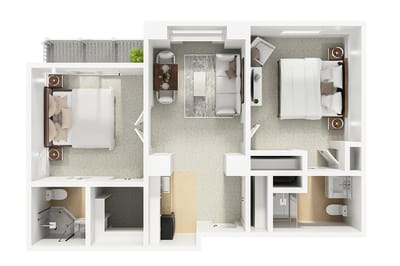
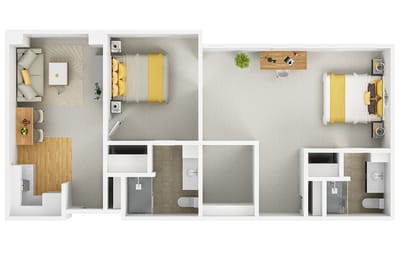
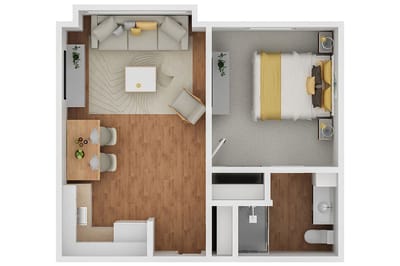
Housing Options: Studio / 1 Bed / 2 Bed

Building type icon
Building type icon

Building Type: 3-story

Beauty services icon

Beauty Services

Transportation services icon

Transportation Services

Housekeeping icon
Housekeeping icon

Housekeeping Services

Recreational activities icon

Recreational Activities

Exercise program icon

Exercise Programs

Health Programs icon

Health Programs

Who this home usually serves

TYPE OF STAY

Primarily long-term care, limited rehab

Most residents stay long-term, while a smaller portion are admitted for short-term rehab.

Most new residents arrive under private pay (67% of admissions), and a typical private pay stay runs around 1 - 2 months.

Admissions
228 total

Coverage residents most often arrive under.

Medicare 15%
Private pay 67%
Medicaid 18%
Discharges
136 total

Coverage residents most often leave under.

Medicare 15%
Private pay 62%
Medicaid 23%

Places of interest near The Rose Schnitzer Manor at Cedar Sinai Park

Address 5.8 miles from city center Info Estimated distance in miles from Portland's city center to The Rose Schnitzer Manor at Cedar Sinai Park's address, calculated via Google Maps.

Calculate Travel Distance to The Rose Schnitzer Manor at Cedar Sinai Park

Add your location

Address

Compare Assisted Living around Portland

The information below is reported by the Oregon Department of Human Services, Aging and People with Disabilities.

The Rose Schnitzer Manor at Cedar Sinai Park
AL
NH
Portland (Hayhurst) -
92
Facility 92
OR AVG 67
Rank #69 / 351
-
33
Facility 33
OR AVG 55
Rank #376 / 476
Studio / 1 Bed / 2 Bed
Mirabella Portland
AL
MC
NH
Portland (Southwest Portland) -
27
Facility 27
OR AVG 67
Rank #316 / 351
A+
81
Facility 81
OR AVG 55
Rank #82 / 476
1 Bed / 2 Bed
Gateway Care & Retirement Center
AL
NH
Portland (Hazelwood) -
59
Facility 59
OR AVG 67
Rank #193 / 351
-
82
Facility 82
OR AVG 55
Rank #73 / 476
-
Marquis Vermont Hills
AL
NH
Portland (Southwest Portland) -
73
Facility 73
OR AVG 67
Rank #133 / 351
-
37
Facility 37
OR AVG 55
Rank #351 / 476
-
Prestige Care and Rehabilitation of Reedwood
AL
NH
Portland (Creston - Kenilworth) -
64
Facility 64
OR AVG 67
Rank #163 / 351
-
84
Facility 84
OR AVG 55
Rank #57 / 476
-

Financial Assistance for
Assisted Living in Oregon

The Rose Schnitzer Manor at Cedar Sinai Park is located in Portland, Oregon.
Here are the financial assistance programs available to residents in Oregon.

Get Financial aid guidance

Oregon Project Independence (OPI)

OPI

Age 60+
General Oregon resident, at risk of nursing home but not Medicaid-eligible.
Income Limits ~$2,000/month individual, varies
Asset Limits $5,000 individual
OR

Cost-sharing required; rural/urban balance.

Benefits
In-home care (3-5 hours/week) Respite (up to 10 days/year) Adult day care (~$70/day) Transportation (~5 trips/month)

Oregon Medicaid Community-Based Care

OR Medicaid CBC

Age 65+ or disabled
General Oregon resident, Medicaid-eligible, nursing home-level care need.
Income Limits (2025) ~$2,829/month 300% FBR, individual
Asset Limits $2,000 (individual), $3,000 (couple).
OR

High demand in urban areas (e.g., Portland).

Benefits
Personal care (5-7 hours/day) Respite (240 hours/year) Adult day care ($70/day) Home modifications ($1,500 avg.)

Program of All-Inclusive Care for the Elderly (PACE)

Oregon PACE (e.g., Providence ElderPlace)

Age 55+
General OR resident (specific counties), NFLOC, safe with PACE support.
Income Limits (2025) ~$2,829/month (Medicaid-eligible); private pay option available.
Asset Limits $2,000 (individual), $3,000 (couple) for Medicaid enrollees.
OR

Available in 11 counties (e.g., Multnomah, Washington); Providence ElderPlace dominant provider.

Benefits
Personal care (5-7 hours/day) Medical care Meals Transportation Respite Therapies

Medicare Savings Program (MSP)

Oregon Medicare Savings Program

Age 65+ or disabled
General OR resident, Medicare Part A/B.
Income Limits (2025) ~$2,510/month (QMB), ~$3,380/month (SLMB), ~$3,598/month (QI)—individual.
Asset Limits $9,430 (individual), $14,130 (couple).
OR

Three tiers; includes Extra Help for Part D; no waitlist.

Benefits
Covers Part B premiums ($174.70/month) Deductibles ($240/year) Copays (~20%)

Family Caregiver Support Program (FCSP)

Oregon Family Caregiver Support Program

Age
General Caregivers of 60+ needing care or 55+ caregivers of others; OR resident; functional needs (2+ ADLs).
Income Limits (2025) No strict cap; prioritizes low-income ~$24,980/year
Asset Limits Not assessed; need-based.
OR

15 regions; rural priority; includes grandparent caregivers.

Benefits
Respite (4-6 hours/week or 5 days/year) Adult day care ($60/day) Training Supplies (~$500/year)

VA Aid and Attendance (A&A) and Housebound Benefits

Oregon VA Aid and Attendance/Housebound

Age 65+ or disabled veteran/spouse
General OR resident, wartime service, need for ADL help (A&A) or homebound.
Income Limits (2025) Net income < ~$1,984/month (veteran with dependent, A&A); pension offsets income.
Asset Limits ~$155,356 net worth limit
OR

High veteran demand; Oregon Veterans’ Homes option.

Benefits
Cash (~$1,433-$2,642/month veteran, ~$951-$1,318 spouse) for care costs (e.g., in-home, assisted living)

Senior Property Tax Deferral Program

Oregon Property Tax Deferral for Disabled and Senior Citizens

Age 62+
General OR resident, homeowner 5+ years, low-income.
Income Limits (2025) ~$58,000/year household, adjusted annually
Asset Limits Home value < county median; equity > 15%.
OR

Deferred taxes accrue 6% interest; repaid upon sale/death.

Benefits
Tax deferral (~$1,000-$3,000/year avg., varies by county)

Elderly Nutrition Program (ENP)

Oregon Elderly Nutrition Program

Age 60+
General OR resident (or spouse of any age); no income limit.
Income Limits (2025) None; donations encouraged.
Asset Limits Not assessed.
OR

Includes Meals on Wheels; prioritizes homebound/low-income.

Benefits
Home-delivered or congregate meals (~$5-$7/meal value, 5 meals/week avg.)

Frequently Asked Questions about The Rose Schnitzer Manor at Cedar Sinai Park

What neighborhood is The Rose Schnitzer Manor at Cedar Sinai Park in?

The Rose Schnitzer Manor at Cedar Sinai Park is in the Hayhurst neighborhood.

Is The Rose Schnitzer Manor at Cedar Sinai Park in a walkable area?

The Rose Schnitzer Manor at Cedar Sinai Park has a walk score of 33. Somewhat walkable. A few nearby services may be reachable on foot, but most trips require transportation.

What is the occupancy rate at The Rose Schnitzer Manor at Cedar Sinai Park?

The Rose Schnitzer Manor at Cedar Sinai Park's occupancy is 49.0%.

Does The Rose Schnitzer Manor at Cedar Sinai Park operate as a for-profit or non-profit?

The Rose Schnitzer Manor at Cedar Sinai Park is registered as a for-profit.

Are there photos of The Rose Schnitzer Manor at Cedar Sinai Park?

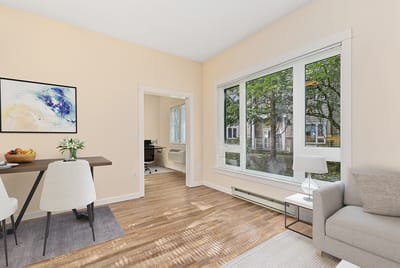
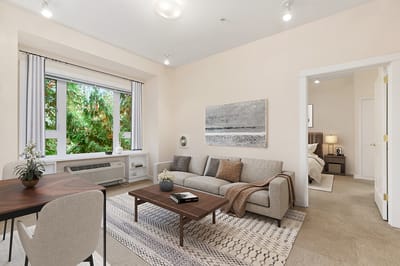
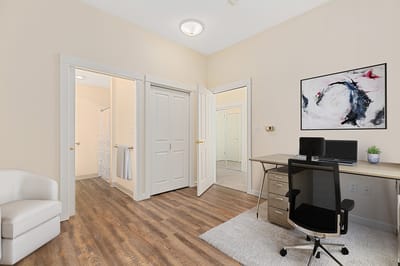
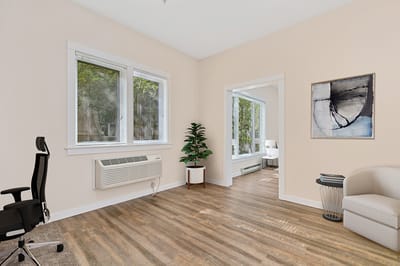
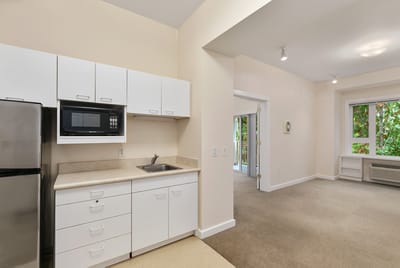
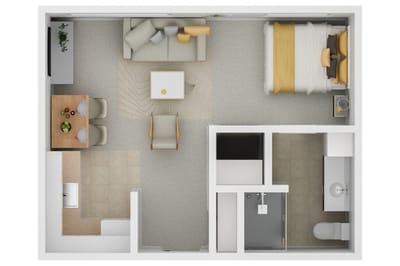
Yes — there are 32 photos of The Rose Schnitzer Manor at Cedar Sinai Park in the photo gallery on this page.

What is the address of The Rose Schnitzer Manor at Cedar Sinai Park?

The Rose Schnitzer Manor at Cedar Sinai Park is located at 6140 Sw Boundary St, Portland, OR 97221.

What is the phone number of The Rose Schnitzer Manor at Cedar Sinai Park?

(503) 535-4300 will put you in contact with the team at The Rose Schnitzer Manor at Cedar Sinai Park.

Guides for Better Senior Living

Care Cost Calculator: See Prices in Your Area

Nursing Home Data Explorer

Don’t Wait Too Long: 7 Red Flag Signs Your Parent Needs Assisted Living Now

The True Cost of Assisted Living in 2025 – And How Families Are Paying For It

Understanding Senior Living Costs: Pricing Models, Discounts & Financial Assistance