The Villas at Saratoga Skilled Nursing & Asst Lvg
Nursing Home & Assisted Living · California, CA
CMS overall rating Info CMS (the Centers for Medicare & Medicaid Services) is the federal agency that rates nursing home quality. Its Overall Rating runs from 1 to 5 stars, combining health inspections, staffing, and quality measures, with inspections weighted most heavily.

The Villas at Saratoga Skilled Nursing & Asst Lvg

Nursing Home & Assisted Living · California, CA
CMS overall rating Info CMS (the Centers for Medicare & Medicaid Services) is the federal agency that rates nursing home quality. Its Overall Rating runs from 1 to 5 stars, combining health inspections, staffing, and quality measures, with inspections weighted most heavily.
Calculator: See prices in your area
The Villas at Saratoga Skilled Nursing & Asst Lvg accepts Medicare, Medicaid, and private pay.

Overview of The Villas at Saratoga Skilled Nursing & Asst Lvg

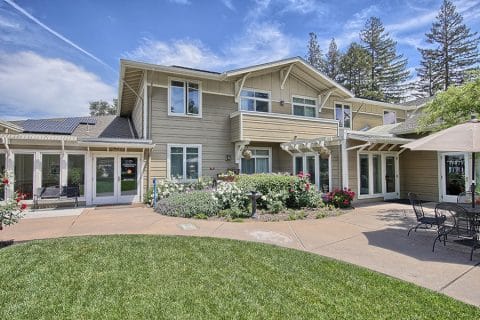
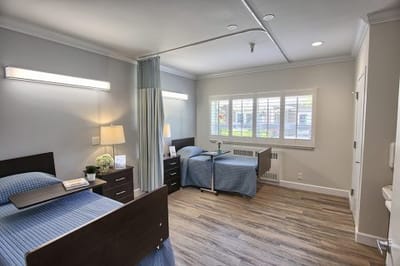
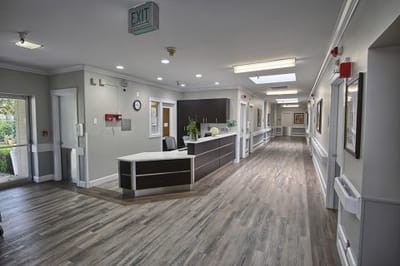
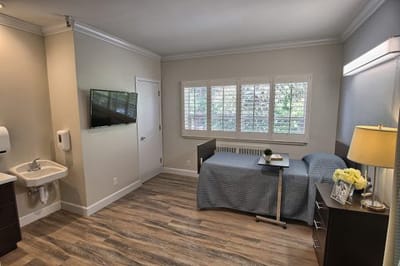
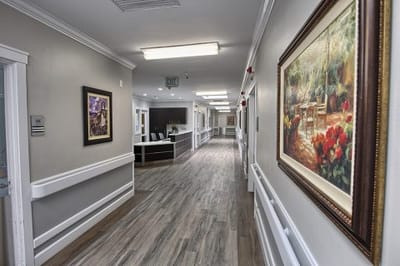
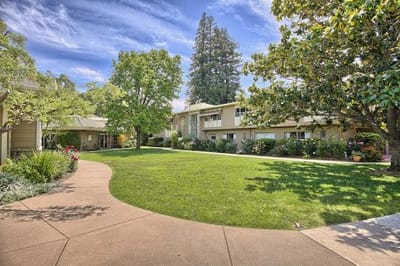
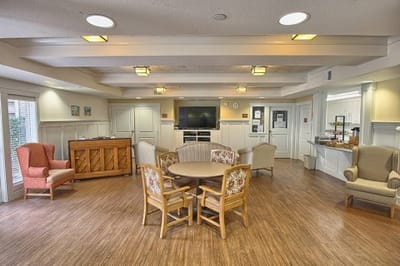
Strands LLC operates The Villas at Saratoga, a 74-bed skilled nursing and assisted living facility located at 20400 Saratoga Los Gatos Road in Saratoga, California. Ryan Williams serves as the administrator for the building, which stays fairly busy with an 86 percent occupancy rate. Stays average just 63 days, demonstrating that the daily workload is geared heavily toward temporary post-hospital therapy and short-term recovery rather than permanent long-term placements.

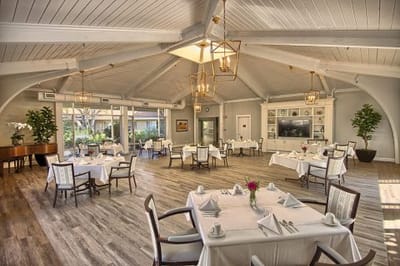
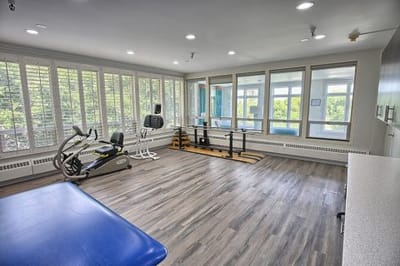
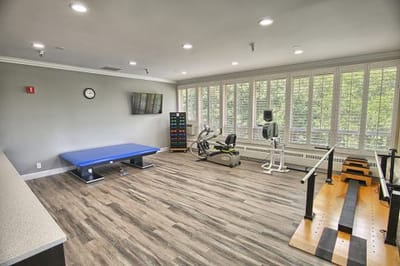
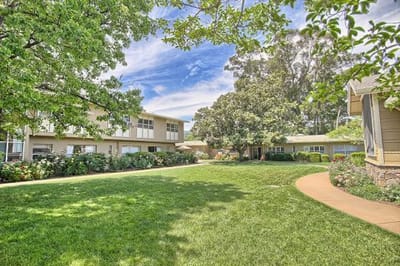
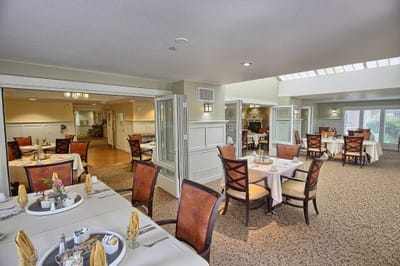
The immediate neighborhood provides moderate walkability, meaning visitors can take care of a few errands on foot but will generally need a vehicle to get around town. Indoors, the nurses and aides log an average of 3 hours and 45 minutes of direct, hands-on care per resident each day. This round-the-clock staff manages structured physical rehabilitation plans and runs a social program that includes exercise classes, book clubs, shopping trips, and an on-site beauty salon.

Government health inspectors track compliance through standard licensing reviews to confirm that the clinical schedules and therapy records align with regional medical codes. Interested individuals can touch base with the front desk to see which floor plans are currently open, ask about the intake timeline, or pick an upcoming weekday to walk through the building and view the rehabilitation setups.

Quality ratings

Measured by Centers for Medicare & Medicaid Services (CMS)

Overall rating Info The Overall CMS Rating combines results from health inspections, staffing levels and quality measures. Health inspections carry the most weight. Staffing and quality scores can increase or decrease the final rating based on performance compared to state and national standards.
▼ 36.5% Below CA avg. ▼ 36.5% Below CA avg.CA average: 3.1Click the badge to see the full State ranking.Click here to see the full State ranking.
Health Inspection Info Based on the results of the facility's three most recent standard inspections and any complaint investigations. CMS reviews the number, scope, and severity of deficiencies, with more recent findings weighted more heavily.
▼ 64.2% Below CA avg. ▼ 64.2% Below CA avg.CA average: 2.8Click the badge to see the full State ranking.Click here to see the full State ranking.
Staffing Info Measures average nursing staff hours per resident per day, including Registered Nurses (RNs) and total nursing staff. Ratings are adjusted based on the level of care residents require and are compared to state and national benchmarks.
▼ 4.4% Below CA avg. ▼ 4.4% Below CA avg.CA average: 3.1Click the badge to see the full State ranking.Click here to see the full State ranking.
Quality Measures Info Based on clinical and physical health indicators reported to CMS, such as hospital readmissions, falls, pressure ulcers, and improvements in mobility. These measures reflect how well residents' health needs are being managed.
▲ 22.4% Above CA avg. ▲ 22.4% Above CA avg.CA average: 4.1Click the badge to see the full State ranking.Click here to see the full State ranking.

Staffing hours breakdown

Info Daily nursing hours per resident by staff type, reported to CMS. Higher is generally better — compare this facility to state and national averages to see where staffing stands.

Hours per resident per day — compared to California state averages

Total nursing care / resident Info This home is ranked 245th out of 354 homes in California for nurse hours. Total adjusted nursing hours per resident per day, combining RN, LPN, and aide time. CMS adjusts this for case-mix so facilities can be fairly compared.
3h 45m per day
Rank #245 / 354Nurse hours — State benchmarkedThis home is ranked 245th out of 354 homes in California. Shows adjusted nurse hours per resident per day benchmarked to the California average, with a ranking across 354 California facilities. More hours mean more direct care. The national average is about 3.5 hrs; below 3.0 is a red flag.Ranking totals vary by category as each rank only includes facilities that report data for that metric. Homes missing that data point aren't included in the ranking.Click the rank badge to see the full State ranking.Click here to see the full State ranking.
This facility California avg (4h 13m per day)
vs California avg
-11%

2 of 6 metrics below state avg

Standout metric Physical Therapist is +118% above state avg
Staff typeHours / Day / Residentvs state avg
Registered Nurse (RN) Info RNs hold the highest nursing license and can assess residents, interpret test results, and direct care plans. More RN hours per day often signals stronger clinical oversight and faster response to health changes. 26m per day ▼ 33% State avg: 39m per day · National avg: 41m per day
LPN / LVN Info Licensed Practical Nurses (LPNs) or Licensed Vocational Nurses (LVNs) deliver routine hands-on care — medication administration, wound dressing, and monitoring vital signs. They work under RN supervision and make up a large share of daily bedside care. 1h 21m per day ▲ 11% State avg: 1h 13m per day · National avg: 52m per day
Nurse Aide Info Certified Nurse Aides (CNAs) provide the most direct day-to-day assistance: bathing, dressing, feeding, and mobility. Nurse aide hours are typically the largest staffing category and directly affect residents' quality of life. 2h 40m per day ■ Avg State avg: 2h 38m per day · National avg: 2h 20m per day
Weekend Total Nursing Info Combined nursing hours (RN + LPN + Nurse Aide) per resident per day on weekends. Staffing often drops on weekends — this figure reveals whether the facility maintains adequate coverage outside of weekday hours. 4h 3m per day ■ Avg State avg: 4h 5m per day · National avg: 3h 26m per day
Physical Therapist Info Hours per resident per day provided by licensed Physical Therapists (PTs) or PT Assistants. PT services help residents recover mobility after injury or illness and are especially important for post-acute (short-stay) rehabilitation. 11m per day ▲ 118% State avg: 5m per day · National avg: 4m per day
Weekend RN Info Registered nurse hours specifically on weekends. Facilities sometimes reduce RN presence on Saturdays and Sundays — a low weekend RN figure compared to weekday hours can indicate reduced clinical oversight when most administrative staff are absent. 21m per day ▼ 31% State avg: 30m per day · National avg: 28m per day

Capacity and availability

Avg. Length of Stay
63 days
Bed community size
74-bed community Rank #968 / 1657Bed count — State benchmarkedThis home is ranked 968th out of 1657 homes in California. Shows this facility's certified or reported bed count compared to other California facilities. Larger communities may offer more amenities, programs, and on-site services for residents and families.Ranking totals vary by category as each rank only includes facilities that report data for that metric. Homes missing that data point aren't included in the ranking.Click the rank badge to see the full State ranking.Click here to see the full State ranking.
A moderately sized community that may balance personal attention with shared amenities and social activities.
Years in operation
6 years in operation Rank #886 / 1487Years in operation — State benchmarkedThis home is ranked 886th out of 1487 homes in California. Shows how long this facility has been in operation compared to other California facilities. Longer operating histories may benefit residents, families, and staff.Ranking totals vary by category as each rank only includes facilities that report data for that metric. Homes missing that data point aren't included in the ranking.Click the rank badge to see the full State ranking.Click here to see the full State ranking.
An established community with some operational experience and growing routines.
Walk Score
Walk Score: 29 / 100 Rank #1735 / 2092Walk Score — State benchmarkedThis home is ranked 1735th out of 2092 homes in California. Shows how walkable this facility's neighborhood is compared to the average Walk Score across California facilities. Higher scores benefit residents, families, and staff.Ranking totals vary by category as each rank only includes facilities that report data for that metric. Homes missing that data point aren't included in the ranking.Click the rank badge to see the full State ranking.Click here to see the full State ranking.
Somewhat walkable. A few nearby services may be reachable on foot, but most trips require transportation.

About this community

Occupancy

Occupancy rate
86%
Rank #437 / 1537Occupancy rate — State benchmarkedThis home is ranked 437th out of 1537 homes in California. Shows this facility's occupancy rate versus the California average, with its Statewide rank out of 1537. Higher occupancy signals strong local demand and financial stability.Ranking totals vary by category as each rank only includes facilities that report data for that metric. Homes missing that data point aren't included in the ranking.Click the rank badge to see the full State ranking.Click here to see the full State ranking.
Higher than the California average: 72.8%
Occupied beds
64 / 74
Average occupied beds in California homes 87 beds

License Details

Facility TypeResidential Care Elderly
StatusLicensed
IssuanceSeptember 10, 2019
CountySanta Clara
CMS Certification Number055435

Ownership & Operating Entity

The Villas at Saratoga Skilled Nursing & Asst Lvg is legally operated by Strands Llc, and administrated by Ryan Williams.

Owner NameStrands LLC

Therapy & Rehabilitation

1 service
Rehabilitation Services

Staffing & Medical

1 service
24-Hour Staffing

Amenities & Lifestyle

Beauty Salon
Exercise Classes
Shopping Trips
Book Clubs
Operating HoursMonday – Sunday: 8:30am-5:00pm; Facility Open 24/7 through parking lot gate access.

Contact The Villas at Saratoga Skilled Nursing & Asst Lvg

Inspection History

In California, the Department of Social Services (for assisted living facilities) and the Department of Public Health (for nursing homes) conduct inspections to ensure resident safety and regulatory compliance.

Inspection Score Info A composite 0–100 score combining this facility's inspections, citations, complaints, and enforcement actions relative to the California state average. The score below shows how many points this facility sits above or below the typical California nursing home score (the benchmark); higher is better.

1 point below the California average for nursing homes (81/100)

Rank #853 / 1401 in California Inspection Score — State benchmarked This home is ranked 853rd out of 1401 homes in California. Shows this facility's inspection score compared to the California average among 1401 comparable communities in the ranking pool. Ranking totals vary by category as each rank only includes facilities that report data for that metric. Homes missing that data point aren't included in the ranking. Inspection score: 80 out of 100. Letter grade B-. 1 point below the California average for nursing homes (81/100)

Inspection Scorecard Info This scorecard compares key inspection, citation, and complaint metrics at this facility against the California state average. Metrics rated ≥15% worse than average are highlighted in red; those ≥15% better are highlighted in green.

Since 2020 vs. California state average
Overall vs. CA average 3 Worse Metrics worse than California average:
• Total visits (44% above)
• Complaint visits (8% above)
• Official inspections (25% above)
2 At Avg Metrics at California average:
• Total complaints (at CA avg)
• Complaints per year (at CA avg)
4 Better Metrics better than California average:
• Total citations (40% below)
• Citations per year (41% below)
• Citations per inspection (91% below)
• Other visits (43% below)
Latest Inspection May 1, 2026

Citations Info Citations are formal regulatory issues recorded during state inspections.

This FacilityCA Averagevs. CA Avg
Total citations Info Formal regulatory issues recorded by inspectors across all inspection types. 610 This facility has 40% fewer total citations than a typical California nursing home (6 vs. CA avg 10).↓ 40% better
Citations per year Info Average citations per year since 2020. 11.7 This facility has 41% fewer citations per year than a typical California nursing home (1 vs. CA avg 1.7).↓ 41% better
Citations per inspection Info Average citations per inspection. 0.33.3 This facility has 91% fewer citations per inspection than a typical California nursing home (0.3 vs. CA avg 3.3).↓ 91% better

Inspections & Visits Info State inspections evaluate whether the facility meets health and safety standards.

This FacilityCA Averagevs. CA Avg
Total visits Info Combined count of complaint visits, other regulatory visits, and official scheduled inspections. 2316 This facility has 44% more total visits than a typical California nursing home (23 vs. CA avg 16).↑ 44% worse
Complaint visits Info On-site visits triggered by formal complaints filed by residents, families, or staff. 1413 This facility has 8% more complaint visits than a typical California nursing home (14 vs. CA avg 13).↑ 8% worse Rank #995 / 1397 Complaint visits — State benchmarked This home is ranked 995th out of 1397 homes in California. Shows this facility's # of complaint visits compared to the California average among 1397 comparable communities in the ranking pool. Ranking totals vary by category as each rank only includes facilities that report data for that metric. Homes missing that data point aren't included in the ranking.
Other visits Info Regulatory visits that are neither routine inspections nor complaint investigations — administrative check-ins, follow-up reviews, licensing-related visits. 47 This facility has 43% fewer other visits than a typical California nursing home (4 vs. CA avg 7).↓ 43% better
Official inspections Info Routine, scheduled inspections conducted by state regulators to evaluate whether the facility meets federal and state standards. 54 This facility has 25% more official inspections than a typical California nursing home (5 vs. CA avg 4).↑ 25% worse

Complaints & Investigations Info Complaints are formal concerns filed by residents, families, or staff. Investigations are on-site follow-ups.

This FacilityCA Averagevs. CA Avg
Total complaints Info Formal expressions of concern made by residents, families, or staff. 1414 This facility has total complaints in line with the California average (14 vs. CA avg 14).— At avg
Complaints per year Info Average complaints per year since 2020. 2.32.3 This facility has complaints per year in line with the California average (2.3 vs. CA avg 2.3).— At avg

Health Inspection History

Inspections since 2020
Total health inspections 6

California average 12.5


Last Health inspection on Aug 2025

Total health citations
50 Rank #226 / 361Health citations — State benchmarkedThis home is ranked 226th out of 361 homes in California. Shows this facility's total health deficiency citations benchmarked to the California State average, with a ranking across all 361 CA facilities. Lower citation counts earn a better rank.Ranking totals vary by category as each rank only includes facilities that report data for that metric. Homes missing that data point aren't included in the ranking.Click the rank badge to see the full State ranking.Click here to see the full State ranking.

California average 50.2

Citations per inspection
8.33 Rank #343 / 361Citations per inspection — State benchmarkedThis home is ranked 343rd out of 361 homes in California. Shows average deficiency citations per CMS inspection for this facility versus the California mean across 361 facilities with citation data. Lower is better.Ranking totals vary by category as each rank only includes facilities that report data for that metric. Homes missing that data point aren't included in the ranking.Click the rank badge to see the full State ranking.Click here to see the full State ranking.

California average 4.65


Health citations are formal notices following inspections when they fail to comply with safety and care standards.

46 of 50 citations resulted from standard inspections; and 4 of 50 resulted from complaint investigations.

Breakdown of citation severity (last 6 years)
Critical health citations
0
100% better than California average

California average: 0.4


Serious health citations
1
In line with California average

California average: 1

0 critical citations California average: 0.4

1 serious citation California average: 1

46 moderate citations California average: 47.2

3 minor citations California average: 1.5
Citations history (last 6 years)
Quality of Care moderate citation Aug 20, 2025
Corrected

Abuse/Neglect moderate citation Aug 12, 2025
Corrected

Quality of Care moderate citation Aug 12, 2025
Corrected

Environmental moderate citation Dec 20, 2024
Corrected

Staffing Data

Reporting period: October 1 – December 31, 2025 (Q4 2025). Source: CMS Payroll-Based Journal report.

Total staff 119
Employees 117
Contractors 2
Staff to resident ratio 1.42 : 1
22% fewer staff per resident than California average
California average ratio: 1.81 : 1 California average ratio: 1.81 : 1See full California ranking
Avg staff/day 61
Average shift 7.3 hours
5% worse than California average
California average: 7.7 hours California average shift: 7.7 hoursSee full California ranking
Total staff hours (quarter) 40,704

Nursing staff breakdown

Q4 2025 · Oct 1 – Dec 31 More info This data comes from the CMS Payroll-Based Journal report covering October 1 – December 31, 2025.
Registered Nurse

Manages medical care and health needs.

RN Staff Info All 9 RN Staff are full-time employees. No contractors work on this role. 9
Average shift length Info Average shift length. Calculated as total hours divided by days worked and average staff per day. 7 hours
Licensed Practical Nurse

Assists with medical care and medications.

LPN Staff Info All 23 LPN Staff are full-time employees. No contractors work on this role. 23
Average shift length Info Average shift length. Calculated as total hours divided by days worked and average staff per day. 7.4 hours
Certified Nursing Assistant

Helps with daily care and mobility.

CNA Staff Info All 59 CNA Staff are full-time employees. No contractors work on this role. 59
Average shift length Info Average shift length. Calculated as total hours divided by days worked and average staff per day. 7.3 hours

Contractor staffing

Q4 2025 · Oct 1 – Dec 31 More info This data comes from the CMS Payroll-Based Journal report covering October 1 – December 31, 2025.

Total hours from contractors

0.4%

171 contractor hours this quarter

Occupational Therapy Assistant: 1 Medical Director: 1

Staff by category

Q4 2025 · Oct 1 – Dec 31 More info This data comes from the CMS Payroll-Based Journal report covering October 1 – December 31, 2025.
Certified Nursing Assistant5905919,72092100%7.3
Licensed Practical Nurse230238,03892100%7.4
Registered Nurse9092,71892100%7
RN Director of Nursing4041,9376672%7.8
Physical Therapy Assistant5051,56492100%7.7
Other Dietary Services Staff5051,5228795%8.1
Respiratory Therapy Technician3031,3386874%7.4
Speech Language Pathologist3038186368%7.4
Administrator1015286672%8
Nurse Practitioner1015206571%8
Dental Services Staff1015126470%8
Mental Health Service Worker1015046368%8
Occupational Therapy Aide1014106368%6.5
Qualified Social Worker1014045964%6.8
Occupational Therapy Assistant01115692100%1.7
Medical Director011151516%1
59 Certified Nursing Assistant
% of Days 100%
23 Licensed Practical Nurse
% of Days 100%
9 Registered Nurse
% of Days 100%
4 RN Director of Nursing
% of Days 72%
5 Physical Therapy Assistant
% of Days 100%
5 Other Dietary Services Staff
% of Days 95%
3 Respiratory Therapy Technician
% of Days 74%
3 Speech Language Pathologist
% of Days 68%
1 Administrator
% of Days 72%
1 Nurse Practitioner
% of Days 71%
1 Dental Services Staff
% of Days 70%
1 Mental Health Service Worker
% of Days 68%
1 Occupational Therapy Aide
% of Days 68%
1 Qualified Social Worker
% of Days 64%
1 Occupational Therapy Assistant
% of Days 100%
1 Medical Director
% of Days 16%

Penalties and fines

Includes penalties issued in 2024

Federal penalties imposed by CMS for regulatory violations, including civil money penalties (fines) and denials of payment for new Medicare/Medicaid admissions.

Source: CMS Penalties Database (Data as of Jan 2026)

Total fines amount $8K Rank #299 / 362Federal fines — State benchmarkedThis home is ranked 299th out of 362 homes in California. Shows this facility's cumulative CMS federal fine dollars versus the California average among facilities with fines, and where it ranks among 362 facilities in the pool. Lower total dollars mean a better rank.Ranking totals vary by category as each rank only includes facilities that report data for that metric. Homes missing that data point aren't included in the ranking.Click the rank badge to see the full State ranking.Click here to see the full State ranking.
85% lower than California average

California average: $55K

Number of fines 1
58% fewer fines than California average

California average: 2.4

Payment Denials Info Serious action where Medicare and/or Medicaid temporarily stops payments for new residents until issues are fixed. 0
100% fewer payment denials than California average

California average: 0.5

Fines amount comparison
This facility $8K
California average $55K
Penalty History

Penalties are imposed by CMS for violations of federal nursing home regulations.

1 penalty in the past 3 years

Aug 22, 2024 · $8K

Civil Money Penalty Info Fines imposed for noncompliance, which can be assessed per day or per instance of violation. Aug 22, 2024
$8K

Last updated: Jan 2026

Quality of care over time

These measures show how residents usually do over time at this home, based on health outcomes and preventive care.

High-risk clinical events score Info A composite score based on pressure ulcers, falls with injury, weight loss, walking ability decline, and activities of daily living decline. 6.4
In line with California average

California average: 6.6

Functional decline score Info A composite score based on activities of daily living decline, walking ability decline, and incontinence. 14.6
29% worse than California average

California average: 11.3

Long-stay resident measures
Significantly above average California avg: 4.2 Info CMS star rating based on long-stay quality measure performance. 5 stars = significantly above average, 1 star = significantly below average.
Need for Help with Daily Activities Increased Info Percent of long-stay residents whose need for help with daily activities has increased 9.5%
14% better than California average

California average: 11.1%

Walking Ability Worsened Info Percent of long-stay residents whose ability to move independently worsened 12.0%
In line with California average

California average: 12.0%

Low Risk Residents with Bowel/Bladder Incontinence Info Percent of low risk long-stay residents who lose control of their bowels or bladder 22.4%
98% worse than California average

California average: 11.3%

Falls with Major Injury Info Percent of long-stay residents experiencing one or more falls with major injury 0.4%
74% better than California average

California average: 1.7%

High Risk Residents with Pressure Ulcers Info Percent of long-stay high risk residents with pressure ulcers 4.8%
In line with California average

California average: 5.0%

Urinary Tract Infection Info Percent of long-stay residents with a urinary tract infection 0.0%
100% better than California average

California average: 1.2%

Lost Too Much Weight Info Percent of long-stay residents who lose too much weight 5.2%
22% worse than California average

California average: 4.2%

Depressive Symptoms Info Percent of long-stay residents who have depressive symptoms 5.9%
11% better than California average

California average: 6.7%

Antipsychotic Use Info Percent of long-stay residents who received an antipsychotic medication 12.2%
21% worse than California average

California average: 10.1%

Pneumococcal Vaccine Info Percent of long-stay residents assessed and appropriately given the pneumococcal vaccine 100.0%
In line with California average

California average: 98.5%

Influenza Vaccine Info Percent of long-stay residents assessed and appropriately given the seasonal influenza vaccine 100.0%
In line with California average

California average: 98.2%

Hospitalizations per 1,000 days Info Number of hospitalizations per 1,000 long-stay resident days. 1.76
22% better than California average

California average: 2.25

ED visits per 1,000 days Info Number of outpatient emergency department visits per 1,000 long-stay resident days. 2.11
33% worse than California average

California average: 1.59

Short-stay resident measures
Above average California avg: 3.5 Info CMS star rating based on short-stay quality measure performance. 5 stars = much above average, 1 star = much below average.
Pneumococcal Vaccine Info Percent of short-stay residents assessed and appropriately given the pneumococcal vaccine 99.6%
6% better than California average

California average: 94.0%

Antipsychotic medication increase Info Percent of short-stay residents who newly received an antipsychotic medication 1.4%
6% better than California average

California average: 1.5%

Influenza Vaccine Info Percent of short-stay residents assessed and appropriately given the seasonal influenza vaccine 99.5%
7% better than California average

California average: 93.2%

Re-hospitalized after SNF stay Info Percentage of short-stay residents who were re-hospitalized after their nursing home admission. 22.7%
In line with California average

California average: 23.2%

Emergency department visits Info Percentage of short-stay residents who had an outpatient emergency department visit. 9.6%
14% better than California average

California average: 11.2%

Falls with major injury Info Percentage of SNF residents who experience falls with major injury during their stay. 0.4%
53% better than California average

California average: 0.8%

Ability to care for self at discharge Info Percentage of residents at or above expected ability to care for themselves at discharge. 53.3%
In line with California average

California average: 53.7%

Successful return to home or community Info Rate of successful return to home or community from a skilled nursing facility. 62.1%
23% better than California average

California average: 50.6%

Breakdown by payment type

Medicare

72% of new residents, usually for short-term rehab.

Typical stay 26 days

Private pay

26% of new residents, often for short stays.

Typical stay 1 - 2 months

Medicaid

2% of new residents, often for long-term daily care.

Typical stay 4 - 5 years

Facility Characteristics

Source: CMS Long-Term Care Facility Characteristics (Data as of Jan 2026)

Total residents 84
Medicare
34
40.5% of residents
Medicaid
48
57.1% of residents
Private pay or other
2
2.4% of residents
Programs & Services
Residents Group

Residents meet regularly to discuss policies, care quality, and activities

Active Resident Council

Organized group of residents that meets regularly to discuss facility policies, quality of life, and activities.

Finances and operations

Based on CMS SNF Cost Report for fiscal year ending in 12/2023.

Privately-owned community
Operated by a single business entity.
Net patient revenue Info Net patient revenue — what the home actually collects for resident care, after contractual allowances, bad debt and discounts are subtracted from its gross charges (CMS cost report, Worksheet G-3). It covers resident care only; money the home earns from other sources is shown separately as "Other income."
$19.7M
Net patient income Info Net patient income: net patient revenue minus the home's total operating expenses. A positive figure means it earns more from resident care than it spends to deliver it; a negative figure means the opposite. It excludes non-operating "other income."
$2.0M
Privately-owned community Operated by a single business entity.
Net patient revenue Info Net patient revenue — what the home actually collects for resident care, after contractual allowances, bad debt and discounts are subtracted from its gross charges (CMS cost report, Worksheet G-3). It covers resident care only; money the home earns from other sources is shown separately as "Other income."
$19.7M Rank #155 / 355Revenue — State benchmarkedThis home is ranked 155th out of 355 homes in California. Shows this facility's annual revenue compared to the California average. Higher revenue generally means more resources for staffing and capital — read alongside Payroll %.Ranking totals vary by category as each rank only includes facilities that report data for that metric. Homes missing that data point aren't included in the ranking.Click the rank badge to see the full State ranking.Click here to see the full State ranking.
Net patient income Info Net patient income: net patient revenue minus the home's total operating expenses. A positive figure means it earns more from resident care than it spends to deliver it; a negative figure means the opposite. It excludes non-operating "other income."
$2.0M
Other income Info Money the home earns outside of resident care — such as investments, grants, rentals and other non-operating sources (CMS cost report, Worksheet G-3). It is tracked separately from net patient revenue: it is not part of that figure, and it is not included in net patient income.
$165.8K
Payroll costs Info Staff salaries plus wage-related costs — benefits such as payroll taxes, health insurance and retirement — from the home's own accounting records (CMS cost report, Worksheet A). Contract or agency labor is counted separately, under other operating costs. Rank #107 / 355Payroll — State benchmarkedThis home is ranked 107th out of 355 homes in California. Shows total annual staff payroll benchmarked to the California average. Higher payroll investment relative to peers often signals better staffing and less reliance on cheaper contract labor.Ranking totals vary by category as each rank only includes facilities that report data for that metric. Homes missing that data point aren't included in the ranking.Click the rank badge to see the full State ranking.Click here to see the full State ranking.
$10.6M 54.1% of net patient revenue Info Payroll as a share of revenue: staff salaries and wage-related benefits divided by net patient revenue. A higher figure means more of each revenue dollar goes to staff pay. Rank #97 / 355Payroll % — State benchmarkedThis home is ranked 97th out of 355 homes in California. Shows payroll as a percentage of revenue versus the California average. Well-run California facilities typically land around 56–67% — the top third Statewide. Below 25% may signal understaffing or heavy agency use — read with Staffing ratings.Ranking totals vary by category as each rank only includes facilities that report data for that metric. Homes missing that data point aren't included in the ranking.Click the rank badge to see the full State ranking.Click here to see the full State ranking.
Other operating costs Info Everything it costs to run the home apart from payroll — food, utilities, supplies, maintenance, contract labor and administration. Calculated as total operating expense minus payroll (staff salaries and wage-related benefits).
$7.0M
Total costs Info The home's total operating expense for the year — all the costs of running it, salaries included (CMS cost report, Worksheet G-3).
$17.7M

Who this home usually serves

TYPE OF STAY

Mostly short-term rehab stays

Most residents typically stay for a few weeks or months before returning home or moving on.

Most new residents arrive under Medicare (72% of admissions), and a typical Medicare stay runs around 26 days.

Admissions
488 total

Coverage residents most often arrive under.

Medicare 72%
Private pay 26%
Medicaid 2%
Discharges
496 total

Coverage residents most often leave under.

Medicare 64%
Private pay 21%
Medicaid 15%

Places of interest near The Villas at Saratoga Skilled Nursing & Asst Lvg

Address 0.6 miles from city center Info Estimated distance in miles from Saratoga's city center to The Villas at Saratoga Skilled Nursing & Asst Lvg's address, calculated via Google Maps.

Calculate Travel Distance to The Villas at Saratoga Skilled Nursing & Asst Lvg

Add your location

Address

Compare Nursing Home around California

The information below is reported by the California Department of Social Services and Department of Public Health.

5 facilities compared · CMS & CA Dept. of Health data

OakView Health Center
NH
AL
MC
Thousand Oaks (Mountclef Village)
63
Facility 63
CA AVG 103
Rank #1063 / 1657
79.4%
Facility 79.4%
CA AVG 84.7%
Rank #702 / 1537
-6%
5.21
Facility 5.21
CA AVG 4.22
Rank #31 / 354
-69%+24%
$0
Facility $0
CA AVG $56.5k
Rank #1 / 362
89
Facility 89
CA AVG 81
Rank #461 / 1401
9
Facility 9
CA AVG 50.2
Rank #4 / 361
1.5
Facility 1.5
CA AVG 4.6
Rank #2 / 361
-43A+
20
Facility 20
CA AVG 57
Rank #1846 / 2092
Bouchard Family Revocable Trust
$14.8M
Facility $14.8M
CA AVG $17.0M
Rank #210 / 355
$8.4M
Facility $8.4M
CA AVG $7.0M
Rank #164 / 355
56.8%
Facility 56.8%
CA AVG 45.2%
Rank #82 / 355
555857
The Reutlinger Community
NH
AL
IL
MC
Danville
120
Facility 120
CA AVG 103
Rank #561 / 1657
65.0%
Facility 65.0%
CA AVG 84.7%
Rank #1121 / 1537
-23%
5.32
Facility 5.32
CA AVG 4.22
Rank #27 / 354
-17%+26%
$0
Facility $0
CA AVG $56.5k
Rank #1 / 362
86
Facility 86
CA AVG 81
Rank #630 / 1401
17
Facility 17
CA AVG 50.2
Rank #26 / 361
3.4
Facility 3.4
CA AVG 4.6
Rank #107 / 361
-78A+
30
Facility 30
CA AVG 57
Rank #1720 / 2092
The Reutlinger Community
$21.7M
Facility $21.7M
CA AVG $17.0M
Rank #123 / 355
$11.8M
Facility $11.8M
CA AVG $7.0M
Rank #45 / 355
54.6%
Facility 54.6%
CA AVG 45.2%
Rank #48 / 355
55534
Bayshire Carlsbad
NH
AL
IL
MC
Carlsbad (Palamai)
125
Facility 125
CA AVG 103
Rank #526 / 1657
93.6%
Facility 93.6%
CA AVG 84.7%
Rank #225 / 1537
+11%
3.24
Facility 3.24
CA AVG 4.22
Rank #336 / 354
+54%-23%
$0
Facility $0
CA AVG $56.5k
Rank #1 / 362
79
Facility 79
CA AVG 81
Rank #881 / 1401
26
Facility 26
CA AVG 50.2
Rank #86 / 361
4.3
Facility 4.3
CA AVG 4.6
Rank #196 / 361
-117A+
59
Facility 59
CA AVG 57
Rank #1088 / 2092
Skilled Camino LLC
$12.9M
Facility $12.9M
CA AVG $17.0M
Rank #263 / 355
$5.1M
Facility $5.1M
CA AVG $7.0M
Rank #285 / 355
39.7%
Facility 39.7%
CA AVG 45.2%
Rank #201 / 355
555745
Heritage Gardens
NH
AL
IL
MC
Loma Linda
64
Facility 64
CA AVG 103
Rank #1051 / 1657
85.9%
Facility 85.9%
CA AVG 84.7%
Rank #437 / 1537
+1%
4.44
Facility 4.44
CA AVG 4.22
Rank #105 / 354
-14%+5%
$0
Facility $0
CA AVG $56.5k
Rank #1 / 362
71
Facility 71
CA AVG 81
Rank #1079 / 1401
45
Facility 45
CA AVG 50.2
Rank #204 / 361
3.8
Facility 3.8
CA AVG 4.6
Rank #152 / 361
155A+
47
Facility 47
CA AVG 57
Rank #1422 / 2092
Cotton Family Revocable Trust
$12.3M
Facility $12.3M
CA AVG $17.0M
Rank #241 / 355
$6.3M
Facility $6.3M
CA AVG $7.0M
Rank #235 / 355
51%
Facility 51%
CA AVG 45.2%
Rank #150 / 355
55183
The Villas at Saratoga Skilled Nursing & Asst Lvg
NH
AL
Saratoga
74
Facility 74
CA AVG 103
Rank #968 / 1657
85.9%
Facility 85.9%
CA AVG 84.7%
Rank #437 / 1537
+1%
3.75
Facility 3.75
CA AVG 4.22
Rank #245 / 354
-15%-11%
$40.3k
Facility $40.3k
CA AVG $56.5k
Rank #299 / 362
80
Facility 80
CA AVG 81
Rank #853 / 1401
50
Facility 50
CA AVG 50.2
Rank #226 / 361
8.3
Facility 8.3
CA AVG 4.6
Rank #343 / 361
180-
29
Facility 29
CA AVG 57
Rank #1735 / 2092
Strands LLC
$19.7M
Facility $19.7M
CA AVG $17.0M
Rank #155 / 355
$10.6M
Facility $10.6M
CA AVG $7.0M
Rank #107 / 355
54.1%
Facility 54.1%
CA AVG 45.2%
Rank #97 / 355
55435

Financial Assistance for
Nursing Home in California

The Villas at Saratoga Skilled Nursing & Asst Lvg is located in SARATOGA, California.
Here are the financial assistance programs available to residents in California.

Get Financial aid guidance

Multipurpose Senior Services Program

MSSP (Medi-Cal Waiver)

Age 65+
General California resident, Medi-Cal eligible, nursing home risk.
Income Limits (2025) ~$2,829/month 300% FBR, individual
Asset Limits $2,000 (individual), $3,000 (couple).
CA

County-managed; waitlists possible.

Benefits
In-home support (4-6 hours/day) Respite care (14 days/year) Meals (~$6/meal) Transportation (8 trips/month) Care management

In-Home Supportive Services (IHSS)

California IHSS

Age 65+
General California resident, Medicaid-eligible or low-income.
Income Limits ~$1,732/month individual, Medi-Cal threshold
Asset Limits $2,000 individual
CA

Can hire family as caregivers.

Benefits
Personal care (up to 283 hours/month) Homemaker services Respite (varies)

Multipurpose Senior Services Program (MSSP)

CA MSSP

Age 65+
General California resident, Medi-Cal-eligible, nursing home-eligible but community-capable.
Income Limits ~$2,829/month 300% FBR, individual
Asset Limits $2,000 individual
CA

Available in 38 counties; waitlists common.

Benefits
Case management Respite care (up to 10 days/year) Minor home mods (avg. $500) Adult day care (~$50/day)

Property Tax Postponement Program (PTP)

CA PTP

Age 62+
General California resident, own and live in home, 40% equity.
Income Limits (2025) ~$51,500/year household, adjusted annually
Asset Limits Equity-based; no strict asset cap.
CA

Deferred taxes accrue interest (5% as of 2024); repaid upon sale/death.

Benefits
Property tax deferral (avg. $1,000-$3,000/year, varies by county)

Assisted Living Waiver (ALW)

CA ALW

Age 65+ or disabled
General California resident, Medi-Cal-eligible, nursing home-eligible.
Income Limits ~$2,829/month 300% FBR, individual
Asset Limits $2,000 individual
CA

Available in 15 counties (e.g., LA, Sacramento); waitlists common.

Benefits
Personal care in ALFs (5-7 hours/day) Medication management Social services

California CARES Program

CA CARES

Age
General Caregivers of California residents 60+ needing help with 3+ daily activities; no caregiver age limit.
Income Limits No strict limit; cost-sharing above ~$2,500/month threshold.
Asset Limits Not applicable; need-based.
CA

High demand in urban areas; complements IHSS respite.

Benefits
Respite care (up to 10 days/year) Counseling (4-6 sessions/year) Training (2-3 workshops/year) Supplies (~$200/year)

Frequently Asked Questions about The Villas at Saratoga Skilled Nursing & Asst Lvg

Who is the owner of The Villas at Saratoga Skilled Nursing & Asst Lvg?

The legal owner and operator of The Villas at Saratoga Skilled Nursing & Asst Lvg is Strands Llc.

Is The Villas at Saratoga Skilled Nursing & Asst Lvg in a walkable area?

The Villas at Saratoga Skilled Nursing & Asst Lvg has a walk score of 29. Somewhat walkable. A few nearby services may be reachable on foot, but most trips require transportation.

What is the occupancy rate at The Villas at Saratoga Skilled Nursing & Asst Lvg?

The Villas at Saratoga Skilled Nursing & Asst Lvg's occupancy is 86%.

Who is the administrator of The Villas at Saratoga Skilled Nursing & Asst Lvg?

Ryan Williams is the administrator of The Villas at Saratoga Skilled Nursing & Asst Lvg.

How many beds does The Villas at Saratoga Skilled Nursing & Asst Lvg have?

The Villas at Saratoga Skilled Nursing & Asst Lvg has 74 beds.

Has The Villas at Saratoga Skilled Nursing & Asst Lvg had any recent deficiencies or citations?

The Villas at Saratoga Skilled Nursing & Asst Lvg has had 6 recently reported deficiencies.

Are there photos of The Villas at Saratoga Skilled Nursing & Asst Lvg?

Yes — there are 19 photos of The Villas at Saratoga Skilled Nursing & Asst Lvg in the photo gallery on this page.

Guides for Better Senior Living

Care Cost Calculator: See Prices in Your Area

Nursing Home Data Explorer

Don’t Wait Too Long: 7 Red Flag Signs Your Parent Needs Assisted Living Now

The True Cost of Assisted Living in 2025 – And How Families Are Paying For It

Understanding Senior Living Costs: Pricing Models, Discounts & Financial Assistance