

Hospitalizations per 1,000 days
 Number of hospitalizations per 1,000 long-stay resident days.
0.94
Number of hospitalizations per 1,000 long-stay resident days.
0.94
Texas average: 2.13

We arrange tours, appointments, and even moving support so you don’t have to
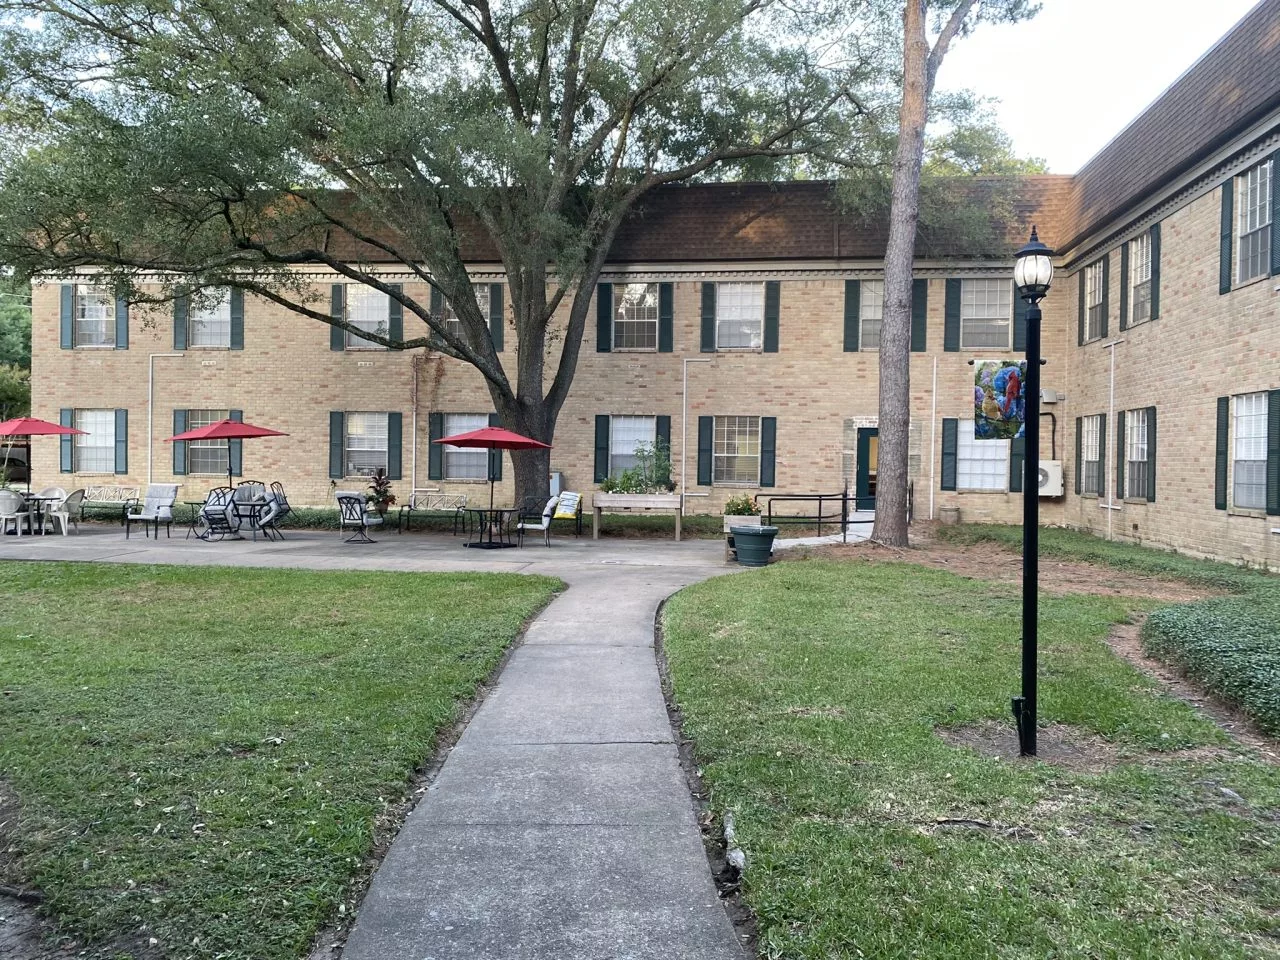
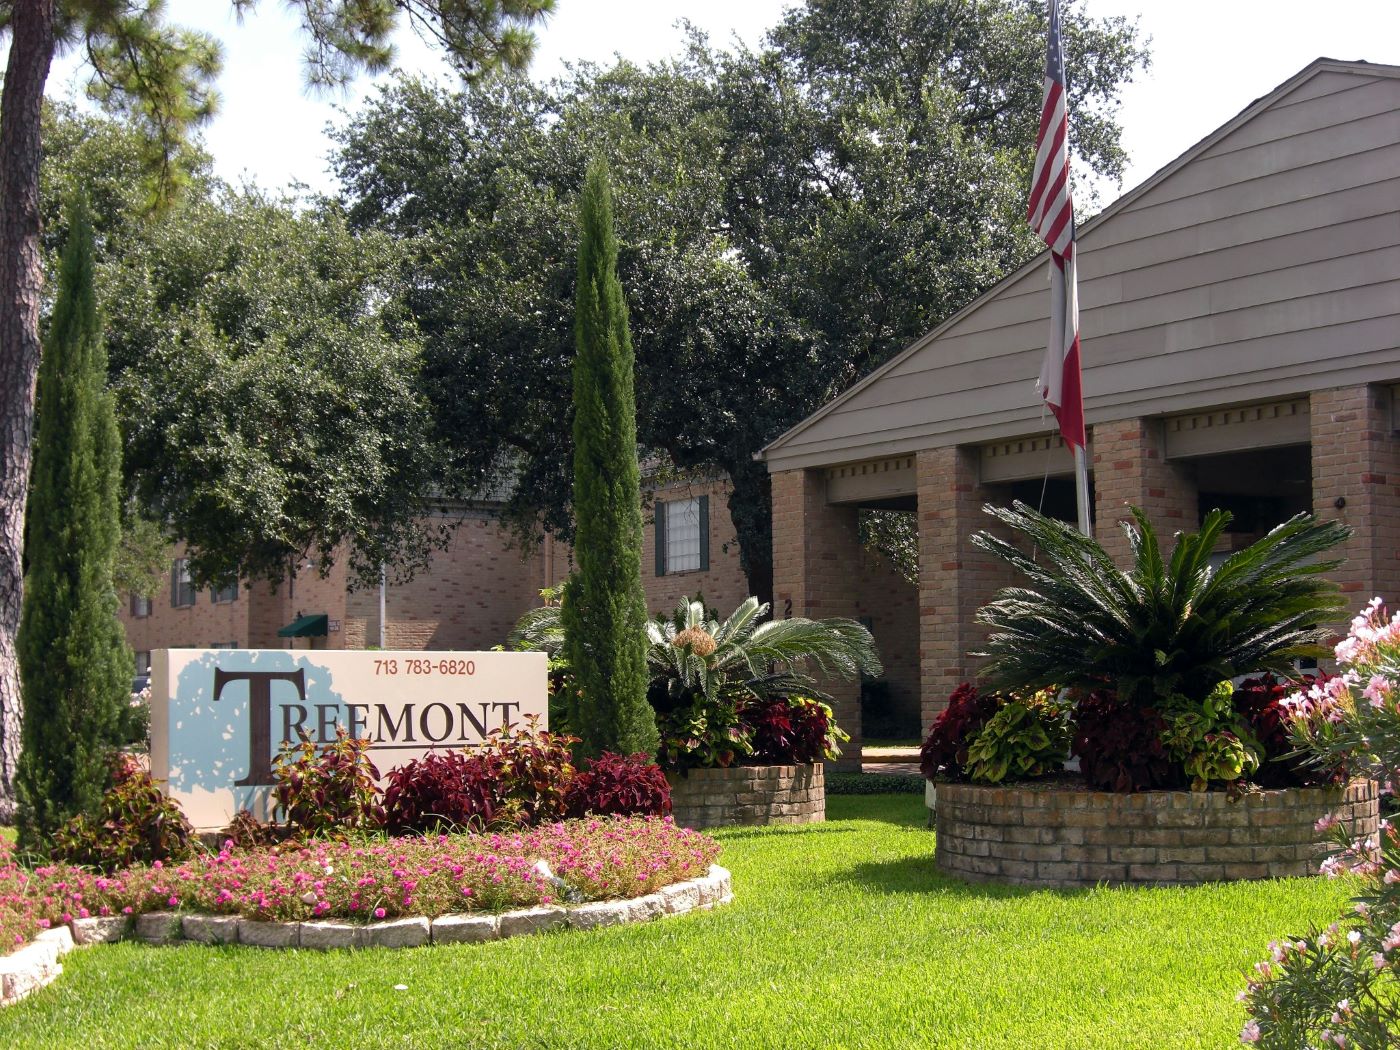
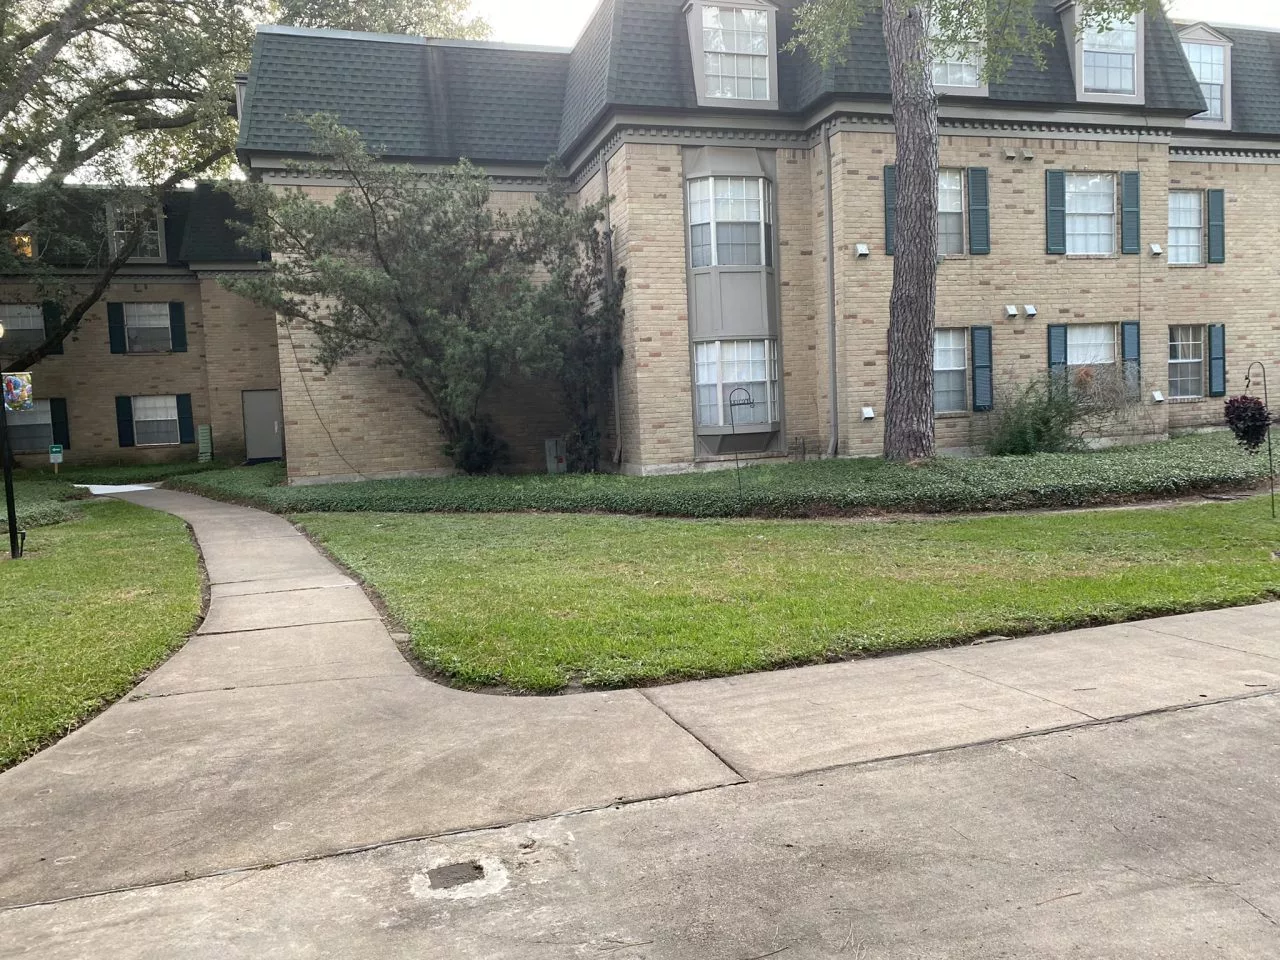
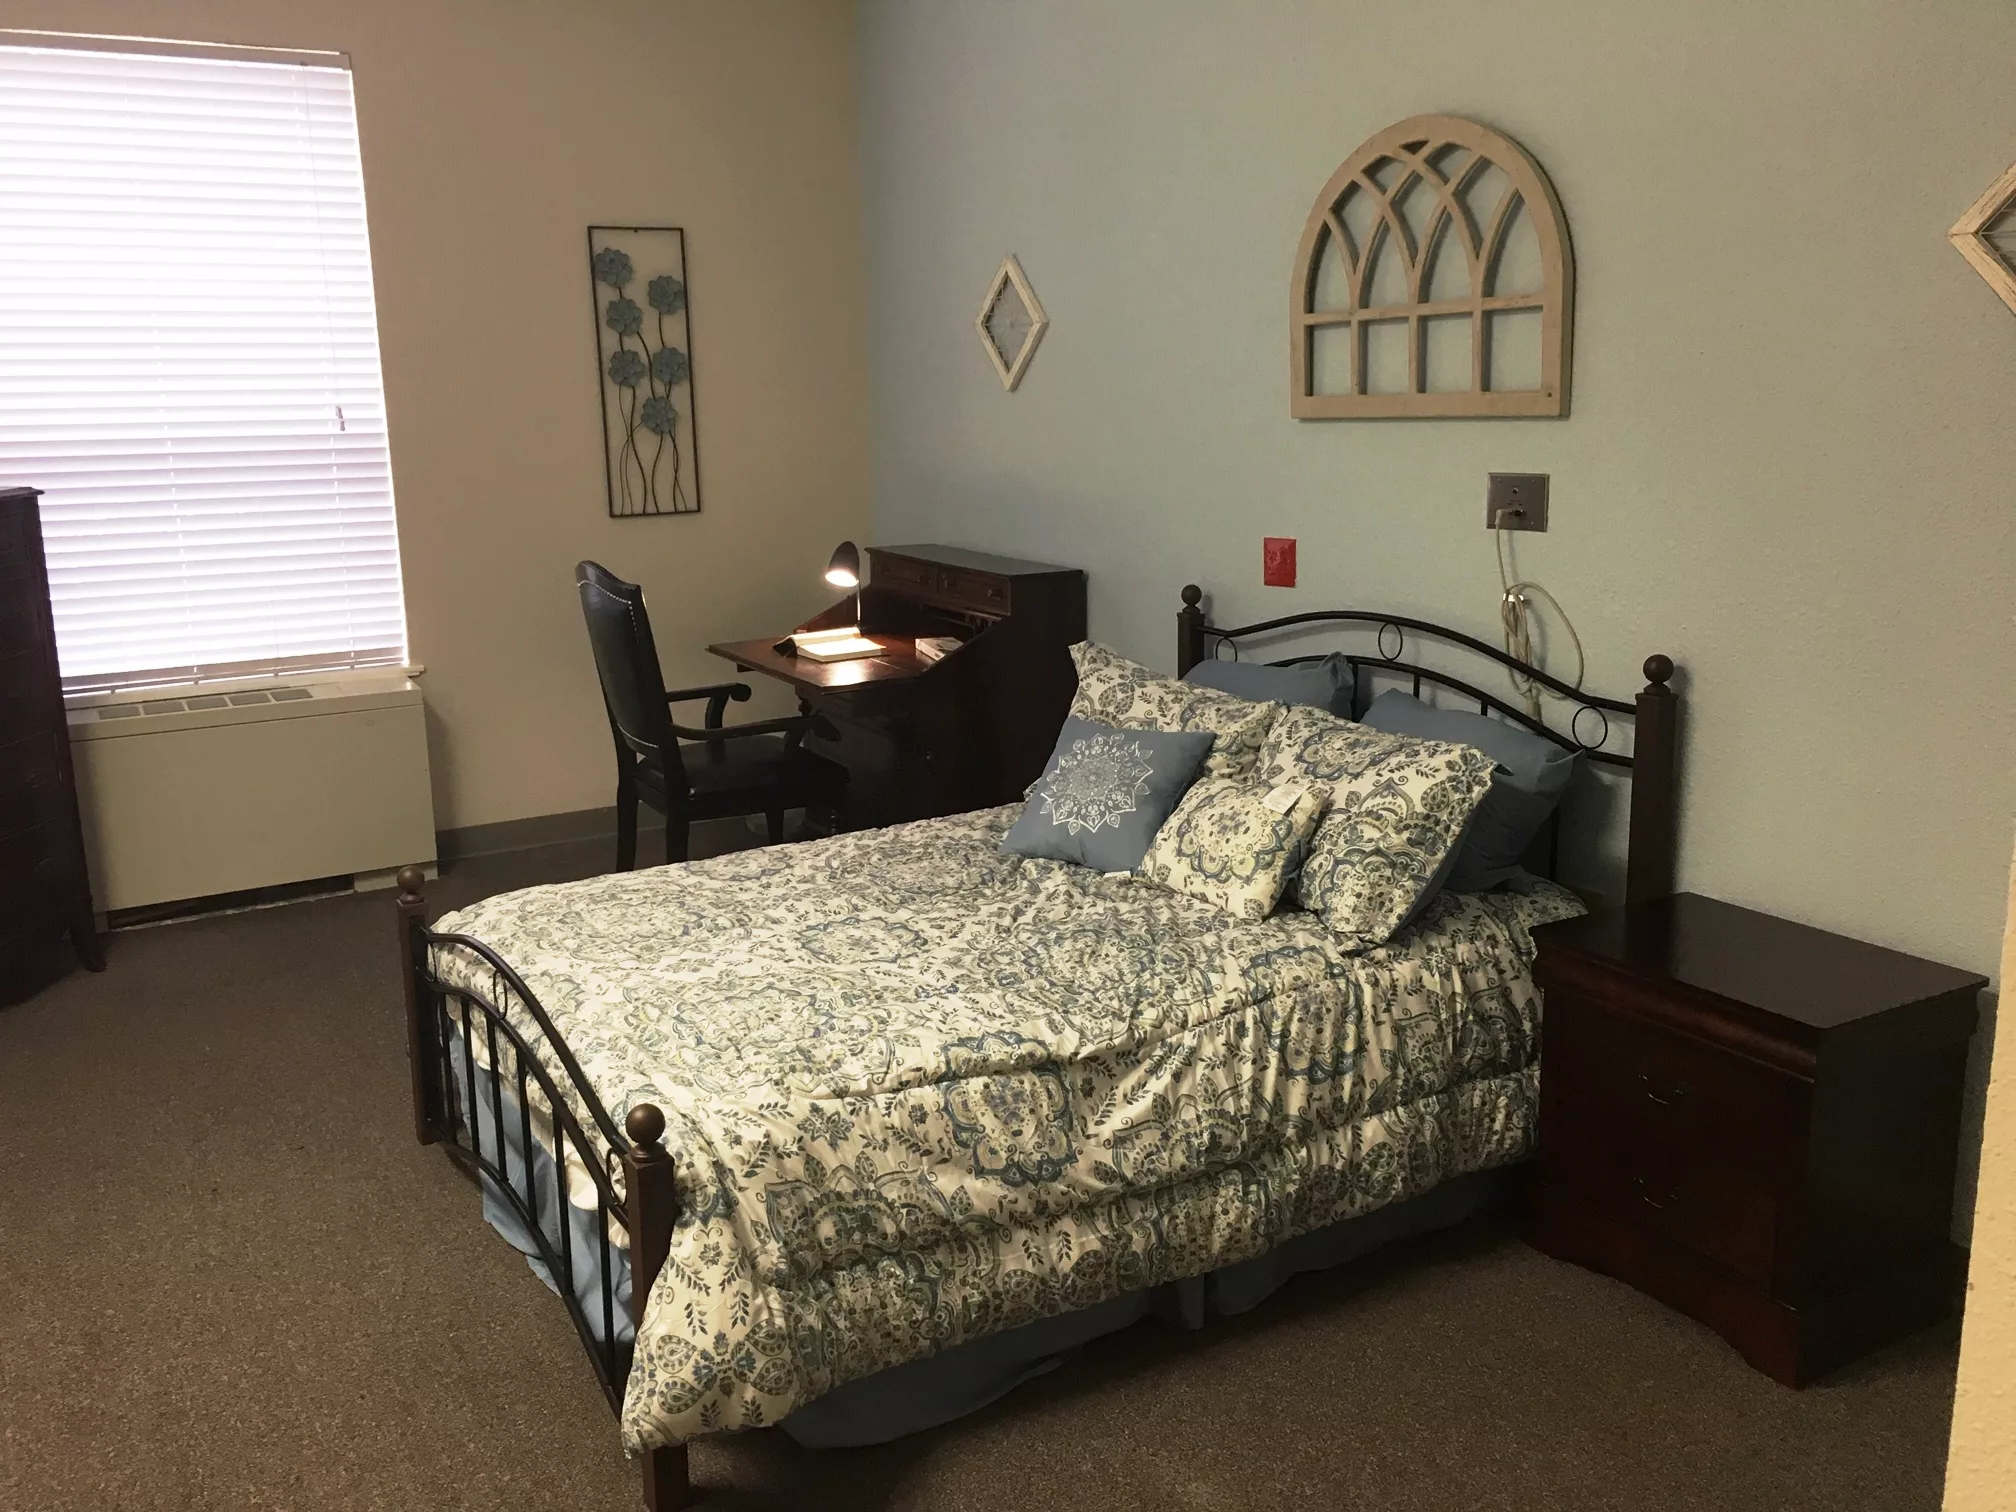

Houston’s Retirement Tradition allows for residents of Treemont to live a balanced lifestyle centered on enrichment and comfort. It’s considered to be an affordable senior living facility that is well-designed and maintained as seen through their beautiful garden making residents feel like they are in an oasis. From their gardens to apartments, everything is well-taken care of and designed to secure residents’s safety and private lifestyle. Their accessible amenities add to the thoughtful layout of the community– a library, dining, patio; as well as their calendar-filled activities and programs are just a few of the essentials offered by the community. The community prides itself in providing intimate care while living an independent lifestyle in the quaint facility. At Treemont, retirees are able to proudly call their new home, home.
An elegant yet affordable retirement community that stands as one of the premier independent living communities in Houston. It’s a comprehensive community that presents a resort-like lifestyle with their word-class hospitality found in their twenty-four-seven service. As it’s a resort-inspired community, there’s a huge significance in providing flexibility and independence. Services are provided in the adherence of the residents. This approach is encouraged to promote a modern and dignified experience in the community. Saint Anne’s Terrace helps residents live their purposeful life to the fullest.
| Staff type | Hours / day | vs state avg |
|---|---|---|
|
Registered Nurse (RN)
| 30m per day | ▲ 15% State avg: 26m per day · National avg: 41m per day |
|
LPN / LVN
| 1h 21m per day | ▲ 42% State avg: 57m per day · National avg: 52m per day |
|
Nurse Aide
| 2h 59m per day | ▲ 48% State avg: 2h 1m per day · National avg: 2h 21m per day |
|
Total Nursing (Weekend)
| 4h 23m per day | ▲ 47% State avg: 2h 59m per day · National avg: 3h 26m per day |
|
Physical Therapist
| 2m per day | ▼ 50% State avg: 4m per day · National avg: 4m per day |
|
RN (Weekend)
| 15m per day | ▼ 29% State avg: 21m per day · National avg: 29m per day |
Treemont Health Care Center is legally operated by Treemont Care, Llc.
In Texas, the Health and Human Services Commission (HHSC) is the primary regulatory body that conducts unannounced inspections and publishes quality reports for all long-term care homes.
This facility has 1 enforcement action. 86% of Texas nursing homes have zero, and the statewide average is 0.2.
| Metric | This Facility | TX Average | vs. TX Avg |
|---|---|---|---|
|
Total citations
| 5 | 6 | This facility has 17% fewer total citations than a typical Texas nursing home (5 vs. TX avg 6).↓ 17% better |
|
Life safety citations
| 5 | 6 | This facility has 17% fewer life safety citations than a typical Texas nursing home (5 vs. TX avg 6).↓ 17% better |
|
Citations per year
| 1.3 | 1.5 | This facility has 13% fewer citations per year than a typical Texas nursing home (1.3 vs. TX avg 1.5).↓ 13% better |
| Metric | This Facility | TX Average | vs. TX Avg |
|---|---|---|---|
|
Inspections with citations
| 1 | 1 | This facility has inspections with citations in line with the Texas average (1 vs. TX avg 1).— At avg |
The most recent inspection on September 19, 2024, found deficiencies related to employee background checks, assistance with activities of daily living, RN coverage, medication errors, and dishwasher thermometer maintenance. Earlier inspections showed similar issues with resident care, grievance resolution, and infection control, including unresolved resident complaints and lapses in supervision and sanitation. Inspectors cited problems with medication management, nursing coverage, and failure to address resident grievances as recurring themes. Complaint investigations prior to the latest inspection included substantiated concerns about unresolved grievances and infection prevention, though enforcement actions were not listed in the available reports. The pattern suggests ongoing challenges with care coordination and regulatory compliance without clear improvement over time.
Read the full inspection reports for this facility, including detailed findings and corrective actions.
Show Inspection ReportsTreemont Health Care Center is located in Houston, Texas.
Here are the financial assistance programs available to residents in Texas.
![]() 12.3 miles from city center
12.3 miles from city center
![]() Estimated distance in miles from Houston's city center to Treemont Health Care Center's address, calculated via Google Maps.
— 8.03 miles to nearest hospital (Texas Children's Hospital)
Estimated distance in miles from Houston's city center to Treemont Health Care Center's address, calculated via Google Maps.
— 8.03 miles to nearest hospital (Texas Children's Hospital)
Add your location
These measures show how residents usually do over time at this home, based on health outcomes and preventive care.
Texas average: 2.13
Texas average: 2.07
Texas average: 25.9%
Texas average: 12.0%
Texas average: 0.8%
Texas average: 53.7%
Texas average: 50.6%
Quality measures are calculated from Minimum Data Set (MDS) assessments. For most measures, lower percentages indicate better care quality.
The information below is reported by the Texas Health and Human Services Commission.
| Park Manor of CyFair |
NH Nursing Home Licensed facility providing 24/7 skilled nursing care for residents with complex, ongoing medical needs. Staffed by RNs, LPNs, and CNAs. Inspected and star-rated annually by CMS. Accepts Medicare (short-term rehab) and Medicaid (long-term care).
AL Assisted Living A licensed, long-term care setting for seniors or individuals with disabilities who need help with daily activities — like bathing, dressing, and medication management — but not 24-hour skilled nursing. Offers housing, meals, and around-the-clock support while aiming to maximize resident independence. | Houston (White Oak Bend) | 120 | 75.2% | +19% | 3.27 | +51% | -10% | 0 | 7 | 2.3 | - | 114 | 55 | Hmg Park Manor Of Cyfair, L.l.c. | $10.9M | $3.9M | 36.1% | 675818 | ||||
| Buckner Parkway Place |
NH Nursing Home Licensed facility providing 24/7 skilled nursing care for residents with complex, ongoing medical needs. Staffed by RNs, LPNs, and CNAs. Inspected and star-rated annually by CMS. Accepts Medicare (short-term rehab) and Medicaid (long-term care).
AL Assisted Living A licensed, long-term care setting for seniors or individuals with disabilities who need help with daily activities — like bathing, dressing, and medication management — but not 24-hour skilled nursing. Offers housing, meals, and around-the-clock support while aiming to maximize resident independence.
IL Independent Living Lifestyle-focused communities for older adults offering dining, activities, and transportation with minimal personal care. Best for active, independent seniors who want community without medical support.
MC Memory Care Secured, specialized care for people living with Alzheimer's or dementia. Staff trained in cognitive impairment, with higher staff-to-resident ratios and an environment designed to reduce confusion and wandering risk. | Houston (Energy Corridor) | 42 | 44.1% | -31% | 5.10 | -13% | +41% | 2 | 17 | 3.4 | 3 | 34 | 81 | Buckner Retirement Services Inc | $23.3M | $6.3M | 26.9% | 675777 | ||||
| Brookdale Galleria |
NH Nursing Home Licensed facility providing 24/7 skilled nursing care for residents with complex, ongoing medical needs. Staffed by RNs, LPNs, and CNAs. Inspected and star-rated annually by CMS. Accepts Medicare (short-term rehab) and Medicaid (long-term care).
AL Assisted Living A licensed, long-term care setting for seniors or individuals with disabilities who need help with daily activities — like bathing, dressing, and medication management — but not 24-hour skilled nursing. Offers housing, meals, and around-the-clock support while aiming to maximize resident independence.
IL Independent Living Lifestyle-focused communities for older adults offering dining, activities, and transportation with minimal personal care. Best for active, independent seniors who want community without medical support.
MC Memory Care Secured, specialized care for people living with Alzheimer's or dementia. Staff trained in cognitive impairment, with higher staff-to-resident ratios and an environment designed to reduce confusion and wandering risk. | Houston (Westside) | 56 | 64.2% | +1% | 4.84 | +71% | +33% | 4 | 19 | 2.7 | 4 | 43 | 89 | Sh 2019 Opcp Holdco I, LLC | $15.0M | $8.5M | 56.8% | 675834 | ||||
| Park Manor of Westchase |
NH Nursing Home Licensed facility providing 24/7 skilled nursing care for residents with complex, ongoing medical needs. Staffed by RNs, LPNs, and CNAs. Inspected and star-rated annually by CMS. Accepts Medicare (short-term rehab) and Medicaid (long-term care).
AL Assisted Living A licensed, long-term care setting for seniors or individuals with disabilities who need help with daily activities — like bathing, dressing, and medication management — but not 24-hour skilled nursing. Offers housing, meals, and around-the-clock support while aiming to maximize resident independence. | Houston (Westside) | 125 | 71.8% | +13% | 3.04 | +57% | -16% | 2 | 28 | 3.1 | 6 | 108 | 64 | Hmg Park Manor Of Westchase, L.l.c. | $10.4M | $3.8M | 36.8% | 676059 |
Care Cost Calculator: See Prices in Your Area
Nursing Home Data Explorer
Don’t Wait Too Long: 7 Red Flag Signs Your Parent Needs Assisted Living Now
The True Cost of Assisted Living in 2025 – And How Families Are Paying For It
Understanding Senior Living Costs: Pricing Models, Discounts & Financial Assistance
Treemont Health Care Center is in the Mid West neighborhood of Houston.
The legal owner and operator of Treemont Health Care Center is Treemont Care, Llc.
Treemont Health Care Center has a walk score of 58. Moderately walkable. Some errands can be accomplished on foot, with a mix of nearby amenities.
Treemont Health Care Center has 54 beds.
Treemont Health Care Center has had 5 recently reported deficiencies.
(713) 783-4100 will put you in contact with the team at Treemont Health Care Center.
Treemont Health Care Center is in Harris County.


Thank you for your interest!
Our team will be in touch shortly to help with next steps.
