Vancrest of Hicksville
Nursing Home, Assisted Living, Home Care, Hospice Care, Nursing Care & Respite Care · Ohio, OH
CMS overall rating Info CMS (the Centers for Medicare & Medicaid Services) is the federal agency that rates nursing home quality. Its Overall Rating runs from 1 to 5 stars, combining health inspections, staffing, and quality measures, with inspections weighted most heavily.

Vancrest of Hicksville

Nursing Home, Assisted Living, Home Care, Hospice Care, Nursing Care & Respite Care · Ohio, OH
CMS overall rating Info CMS (the Centers for Medicare & Medicaid Services) is the federal agency that rates nursing home quality. Its Overall Rating runs from 1 to 5 stars, combining health inspections, staffing, and quality measures, with inspections weighted most heavily.
Calculator: See prices in your area
Vancrest of Hicksville accepts Medicare, Medicaid, and private pay.

Overview of Vancrest of Hicksville

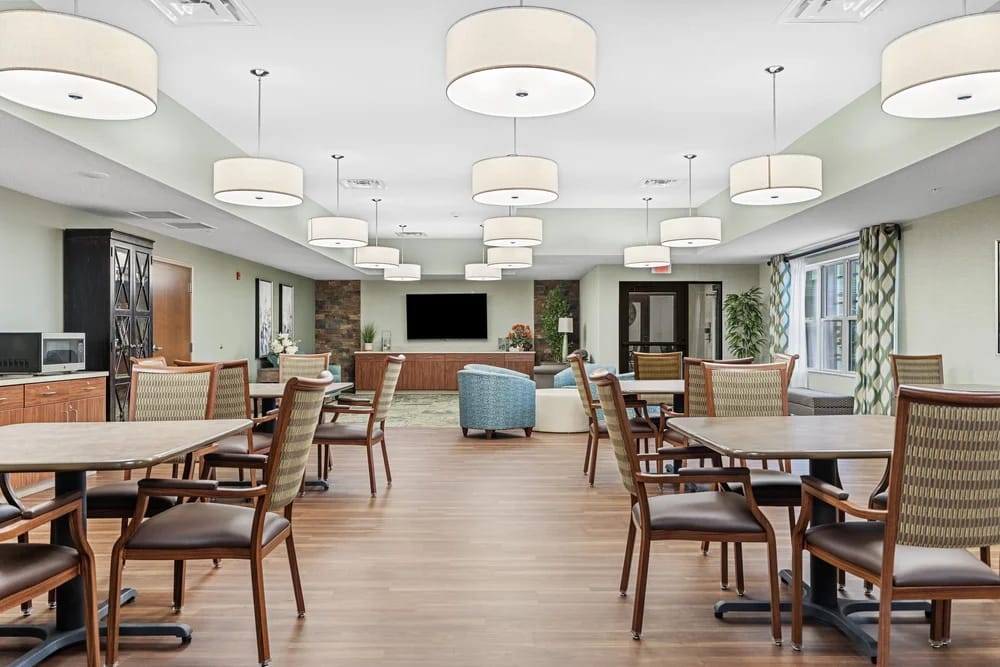
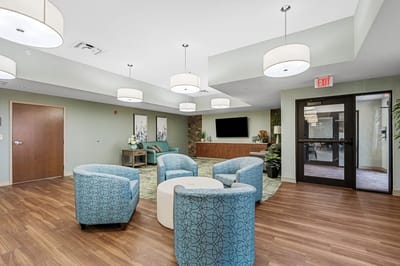
Located on Defiance Avenue, Vancrest of Hicksville is a nursing home in Hicksville, Ohio. It is owned by Jacob Gehl. The 34-bed home accepts Medicare, Medicaid, and private pay, giving families multiple ways to cover short-term rehabilitation or ongoing care. The community’s occupancy rate is 78%, with most residents staying an average of 122 days, including those in post-acute rehab and those receiving longer-term nursing care.

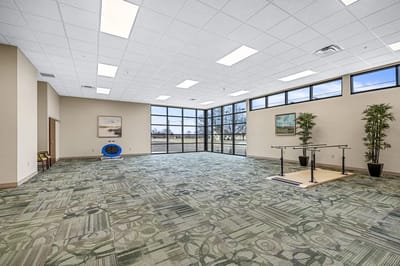
The facility offers inpatient and outpatient rehabilitation services, so Vancrest is a great choice for residents recovering from surgery, injury, or a hospital stay who need structured therapy and monitoring. Total nurse staffing averages 3 hours and 22 minutes per resident each day, ensuring consistent daily hands-on support. Staffing includes registered nurses, nursing aides, and licensed practical nurses, distributed throughout the day to meet residents’ needs.

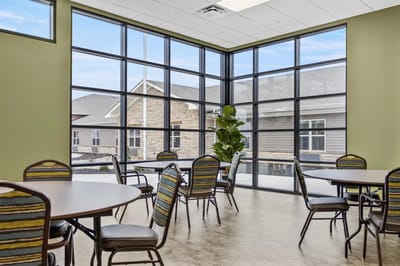
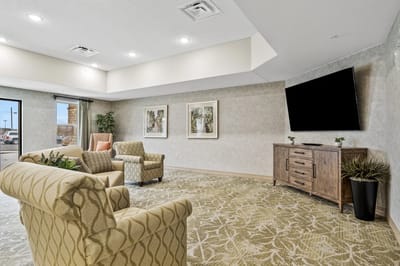
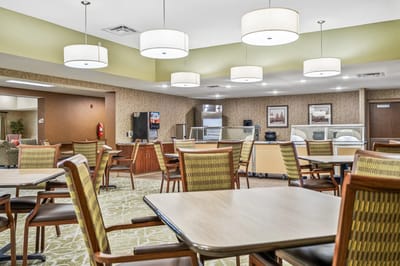
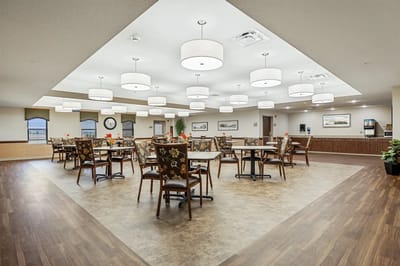
Beyond rehabilitation, the home offers respite care for families who need temporary placement as their primary caregiver takes a break. Medical and nursing support is available 24 hours a day. Residents’ dining options include a selection of menus.

Hicksville’s walkability score is 56 out of 100. Some everyday errands can be handled on foot, while the rest require a short drive.

(419) 789-6135

Quality ratings

Measured by Centers for Medicare & Medicaid Services (CMS)

Overall rating Info The Overall CMS Rating combines results from health inspections, staffing levels and quality measures. Health inspections carry the most weight. Staffing and quality scores can increase or decrease the final rating based on performance compared to state and national standards.
▼ 5.7% Below OH avg. ▼ 5.7% Below OH avg.OH average: 3.2Click the badge to see the full State ranking.Click here to see the full State ranking.
Health Inspection Info Based on the results of the facility's three most recent standard inspections and any complaint investigations. CMS reviews the number, scope, and severity of deficiencies, with more recent findings weighted more heavily.
▼ 28.6% Below OH avg. ▼ 28.6% Below OH avg.OH average: 2.8Click the badge to see the full State ranking.Click here to see the full State ranking.
Staffing Info Measures average nursing staff hours per resident per day, including Registered Nurses (RNs) and total nursing staff. Ratings are adjusted based on the level of care residents require and are compared to state and national benchmarks.
▼ 18.1% Below OH avg. ▼ 18.1% Below OH avg.OH average: 2.4Click the badge to see the full State ranking.Click here to see the full State ranking.
Quality Measures Info Based on clinical and physical health indicators reported to CMS, such as hospital readmissions, falls, pressure ulcers, and improvements in mobility. These measures reflect how well residents' health needs are being managed.
▲ 14.7% Above OH avg. ▲ 14.7% Above OH avg.OH average: 4.4Click the badge to see the full State ranking.Click here to see the full State ranking.

Staffing hours breakdown

Info Daily nursing hours per resident by staff type, reported to CMS. Higher is generally better — compare this facility to state and national averages to see where staffing stands.

Hours per resident per day — compared to Ohio state averages

Total nursing care / resident Info This home is ranked 115th out of 210 homes in Ohio for nurse hours. Total adjusted nursing hours per resident per day, combining RN, LPN, and aide time. CMS adjusts this for case-mix so facilities can be fairly compared.
3h 22m per day
Rank #115 / 210Nurse hours — State benchmarkedThis home is ranked 115th out of 210 homes in Ohio. Shows adjusted nurse hours per resident per day benchmarked to the Ohio average, with a ranking across 210 Ohio facilities. More hours mean more direct care. The national average is about 3.5 hrs; below 3.0 is a red flag.Rankings are based only on facilities in Ohio that report data for that category. Facilities without available data are excluded from the ranking.Click the rank badge to see the full State ranking.Click here to see the full State ranking.
This facility Ohio avg (3h 32m per day)
vs Ohio avg
-5%

2 of 6 metrics below state avg

Standout metric Physical Therapist is +66% above state avg
Staff typeHours / Day / Residentvs state avg
Registered Nurse (RN) Info RNs hold the highest nursing license and can assess residents, interpret test results, and direct care plans. More RN hours per day often signals stronger clinical oversight and faster response to health changes. 22m per day ▼ 41% State avg: 38m per day · National avg: 41m per day
LPN / LVN Info Licensed Practical Nurses (LPNs) or Licensed Vocational Nurses (LVNs) deliver routine hands-on care — medication administration, wound dressing, and monitoring vital signs. They work under RN supervision and make up a large share of daily bedside care. 1h 8m per day ▲ 18% State avg: 58m per day · National avg: 52m per day
Nurse Aide Info Certified Nurse Aides (CNAs) provide the most direct day-to-day assistance: bathing, dressing, feeding, and mobility. Nurse aide hours are typically the largest staffing category and directly affect residents' quality of life. 2h 11m per day ■ Avg State avg: 2h 8m per day · National avg: 2h 20m per day
Weekend Total Nursing Info Combined nursing hours (RN + LPN + Nurse Aide) per resident per day on weekends. Staffing often drops on weekends — this figure reveals whether the facility maintains adequate coverage outside of weekday hours. 3h 12m per day ■ Avg State avg: 3h 17m per day · National avg: 3h 26m per day
Physical Therapist Info Hours per resident per day provided by licensed Physical Therapists (PTs) or PT Assistants. PT services help residents recover mobility after injury or illness and are especially important for post-acute (short-stay) rehabilitation. 5m per day ▲ 66% State avg: 3m per day · National avg: 4m per day
Weekend RN Info Registered nurse hours specifically on weekends. Facilities sometimes reduce RN presence on Saturdays and Sundays — a low weekend RN figure compared to weekday hours can indicate reduced clinical oversight when most administrative staff are absent. 13m per day ▼ 49% State avg: 25m per day · National avg: 28m per day

Capacity and availability

Avg. Length of Stay
122 days
Bed community size
34-bed community Rank #280 / 323Bed count — State benchmarkedThis home is ranked 280th out of 323 homes in Ohio. Shows this facility's certified or reported bed count compared to other Ohio facilities. Larger communities may offer more amenities, programs, and on-site services for residents and families.Rankings are based only on facilities in Ohio that report data for that category. Facilities without available data are excluded from the ranking.Click the rank badge to see the full State ranking.Click here to see the full State ranking.
A moderately sized community that may balance personal attention with shared amenities and social activities.
Walk Score
Walk Score: 56 / 100 Rank #186 / 705Walk Score — State benchmarkedThis home is ranked 186th out of 705 homes in Ohio. Shows how walkable this facility's neighborhood is compared to the average Walk Score across Ohio facilities. Higher scores benefit residents, families, and staff.Rankings are based only on facilities in Ohio that report data for that category. Facilities without available data are excluded from the ranking.Click the rank badge to see the full State ranking.Click here to see the full State ranking.
Moderately walkable. Some errands can be accomplished on foot, with a mix of nearby amenities.

About this community

Occupancy

Occupancy rate
93%
Rank #48 / 211Occupancy rate — State benchmarkedThis home is ranked 48th out of 211 homes in Ohio. Shows this facility's occupancy rate versus the Ohio average, with its Statewide rank out of 211. Higher occupancy signals strong local demand and financial stability.Rankings are based only on facilities in Ohio that report data for that category. Facilities without available data are excluded from the ranking.Click the rank badge to see the full State ranking.Click here to see the full State ranking.
Higher than the Ohio average: 78.7%
Occupied beds
32 / 34
Average occupied beds in Ohio homes 72 beds

License Details

Facility TypeResidential Care Facility
StatusActive
CountyDefiance
CMS Certification Number365437

Therapy & Rehabilitation

2 services
Rehabilitation Services
Respite Care

Staffing & Medical

1 service
24-Hour Staffing

Contact Information

Fax(419) 542-9765

Amenities & Lifestyle

Specific ProgramsInpatient & Outpatient Rehabilitation

Dining & Nutrition

Food DescriptionAt Vancrest, a selection of attractive menu choices is offered at meal time.

Contact Vancrest of Hicksville

Inspection History

In Ohio, the Department of Health, Bureau of Survey and Certification conducts unannounced onsite inspections to evaluate the quality of care and environment in all licensed facilities.

Inspection Scorecard Info This scorecard compares key inspection, citation, and complaint metrics at this facility against the Ohio state average. Metrics rated ≥15% worse than average are highlighted in red; those ≥15% better are highlighted in green.

Overall vs. OH average 0 Worse No metrics in this bucket. 1 Better Metrics better than Ohio average:
• Total citations (100% below)
Latest Inspection April 17, 2025

Citations Info Citations are formal regulatory issues recorded during state inspections.

This FacilityOH Averagevs. OH Avg
Total citations Info Formal regulatory issues recorded by inspectors across all inspection types. 02 This facility has 100% fewer total citations than a typical Ohio nursing home (0 vs. OH avg 2).↓ 100% better

Health Inspection History

Inspections since 2020
Total health inspections 6

Ohio average 6.7


Last Health inspection on Jul 2025

Total health citations
36 Rank #137 / 210Health citations — State benchmarkedThis home is ranked 137th out of 210 homes in Ohio. Shows this facility's total health deficiency citations benchmarked to the Ohio State average, with a ranking across all 210 OH facilities. Lower citation counts earn a better rank.Rankings are based only on facilities in Ohio that report data for that category. Facilities without available data are excluded from the ranking.Click the rank badge to see the full State ranking.Click here to see the full State ranking.

Ohio average 30.9

Citations per inspection
6 Rank #180 / 210Citations per inspection — State benchmarkedThis home is ranked 180th out of 210 homes in Ohio. Shows average deficiency citations per CMS inspection for this facility versus the Ohio mean across 210 facilities with citation data. Lower is better.Rankings are based only on facilities in Ohio that report data for that category. Facilities without available data are excluded from the ranking.Click the rank badge to see the full State ranking.Click here to see the full State ranking.

Ohio average 4.59


Health citations are formal notices following inspections when they fail to comply with safety and care standards.

30 of 36 citations resulted from standard inspections; and 6 of 36 resulted from complaint investigations.

Breakdown of citation severity (last 6 years)
Critical health citations
0
100% better than Ohio average

Ohio average: 0.3


Serious health citations
1
11% worse than Ohio average

Ohio average: 0.9

0 critical citations Ohio average: 0.3

1 serious citation Ohio average: 0.9

35 moderate citations Ohio average: 29

0 minor citations Ohio average: 0.7
Citations history (last 6 years)
Quality of Care serious citation Jul 09, 2025
Corrected

Infection Control moderate citation Apr 12, 2024
Corrected

Nutrition moderate citation Apr 12, 2024
Corrected

Nutrition moderate citation Apr 12, 2024
Corrected

Staffing Data

Reporting period: October 1 – December 31, 2025 (Q4 2025). Source: CMS Payroll-Based Journal report.

Total staff 197
Employees 102
Contractors 95
Staff to resident ratio 2.94 : 1
44% more staff per resident than Ohio average
Ohio average ratio: 2.04 : 1 Ohio average ratio: 2.04 : 1See full Ohio ranking
Avg staff/day 34
Average shift 8.4 hours
0% compared with Ohio average
Ohio average: 8.1 hours Ohio average shift: 8.1 hoursSee full Ohio ranking
Total staff hours (quarter) 26,131

Nursing staff breakdown

Q4 2025 · Oct 1 – Dec 31 More info This data comes from the CMS Payroll-Based Journal report covering October 1 – December 31, 2025.
Registered Nurse

Manages medical care and health needs.

RN Staff Info All 11 RN Staff are full-time employees. No contractors work on this role. 11
Average shift length Info Average shift length. Calculated as total hours divided by days worked and average staff per day. 7.8 hours
Licensed Practical Nurse

Assists with medical care and medications.

LPN Staff Info 67 total: 21 full-time employees and 46 contractors. 67
Average shift length Info Average shift length. Calculated as total hours divided by days worked and average staff per day. 9.3 hours
Certified Nursing Assistant

Helps with daily care and mobility.

CNA Staff Info 94 total: 47 full-time employees and 47 contractors. 94
Average shift length Info Average shift length. Calculated as total hours divided by days worked and average staff per day. 8.8 hours

Contractor staffing

Q4 2025 · Oct 1 – Dec 31 More info This data comes from the CMS Payroll-Based Journal report covering October 1 – December 31, 2025.

Total hours from contractors

6.3%

1,650 contractor hours this quarter

Certified Nursing Assistant: 47 Licensed Practical Nurse: 46 Occupational Therapy Aide: 1 Occupational Therapy Assistant: 1

Staff by category

Q4 2025 · Oct 1 – Dec 31 More info This data comes from the CMS Payroll-Based Journal report covering October 1 – December 31, 2025.
Certified Nursing Assistant47479412,52992100%8.8
Licensed Practical Nurse2146676,54792100%9.3
Registered Nurse110111,1278592%7.8
Speech Language Pathologist2028236874%6.4
Other Dietary Services Staff40480292100%6.8
Physical Therapy Aide4045506773%6
Physical Therapy Assistant3035146672%7.6
Nurse Practitioner1015126470%8
Administrator1014966267%8
Clinical Nurse Specialist1014966267%8
Respiratory Therapy Technician3034786672%7.2
Therapeutic Recreation Specialist1014586065%7.6
Mental Health Service Worker1014565762%8
Qualified Social Worker2022156470%3.4
Occupational Therapy Aide0111041314%8
Occupational Therapy Assistant0112633%8.5
94 Certified Nursing Assistant
% of Days 100%
67 Licensed Practical Nurse
% of Days 100%
11 Registered Nurse
% of Days 92%
2 Speech Language Pathologist
% of Days 74%
4 Other Dietary Services Staff
% of Days 100%
4 Physical Therapy Aide
% of Days 73%
3 Physical Therapy Assistant
% of Days 72%
1 Nurse Practitioner
% of Days 70%
1 Administrator
% of Days 67%
1 Clinical Nurse Specialist
% of Days 67%
3 Respiratory Therapy Technician
% of Days 72%
1 Therapeutic Recreation Specialist
% of Days 65%
1 Mental Health Service Worker
% of Days 62%
2 Qualified Social Worker
% of Days 70%
1 Occupational Therapy Aide
% of Days 14%
1 Occupational Therapy Assistant
% of Days 3%

Penalties and fines

Federal penalties imposed by CMS for regulatory violations, including civil money penalties (fines) and denials of payment for new Medicare/Medicaid admissions.

Source: CMS Penalties Database

No penalties in the past 3 years

No civil money penalties or payment denials were reported in the last 3 years.

Quality of care over time

These measures show how residents usually do over time at this home, based on health outcomes and preventive care.

High-risk clinical events score Info A composite score based on pressure ulcers, falls with injury, weight loss, walking ability decline, and activities of daily living decline. 6.0
In line with Ohio average

Ohio average: 5.8

Functional decline score Info A composite score based on activities of daily living decline, walking ability decline, and incontinence. 11.5
10% better than Ohio average

Ohio average: 12.7

Long-stay resident measures
Significantly above average Ohio avg: 4.7 Info CMS star rating based on long-stay quality measure performance. 5 stars = significantly above average, 1 star = significantly below average.
Need for Help with Daily Activities Increased Info Percent of long-stay residents whose need for help with daily activities has increased 6.5%
6% better than Ohio average

Ohio average: 6.8%

Walking Ability Worsened Info Percent of long-stay residents whose ability to move independently worsened 10.2%
15% worse than Ohio average

Ohio average: 8.9%

Low Risk Residents with Bowel/Bladder Incontinence Info Percent of low risk long-stay residents who lose control of their bowels or bladder 17.7%
19% better than Ohio average

Ohio average: 22.0%

Falls with Major Injury Info Percent of long-stay residents experiencing one or more falls with major injury 8.2%
139% worse than Ohio average

Ohio average: 3.4%

High Risk Residents with Pressure Ulcers Info Percent of long-stay high risk residents with pressure ulcers 1.5%
61% better than Ohio average

Ohio average: 3.9%

Urinary Tract Infection Info Percent of long-stay residents with a urinary tract infection 0.9%
71% worse than Ohio average

Ohio average: 0.5%

Lost Too Much Weight Info Percent of long-stay residents who lose too much weight 3.7%
41% better than Ohio average

Ohio average: 6.2%

Depressive Symptoms Info Percent of long-stay residents who have depressive symptoms 6.9%
71% better than Ohio average

Ohio average: 24.0%

Antipsychotic Use Info Percent of long-stay residents who received an antipsychotic medication 3.1%
64% better than Ohio average

Ohio average: 8.4%

Pneumococcal Vaccine Info Percent of long-stay residents assessed and appropriately given the pneumococcal vaccine 90.5%
In line with Ohio average

Ohio average: 92.4%

Influenza Vaccine Info Percent of long-stay residents assessed and appropriately given the seasonal influenza vaccine 95.0%
In line with Ohio average

Ohio average: 94.5%

Hospitalizations per 1,000 days Info Number of hospitalizations per 1,000 long-stay resident days. 2.13
20% worse than Ohio average

Ohio average: 1.77

ED visits per 1,000 days Info Number of outpatient emergency department visits per 1,000 long-stay resident days. 0.85
54% better than Ohio average

Ohio average: 1.83

Short-stay resident measures
Average Ohio avg: 2.4 Info CMS star rating based on short-stay quality measure performance. 5 stars = much above average, 1 star = much below average.
Pneumococcal Vaccine Info Percent of short-stay residents assessed and appropriately given the pneumococcal vaccine 72.1%
8% worse than Ohio average

Ohio average: 78.0%

Antipsychotic medication increase Info Percent of short-stay residents who newly received an antipsychotic medication 0.7%
49% better than Ohio average

Ohio average: 1.3%

Influenza Vaccine Info Percent of short-stay residents assessed and appropriately given the seasonal influenza vaccine 82.2%
9% better than Ohio average

Ohio average: 75.6%

Re-hospitalized after SNF stay Info Percentage of short-stay residents who were re-hospitalized after their nursing home admission. 38.2%
52% worse than Ohio average

Ohio average: 25.1%

Emergency department visits Info Percentage of short-stay residents who had an outpatient emergency department visit. 7.4%
41% better than Ohio average

Ohio average: 12.5%

Falls with major injury Info Percentage of SNF residents who experience falls with major injury during their stay. 0.0%
100% better than Ohio average

Ohio average: 0.8%

Ability to care for self at discharge Info Percentage of residents at or above expected ability to care for themselves at discharge. 39.1%
27% worse than Ohio average

Ohio average: 53.7%

Successful return to home or community Info Rate of successful return to home or community from a skilled nursing facility. 42.9%
15% worse than Ohio average

Ohio average: 50.6%

Breakdown by payment type

Medicare

22% of new residents, usually for short-term rehab.

Typical stay 1 - 2 months

Private pay

46% of new residents, often for short stays.

Typical stay 3 - 4 months

Medicaid

33% of new residents, often for long-term daily care.

Typical stay 6 - 7 months

Facility Characteristics

Source: CMS Long-Term Care Facility Characteristics (Data as of Jan 2026)

Total residents 67
Medicare
4
6% of residents
Medicaid
50
74.6% of residents
Private pay or other
13
19.4% of residents
Programs & Services
Residents Group

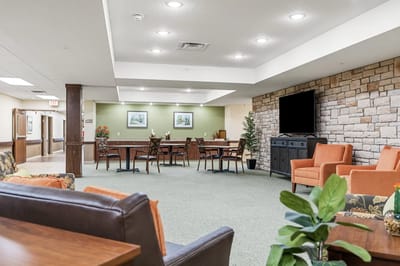
Residents meet regularly to discuss policies, care quality, and activities

Nurse Aide Training

State-approved Nurse Aide Training and Competency Evaluation Program on-site

Active Resident Council

Organized group of residents that meets regularly to discuss facility policies, quality of life, and activities.

Finances and operations

Based on CMS SNF Cost Report for fiscal year ending in 12/2023.

Privately-owned community
Operated by a single business entity.
Net patient revenue Info Net patient revenue — what the home actually collects for resident care, after contractual allowances, bad debt and discounts are subtracted from its gross charges (CMS cost report, Worksheet G-3). It covers resident care only; money the home earns from other sources is shown separately as "Other income."
$6.5M
Net patient income Info Net patient income: net patient revenue minus the home's total operating expenses. A positive figure means it earns more from resident care than it spends to deliver it; a negative figure means the opposite. It excludes non-operating "other income."
-$886.6K
Privately-owned community Operated by a single business entity.
Net patient revenue Info Net patient revenue — what the home actually collects for resident care, after contractual allowances, bad debt and discounts are subtracted from its gross charges (CMS cost report, Worksheet G-3). It covers resident care only; money the home earns from other sources is shown separately as "Other income."
$6.5M Rank #130 / 210Revenue — State benchmarkedThis home is ranked 130th out of 210 homes in Ohio. Shows this facility's annual revenue compared to the Ohio average. Higher revenue generally means more resources for staffing and capital — read alongside Payroll %.Rankings are based only on facilities in Ohio that report data for that category. Facilities without available data are excluded from the ranking.Click the rank badge to see the full State ranking.Click here to see the full State ranking.
Net patient income Info Net patient income: net patient revenue minus the home's total operating expenses. A positive figure means it earns more from resident care than it spends to deliver it; a negative figure means the opposite. It excludes non-operating "other income."
-$886.6K
Other income Info Money the home earns outside of resident care — such as investments, grants, rentals and other non-operating sources (CMS cost report, Worksheet G-3). It is tracked separately from net patient revenue: it is not part of that figure, and it is not included in net patient income.
$397.5K
Payroll costs Info Staff salaries plus wage-related costs — benefits such as payroll taxes, health insurance and retirement — from the home's own accounting records (CMS cost report, Worksheet A). Contract or agency labor is counted separately, under other operating costs. Rank #137 / 210Payroll — State benchmarkedThis home is ranked 137th out of 210 homes in Ohio. Shows total annual staff payroll benchmarked to the Ohio average. Higher payroll investment relative to peers often signals better staffing and less reliance on cheaper contract labor.Rankings are based only on facilities in Ohio that report data for that category. Facilities without available data are excluded from the ranking.Click the rank badge to see the full State ranking.Click here to see the full State ranking.
$3.1M 46.7% of net patient revenue Info Payroll as a share of revenue: staff salaries and wage-related benefits divided by net patient revenue. A higher figure means more of each revenue dollar goes to staff pay. Rank #137 / 210Payroll % — State benchmarkedThis home is ranked 137th out of 210 homes in Ohio. Shows payroll as a percentage of revenue versus the Ohio average. Well-run Ohio facilities typically land around 54–64% — the top third Statewide. Below 25% may signal understaffing or heavy agency use — read with Staffing ratings.Rankings are based only on facilities in Ohio that report data for that category. Facilities without available data are excluded from the ranking.Click the rank badge to see the full State ranking.Click here to see the full State ranking.
Other operating costs Info Everything it costs to run the home apart from payroll — food, utilities, supplies, maintenance, contract labor and administration. Calculated as total operating expense minus payroll (staff salaries and wage-related benefits).
$4.4M
Total costs Info The home's total operating expense for the year — all the costs of running it, salaries included (CMS cost report, Worksheet G-3).
$7.4M

Who this home usually serves

TYPE OF STAY

Mix of rehab and long-term care

This home supports both short-term rehab and long-term care, with residents staying for a wide range of durations.

New residents most often arrive under private pay (46% of admissions), and a typical private pay stay runs around 3 - 4 months.

Admissions
206 total

Coverage residents most often arrive under.

Medicare 22%
Private pay 46%
Medicaid 33%
Discharges
208 total

Coverage residents most often leave under.

Medicare 23%
Private pay 45%
Medicaid 32%

Places of interest near Vancrest of Hicksville

Address 0.0 miles from city center Info Estimated distance in miles from Hicksville's city center to Vancrest of Hicksville's address, calculated via Google Maps.

Calculate Travel Distance to Vancrest of Hicksville

Add your location

Address

Compare Nursing Homes around Ohio

The information below is reported by the Ohio Department of Health, Bureau of Survey and Certification.

5 facilities compared · CMS & OH Dept. of Health data

Brookdale Westlake Village
NH
AL
IL
MC
Westlake
60
Facility 60
OH AVG 78
Rank #190 / 323
96.7%
Facility 96.7%
OH AVG 78.7%
Rank #30 / 211
+23%
4.38
Facility 4.38
OH AVG 3.54
Rank #26 / 210
+18%+24%
$0
Facility $0
OH AVG $74.0k
Rank #1 / 211
5
Facility 5
OH AVG 30.9
Rank #11 / 210
1.3
Facility 1.3
OH AVG 4.6
Rank #2 / 210
-62A+
25
Facility 25
OH AVG 40
Rank #501 / 705
Labeed Diab
$20.1M
Facility $20.1M
OH AVG $10.1M
Rank #77 / 210
$10.2M
Facility $10.2M
OH AVG $3.9M
Rank #15 / 210
50.8%
Facility 50.8%
OH AVG 40.2%
Rank #5 / 210
366373
Meadow Grove Transitional Care
NH
NC
PC
Grove City (Blue Star Drive)
99
Facility 99
OH AVG 78
Rank #77 / 323
96.0%
Facility 96.0%
OH AVG 78.7%
Rank #32 / 211
+22%
2.98
Facility 2.98
OH AVG 3.54
Rank #177 / 210
+4%-16%
$0
Facility $0
OH AVG $74.0k
Rank #1 / 211
20
Facility 20
OH AVG 30.9
Rank #65 / 210
4.0
Facility 4.0
OH AVG 4.6
Rank #95 / 210
-89A+
1
Facility 1
OH AVG 40
Rank #674 / 705
Valerie Kettell
$11.6M
Facility $11.6M
OH AVG $10.1M
Rank #73 / 210
$6.0M
Facility $6.0M
OH AVG $3.9M
Rank #82 / 210
51.8%
Facility 51.8%
OH AVG 40.2%
Rank #160 / 210
366446
Vancrest of Hicksville
NH
AL
HC
NC
RC
Hicksville
34
Facility 34
OH AVG 78
Rank #280 / 323
92.9%
Facility 92.9%
OH AVG 78.7%
Rank #48 / 211
+18%
3.36
Facility 3.36
OH AVG 3.54
Rank #115 / 210
-39%-5%
$0
Facility $0
OH AVG $74.0k
Rank #1 / 211
36
Facility 36
OH AVG 30.9
Rank #137 / 210
6.0
Facility 6.0
OH AVG 4.6
Rank #180 / 210
162-
56
Facility 56
OH AVG 40
Rank #186 / 705
Jacob Gehl
$6.5M
Facility $6.5M
OH AVG $10.1M
Rank #130 / 210
$3.1M
Facility $3.1M
OH AVG $3.9M
Rank #137 / 210
46.7%
Facility 46.7%
OH AVG 40.2%
Rank #137 / 210
365437
Cottingham Retirement Community
NH
AL
HC
IL
MC
PC
RC
Cincinnati (Sharonville)
128
Facility 128
OH AVG 78
Rank #36 / 323
45.3%
Facility 45.3%
OH AVG 78.7%
Rank #203 / 211
-42%
2.78
Facility 2.78
OH AVG 3.54
Rank #198 / 210
-48%-21%
$0
Facility $0
OH AVG $74.0k
Rank #1 / 211
22
Facility 22
OH AVG 30.9
Rank #80 / 210
3.7
Facility 3.7
OH AVG 4.6
Rank #82 / 210
258A+
53
Facility 53
OH AVG 40
Rank #223 / 705
-
$7.5M
Facility $7.5M
OH AVG $10.1M
Rank #140 / 210
$3.7M
Facility $3.7M
OH AVG $3.9M
Rank #157 / 210
49.3%
Facility 49.3%
OH AVG 40.2%
Rank #148 / 210
365652
Beachwood Commons by New Perspective
NH
AL
IL
MC
Beachwood
120
Facility 120
OH AVG 78
Rank #49 / 323
80.7%
Facility 80.7%
OH AVG 78.7%
Rank #129 / 211
+3%
3.24
Facility 3.24
OH AVG 3.54
Rank #150 / 210
-63%-8%
$0
Facility $0
OH AVG $74.0k
Rank #1 / 211
44
Facility 44
OH AVG 30.9
Rank #167 / 210
4.0
Facility 4.0
OH AVG 4.6
Rank #95 / 210
-105A+
15
Facility 15
OH AVG 40
Rank #586 / 705
Beachwood Holdco LLC
$11.1M
Facility $11.1M
OH AVG $10.1M
Rank #122 / 210
$5.1M
Facility $5.1M
OH AVG $3.9M
Rank #89 / 210
46.6%
Facility 46.6%
OH AVG 40.2%
Rank #31 / 210
365071

Financial Assistance for
Nursing Home in Ohio

Vancrest of Hicksville is located in HICKSVILLE, Ohio.
Here are the financial assistance programs available to residents in Ohio.

Get Financial aid guidance

PASSPORT Waiver

Ohio Medicaid PASSPORT

Age 60+
General Ohio resident, Medicaid-eligible, nursing home-level care need.
Income Limits (2025) ~$2,829/month 300% FBR, individual
Asset Limits $2,000 (individual), $3,000 (couple).
OH

Administered through regional agencies; waitlists possible.

Benefits
Personal care (5-7 hours/day) Respite (240 hours/year) Adult day care ($65/day) Home modifications ($1,500 avg.)

Ohio Home Care Program (non-Medicaid)

OH HCP

Age 60+
General Ohio resident, at risk of decline.
Income Limits ~$2,000/month individual, varies
Asset Limits $5,000 individual
OH

Limited funding; regional variation.

Benefits
In-home care (3-5 hours/week) Respite (up to 10 days/year) Transportation (~5 trips/month)

Assisted Living Waiver (ALW)

Ohio Assisted Living Waiver

Age 21+ (65+ prioritized)
General OH resident, Medicaid-eligible, NFLOC.
Income Limits (2025) ~$2,829/month (individual); QIT required.
Asset Limits $2,000 (individual), $3,000 (couple).
OH

Covers ~300 facilities; room/board not included (separate cost).

Benefits
Personal care Meals Medication management Transportation (~$3,000-$4,000/month value)

Program of All-Inclusive Care for the Elderly (PACE)

Ohio PACE (e.g., McGregor PACE)

Age 55+
General OH resident (specific counties), NFLOC, safe with PACE support.
Income Limits (2025) ~$2,829/month (Medicaid-eligible); private pay option available.
Asset Limits $2,000 (individual), $3,000 (couple) for Medicaid enrollees.
OH

Available in 9 counties (e.g., Cuyahoga, Franklin); expanding via Healthy Aging Grants.

Benefits
Personal care (5-7 hours/day) Medical care Meals Transportation Respite Therapies

Medicare Savings Program (MSP)

Ohio Medicare Savings Program

Age 65+ or disabled
General OH resident, Medicare Part A/B.
Income Limits (2025) ~$2,510/month (QMB), ~$3,380/month (SLMB), ~$3,598/month (QI)—individual.
Asset Limits $9,430 (individual), $14,130 (couple).
OH

Three tiers; includes Extra Help for Part D; no waitlist.

Benefits
Covers Part B premiums ($174.70/month) Deductibles ($240/year) Copays (~20%)

Home Energy Assistance Program (HEAP)

Ohio HEAP

Age 60+ prioritized
General OH resident, low-income household.
Income Limits (2025) ~$3,970/month individual, 185% FPL
Asset Limits Not assessed; income-focused.
OH

Covers gas, electric, oil; emergency aid via Winter/Summer Crisis Programs.

Benefits
Heating/cooling aid ($300-$1,000/season) Emergency aid ($500 max)

Family Caregiver Support Program (FCSP)

Ohio Family Caregiver Support Program

Age
General Caregivers of 60+ needing care or 55+ caregivers of others; OH resident; functional needs (2+ ADLs).
Income Limits (2025) Prioritizes ~$24,980/year (individual); no strict cap.
Asset Limits Not assessed; need-based.
OH

12 AAAs; rural/low-income priority; volunteer respite option.

Benefits
Respite (4-6 hours/week or 5 days/year) Adult day care ($60/day) Training Supplies (~$500/year)

VA Aid and Attendance (A&A) and Housebound Benefits

Ohio VA Aid and Attendance/Housebound

Age 65+ or disabled veteran/spouse
General OH resident, wartime service, need for ADL help (A&A) or homebound.
Income Limits (2025) Net income < ~$1,984/month (veteran with dependent, A&A); pension offsets income.
Asset Limits ~$155,356 net worth limit
OH

High veteran demand; supports care in multiple settings.

Benefits
Cash (~$1,433-$2,642/month veteran, ~$951-$1,318 spouse) for care costs (e.g., in-home, assisted living)

Homestead Exemption

Ohio Homestead Exemption

Age 65+ (or disabled)
General OH resident, homeowner, low-income.
Income Limits (2025) ~$38,500/year individual, adjusted annually
Asset Limits Not assessed; home ownership required.
OH

Reduces taxable value by $25,000; applies to primary residence.

Benefits
Tax reduction (~$400-$800/year avg., varies by county)

Save the Dream Ohio (Homeowner Assistance Fund)

Ohio Save the Dream

Age 60+ prioritized
General OH resident, homeowner, hardship post-Jan 21, 2020.
Income Limits (2025) ~$147,600/year family of 4, 150% AMI; varies by county
Asset Limits Not assessed; hardship-focused.
OH

Covers delinquent mortgages, utilities, taxes; max $25,000 mortgage aid.

Benefits
Mortgage aid ($25,000 max) Utility/property tax aid ($5,000 avg.)

Frequently Asked Questions about Vancrest of Hicksville

Is Vancrest of Hicksville in a walkable area?

Vancrest of Hicksville has a walk score of 56. Moderately walkable. Some errands can be accomplished on foot, with a mix of nearby amenities.

What is the occupancy rate at Vancrest of Hicksville?

Vancrest of Hicksville's occupancy is 93%.

What is the best email address for Vancrest of Hicksville?

The team at Vancrest of Hicksville can be reached at [email protected].

How many beds does Vancrest of Hicksville have?

Vancrest of Hicksville has 34 beds.

Has Vancrest of Hicksville had any recent deficiencies or citations?

Vancrest of Hicksville has no recently reported deficiencies or citations.

Are there photos of Vancrest of Hicksville?

Yes — there are 17 photos of Vancrest of Hicksville in the photo gallery on this page.

What is the address of Vancrest of Hicksville?

Vancrest of Hicksville is located at 601 Defiance Avenue, Hicksville, OH 43526.

Guides for Better Senior Living

Care Cost Calculator: See Prices in Your Area

Nursing Home Data Explorer

Don’t Wait Too Long: 7 Red Flag Signs Your Parent Needs Assisted Living Now

The True Cost of Assisted Living in 2025 – And How Families Are Paying For It

Understanding Senior Living Costs: Pricing Models, Discounts & Financial Assistance