Vi at Grayhawk
Nursing Home, Assisted Living, Independent Living & Memory Care · Scottsdale, AZ
CMS overall rating Info CMS (the Centers for Medicare & Medicaid Services) is the federal agency that rates nursing home quality. Its Overall Rating runs from 1 to 5 stars, combining health inspections, staffing, and quality measures, with inspections weighted most heavily.

Vi at Grayhawk

Nursing Home, Assisted Living, Independent Living & Memory Care · Scottsdale, AZ
CMS overall rating Info CMS (the Centers for Medicare & Medicaid Services) is the federal agency that rates nursing home quality. Its Overall Rating runs from 1 to 5 stars, combining health inspections, staffing, and quality measures, with inspections weighted most heavily.
Calculator: See prices in your area
Vi at Grayhawk accepts Medicare and private pay.

Overview of VI at Grayhawk

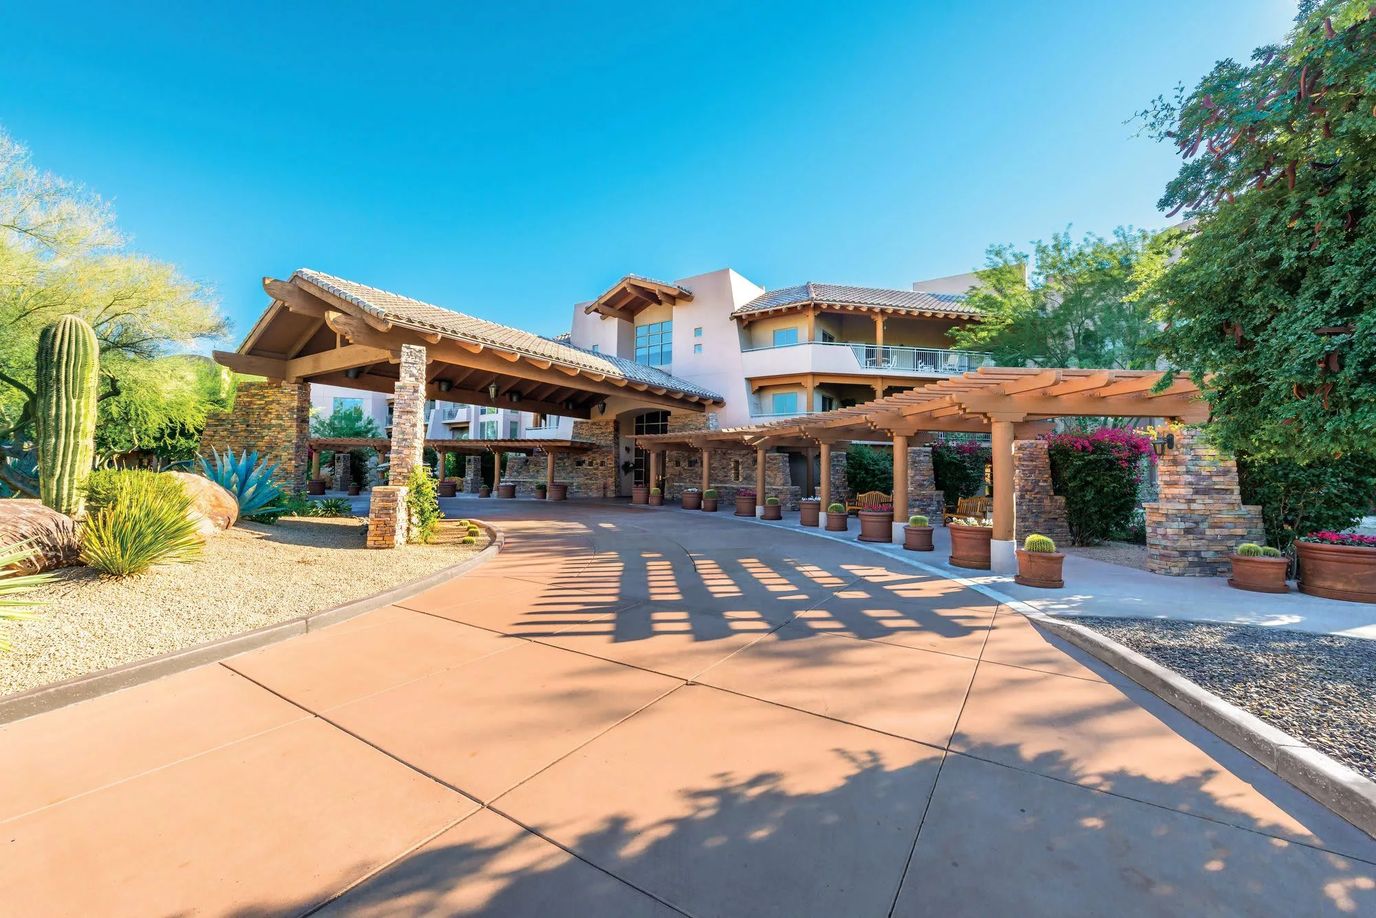
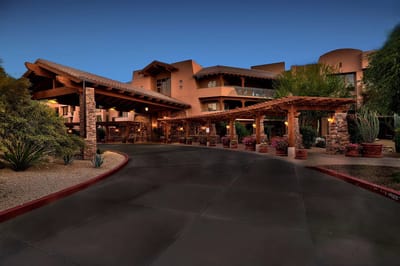
VI at Grayhawk operates in Scottsdale as a continuum-care community spanning nursing home, skilled nursing, assisted living, independent living, and memory care. The address is 7501 E Thompson Peak Pkwy. Medicare and private pay are accepted. Walk Score of 8 means the area is car-dependent; groceries, pharmacy, and most services require a vehicle.

Occupancy runs at 36.7%, notably low for Arizona nursing communities. Residents average 86 days.

Total nursing hours hit 4 hours 46 minutes per resident daily: 1 hour 25 minutes RN, 1 hour 8 minutes LPN, 2 hours 45 minutes CNA; that’s 14% above the Arizona average. Physical therapy alone provides 16 minutes per resident daily (167% above state average). Weekend RN coverage doesn’t drop; it stays at 1 hour per day, when many facilities cut back.

Total headcount: 117 staff including 11 full-time RNs, 18 LPNs, and 63 CNAs. Staff per resident runs 116% above the Arizona average. This is a heavily staffed operation.

Over five years, 8 deficiencies and 4 health citations (all corrected). The facility ranks first in Arizona for citations per inspection at 1.33 versus the 3.82 state average. But recent findings point to specific execution gaps: a resident fall from incorrect gait belt use during transfer, unsafe oxygen tubing placement, and infection control lapses. These aren’t systemic patterns; they’re moments where protocol broke down despite available staff.

VI at Grayhawk reads as over-resourced for its current patient volume. The staffing depth, weekend coverage, and therapy allocation suggest a facility built for high acuity or large census that isn’t materializing. For short-stay post-acute or memory care requiring robust staffing, capacity exists. For families seeking a high-staffing model in a lower-occupancy setting, the operational math works.

(888) 676-8171

Quality ratings

Measured by Centers for Medicare & Medicaid Services (CMS)

Overall rating Info The Overall CMS Rating combines results from health inspections, staffing levels and quality measures. Health inspections carry the most weight. Staffing and quality scores can increase or decrease the final rating based on performance compared to state and national standards.
▲ 50.8% Above AZ avg. ▲ 50.8% Above AZ avg.AZ average: 3.3Click the badge to see the full State ranking.Click here to see the full State ranking.
Health Inspection Info Based on the results of the facility's three most recent standard inspections and any complaint investigations. CMS reviews the number, scope, and severity of deficiencies, with more recent findings weighted more heavily.
▲ 80.5% Above AZ avg. ▲ 80.5% Above AZ avg.AZ average: 2.8Click the badge to see the full State ranking.Click here to see the full State ranking.
Staffing Info Measures average nursing staff hours per resident per day, including Registered Nurses (RNs) and total nursing staff. Ratings are adjusted based on the level of care residents require and are compared to state and national benchmarks.
▲ 64.7% Above AZ avg. ▲ 64.7% Above AZ avg.AZ average: 3.0Click the badge to see the full State ranking.Click here to see the full State ranking.
Quality Measures Info Based on clinical and physical health indicators reported to CMS, such as hospital readmissions, falls, pressure ulcers, and improvements in mobility. These measures reflect how well residents' health needs are being managed.
▲ 10.8% Above AZ avg. ▲ 10.8% Above AZ avg.AZ average: 4.5Click the badge to see the full State ranking.Click here to see the full State ranking.

Staffing hours breakdown

Info Daily nursing hours per resident by staff type, reported to CMS. Higher is generally better — compare this facility to state and national averages to see where staffing stands.

Hours per resident per day — compared to Arizona state averages

Total nursing care / resident Info This home is ranked 11th out of 71 homes in Arizona for nurse hours. Total adjusted nursing hours per resident per day, combining RN, LPN, and aide time. CMS adjusts this for case-mix so facilities can be fairly compared.
4h 46m per day
Rank #11 / 71Nurse hours — State benchmarkedThis home is ranked 11th out of 71 homes in Arizona. Shows adjusted nurse hours per resident per day benchmarked to the Arizona average, with a ranking across 71 Arizona facilities. More hours mean more direct care. The national average is about 3.5 hrs; below 3.0 is a red flag.Rankings are based only on facilities in Arizona that report data for that category. Facilities without available data are excluded from the ranking.Click the rank badge to see the full State ranking.Click here to see the full State ranking.
This facility Arizona avg (4h 4m per day)
vs Arizona avg
+17%

1 of 6 metrics below state avg

Standout metric Registered Nurse (RN) is +125% above state avg
Staff typeHours / Day / Residentvs state avg
Registered Nurse (RN) Info RNs hold the highest nursing license and can assess residents, interpret test results, and direct care plans. More RN hours per day often signals stronger clinical oversight and faster response to health changes. 1h 37m per day ▲ 125% State avg: 43m per day · National avg: 41m per day
LPN / LVN Info Licensed Practical Nurses (LPNs) or Licensed Vocational Nurses (LVNs) deliver routine hands-on care — medication administration, wound dressing, and monitoring vital signs. They work under RN supervision and make up a large share of daily bedside care. 50m per day ▼ 20% State avg: 1h 3m per day · National avg: 52m per day
Nurse Aide Info Certified Nurse Aides (CNAs) provide the most direct day-to-day assistance: bathing, dressing, feeding, and mobility. Nurse aide hours are typically the largest staffing category and directly affect residents' quality of life. 2h 54m per day ▲ 22% State avg: 2h 22m per day · National avg: 2h 21m per day
Weekend Total Nursing Info Combined nursing hours (RN + LPN + Nurse Aide) per resident per day on weekends. Staffing often drops on weekends — this figure reveals whether the facility maintains adequate coverage outside of weekday hours. 4h 40m per day ▲ 28% State avg: 3h 38m per day · National avg: 3h 26m per day
Physical Therapist Info Hours per resident per day provided by licensed Physical Therapists (PTs) or PT Assistants. PT services help residents recover mobility after injury or illness and are especially important for post-acute (short-stay) rehabilitation. 12m per day ▲ 99% State avg: 6m per day · National avg: 4m per day
Weekend RN Info Registered nurse hours specifically on weekends. Facilities sometimes reduce RN presence on Saturdays and Sundays — a low weekend RN figure compared to weekday hours can indicate reduced clinical oversight when most administrative staff are absent. 1h 7m per day ▲ 117% State avg: 31m per day · National avg: 29m per day

Capacity and availability

This home usually has limited availability

Higher occupancy than the Arizona average: 72.7%
Occupancy rate
91.7% Rank #12 / 76Occupancy rate — State benchmarkedThis home is ranked 12th out of 76 homes in Arizona. Shows this facility's occupancy rate versus the Arizona average, with its Statewide rank out of 76. Higher occupancy signals strong local demand and financial stability.Rankings are based only on facilities in Arizona that report data for that category. Facilities without available data are excluded from the ranking.Click the rank badge to see the full State ranking.Click here to see the full State ranking.
Avg. Length of Stay
86 days
Bed community size
36-bed community
A moderately sized community that may balance personal attention with shared amenities and social activities.
Walk Score
Walk Score: 8 / 100
Car-dependent. Most errands require a car, with limited nearby walkable options.
BBB Rating
BBB Rating: A+ (Not Accredited)
An independent rating from the Better Business Bureau based on factors such as complaint history, transparency, and business practices.
How BBB ratings work

About this community

License Details

CMS Certification Number35272

Contact Vi at Grayhawk

Inspection History

In Arizona, the Department of Health Services, Bureau of Long Term Care Licensing performs regular onsite inspections and investigates complaints for all licensed residential and nursing facilities.

Since 2021 · 5 years of data 8 deficiencies
We don't publish a score for nursing homes with fewer than three inspections on record. This would unfairly reward providers with limited inspection history or those that have not been operating long enough to be cited.

Inspection score unavailable

Not enough inspection history to generate a score.

Average score for Arizona nursing homes: B- 82/100

Inspection score not available. Not enough inspection history to score against the Arizona benchmark.

Inspection Scorecard Info This scorecard compares key inspection, citation, and complaint metrics at this facility against the Arizona state average. Metrics rated ≥15% worse than average are highlighted in red; those ≥15% better are highlighted in green.

Since 2021 vs. Arizona state average
Overall vs. AZ average 0 Worse No metrics in this bucket. 3 Better Metrics better than Arizona average:
• Total deficiencies (11% below)
• Deficiencies per year (11% below)
• Enforcement actions (100% below)
Latest Inspection August 20, 2024 Complaint Investigation

Deficiencies Info Deficiencies are formal regulatory issues recorded during state inspections.

This FacilityAZ Averagevs. AZ Avg
Total deficiencies Info Formal regulatory issues recorded by inspectors across all inspection types. 89 This facility has 11% fewer total deficiencies than a typical Arizona nursing home (8 vs. AZ avg 9).↓ 11% better Rank #289 / 500 Total deficiencies — State benchmarked This home is ranked 289th out of 500 homes in Arizona. Shows this facility's deficiencies compared to the Arizona average among 500 comparable communities in the ranking pool. Rankings are based only on facilities in Arizona that report data for that category. Facilities without available data are excluded from the ranking.
Deficiencies per year Info Average deficiencies per year since 2021. 1.61.8 This facility has 11% fewer deficiencies per year than a typical Arizona nursing home (1.6 vs. AZ avg 1.8).↓ 11% better
Enforcement actions Info Formal penalties or interventions imposed by Arizona regulators — directed plans of correction, civil monetary penalties, denial of payment, or appointment of temporary management. 00.9 This facility has 100% fewer enforcement actions than a typical Arizona nursing home (0 vs. AZ avg 0.9).↓ 100% better

Inspection Reports Summary Info An editor-reviewed summary of the themes and findings across this facility's recent inspection reports.

  • The most recent inspection on August 20, 2024, substantiated a complaint but cited only one deficiency related to gait belt use during resident transfer.
  • The facility failed to ensure resident safety by not using a gait belt during transfer of resident #23, causing pain and a fall backward on the bed.
  • A February 27, 2024 inspection found unsafe oxygen tubing placement risking accidents, and a November 10, 2021 inspection noted infection control and treatment implementation deficiencies.

Health Inspection History

Inspections since 2021
Total health inspections 3

Arizona average 6.3


Last Health inspection on Aug 2024

Total health citations
4 Rank #2 / 75Health citations — State benchmarkedThis home is ranked 2nd out of 75 homes in Arizona. Shows this facility's total health deficiency citations benchmarked to the Arizona State average, with a ranking across all 75 AZ facilities. Lower citation counts earn a better rank.Rankings are based only on facilities in Arizona that report data for that category. Facilities without available data are excluded from the ranking.Click the rank badge to see the full State ranking.Click here to see the full State ranking.

Arizona average 23.2

Citations per inspection
1.33 Rank #1 / 75Citations per inspection — State benchmarkedThis home is ranked 1st out of 75 homes in Arizona. Shows average deficiency citations per CMS inspection for this facility versus the Arizona mean across 75 facilities with citation data. Lower is better.Rankings are based only on facilities in Arizona that report data for that category. Facilities without available data are excluded from the ranking.Click the rank badge to see the full State ranking.Click here to see the full State ranking.

Arizona average 3.82


Health citations are formal notices following inspections when they fail to comply with safety and care standards.

3 of 4 citations resulted from standard inspections; and 1 of 4 resulted from complaint investigations.

Breakdown of citation severity (last 5 years)
Critical health citations
0
100% better than Arizona average

Arizona average: 0.1


Serious health citations
0
100% better than Arizona average

Arizona average: 0.6

0 critical citations Arizona average: 0.1

0 serious citations Arizona average: 0.6

4 moderate citations Arizona average: 22.3

0 minor citations Arizona average: 0.2
Citations history (last 5 years)
Quality of Care moderate citation Aug 20, 2024
Corrected

Quality of Care moderate citation Feb 27, 2024
Corrected

Infection Control moderate citation Nov 10, 2021
Corrected

Quality of Care moderate citation Nov 10, 2021
Corrected

Staffing Data

Reporting period: October 1 – December 31, 2025 (Q4 2025). Source: CMS Payroll-Based Journal report.

Total staff 117
Employees 68
Contractors 49
Staff to resident ratio 3.90 : 1
116% more staff per resident than Arizona average
Arizona average ratio: 1.80 : 1 Arizona average ratio: 1.80 : 1See full Arizona ranking
Avg staff/day 28
Average shift 7.8 hours
8% worse than Arizona average
Arizona average: 8.5 hours Arizona average shift: 8.5 hoursSee full Arizona ranking
Total staff hours (quarter) 20,194

Nursing staff breakdown

Q4 2025 · Oct 1 – Dec 31 More info This data comes from the CMS Payroll-Based Journal report covering October 1 – December 31, 2025.
Registered Nurse

Manages medical care and health needs.

RN Staff Info All 11 RN Staff are full-time employees. No contractors work on this role. 11
Average shift length Info Average shift length. Calculated as total hours divided by days worked and average staff per day. 10.4 hours
Licensed Practical Nurse

Assists with medical care and medications.

LPN Staff Info 18 total: 10 full-time employees and 8 contractors. 18
Average shift length Info Average shift length. Calculated as total hours divided by days worked and average staff per day. 9.2 hours
Certified Nursing Assistant

Helps with daily care and mobility.

CNA Staff Info 63 total: 39 full-time employees and 24 contractors. 63
Average shift length Info Average shift length. Calculated as total hours divided by days worked and average staff per day. 8.2 hours

Contractor staffing

Q4 2025 · Oct 1 – Dec 31 More info This data comes from the CMS Payroll-Based Journal report covering October 1 – December 31, 2025.

Total hours from contractors

16%

3,233 contractor hours this quarter

Certified Nursing Assistant: 24 Licensed Practical Nurse: 8 Speech Language Pathologist: 5 Respiratory Therapy Technician: 3 Qualified Social Worker: 3 Physical Therapy Aide: 2 Physical Therapy Assistant: 2 Occupational Therapy Assistant: 1 Medical Director: 1

Staff by category

Q4 2025 · Oct 1 – Dec 31 More info This data comes from the CMS Payroll-Based Journal report covering October 1 – December 31, 2025.
Certified Nursing Assistant3924638,83692100%8.2
Registered Nurse110113,67592100%10.4
Licensed Practical Nurse108182,55892100%9.2
Other Dietary Services Staff3031,0779199%7.1
Nurse Practitioner2028347582%7.4
Respiratory Therapy Technician0336087177%5
Speech Language Pathologist0555396874%3.4
Clinical Nurse Specialist1014225762%7.4
Administrator1013955459%7.3
Dental Services Staff1013835257%7.4
Physical Therapy Assistant0222936975%4.2
Qualified Social Worker0332816166%4.4
Physical Therapy Aide0222716065%4.5
Occupational Therapy Assistant0112133%7
Medical Director011433%1.3
63 Certified Nursing Assistant
% of Days 100%
11 Registered Nurse
% of Days 100%
18 Licensed Practical Nurse
% of Days 100%
3 Other Dietary Services Staff
% of Days 99%
2 Nurse Practitioner
% of Days 82%
3 Respiratory Therapy Technician
% of Days 77%
5 Speech Language Pathologist
% of Days 74%
1 Clinical Nurse Specialist
% of Days 62%
1 Administrator
% of Days 59%
1 Dental Services Staff
% of Days 57%
2 Physical Therapy Assistant
% of Days 75%
3 Qualified Social Worker
% of Days 66%
2 Physical Therapy Aide
% of Days 65%
1 Occupational Therapy Assistant
% of Days 3%
1 Medical Director
% of Days 3%

Penalties and fines

Federal penalties imposed by CMS for regulatory violations, including civil money penalties (fines) and denials of payment for new Medicare/Medicaid admissions.

Source: CMS Penalties Database

No penalties in the past 3 years

No civil money penalties or payment denials were reported in the last 3 years.

Quality of care over time

These measures show how residents usually do over time at this home, based on health outcomes and preventive care.

High-risk clinical events score Info A composite score based on pressure ulcers, falls with injury, weight loss, walking ability decline, and activities of daily living decline. 8.4
11% worse than Arizona average

Arizona average: 7.6

Functional decline score Info A composite score based on activities of daily living decline, walking ability decline, and incontinence. 17.0
6% worse than Arizona average

Arizona average: 16.1

Long-stay resident measures
Significantly above average Arizona avg: 3.8 Info CMS star rating based on long-stay quality measure performance. 5 stars = significantly above average, 1 star = significantly below average.
Need for Help with Daily Activities Increased Info Percent of long-stay residents whose need for help with daily activities has increased 13.3%
19% worse than Arizona average

Arizona average: 11.2%

Walking Ability Worsened Info Percent of long-stay residents whose ability to move independently worsened 13.9%
12% better than Arizona average

Arizona average: 15.8%

Low Risk Residents with Bowel/Bladder Incontinence Info Percent of low risk long-stay residents who lose control of their bowels or bladder 23.9%
15% worse than Arizona average

Arizona average: 20.8%

Falls with Major Injury Info Percent of long-stay residents experiencing one or more falls with major injury 1.4%
35% better than Arizona average

Arizona average: 2.1%

High Risk Residents with Pressure Ulcers Info Percent of long-stay high risk residents with pressure ulcers 8.5%
67% worse than Arizona average

Arizona average: 5.1%

Urinary Tract Infection Info Percent of long-stay residents with a urinary tract infection 2.9%
113% worse than Arizona average

Arizona average: 1.3%

Lost Too Much Weight Info Percent of long-stay residents who lose too much weight 4.9%
9% better than Arizona average

Arizona average: 5.4%

Depressive Symptoms Info Percent of long-stay residents who have depressive symptoms 3.0%
33% better than Arizona average

Arizona average: 4.5%

Antipsychotic Use Info Percent of long-stay residents who received an antipsychotic medication 4.1%
60% better than Arizona average

Arizona average: 10.3%

Pneumococcal Vaccine Info Percent of long-stay residents assessed and appropriately given the pneumococcal vaccine 100.0%
In line with Arizona average

Arizona average: 97.2%

Influenza Vaccine Info Percent of long-stay residents assessed and appropriately given the seasonal influenza vaccine 95.0%
In line with Arizona average

Arizona average: 94.6%

Hospitalizations per 1,000 days Info Number of hospitalizations per 1,000 long-stay resident days. 2.60
55% worse than Arizona average

Arizona average: 1.68

ED visits per 1,000 days Info Number of outpatient emergency department visits per 1,000 long-stay resident days. 0.54
64% better than Arizona average

Arizona average: 1.48

Short-stay resident measures
Significantly above average Arizona avg: 4.2 Info CMS star rating based on short-stay quality measure performance. 5 stars = much above average, 1 star = much below average.
Pneumococcal Vaccine Info Percent of short-stay residents assessed and appropriately given the pneumococcal vaccine 98.6%
8% better than Arizona average

Arizona average: 91.5%

Antipsychotic medication increase Info Percent of short-stay residents who newly received an antipsychotic medication 0.8%
22% better than Arizona average

Arizona average: 1.0%

Influenza Vaccine Info Percent of short-stay residents assessed and appropriately given the seasonal influenza vaccine 99.0%
13% better than Arizona average

Arizona average: 87.3%

Re-hospitalized after SNF stay Info Percentage of short-stay residents who were re-hospitalized after their nursing home admission. 18.8%
24% better than Arizona average

Arizona average: 24.6%

Emergency department visits Info Percentage of short-stay residents who had an outpatient emergency department visit. 12.4%
16% worse than Arizona average

Arizona average: 10.7%

Falls with major injury Info Percentage of SNF residents who experience falls with major injury during their stay. 0.7%
8% better than Arizona average

Arizona average: 0.8%

Ability to care for self at discharge Info Percentage of residents at or above expected ability to care for themselves at discharge. 67.2%
25% better than Arizona average

Arizona average: 53.7%

Successful return to home or community Info Rate of successful return to home or community from a skilled nursing facility. 64.5%
28% better than Arizona average

Arizona average: 50.6%

Breakdown by payment type

Medicare

72% of new residents, usually for short-term rehab.

Typical stay 1 months

Private pay

28% of new residents, often for short stays.

Typical stay 7 - 8 months

Facility Characteristics

Source: CMS Long-Term Care Facility Characteristics (Data as of Jan 2026)

Total residents 30
Medicare
9
30% of residents
Private pay or other
21
70% of residents
Programs & Services
Residents Group

Residents meet regularly to discuss policies, care quality, and activities

CCRC

Part of a Continuing Care Retirement Community offering multiple care levels

Active Resident Council

Organized group of residents that meets regularly to discuss facility policies, quality of life, and activities.

Finances and operations

Based on CMS SNF Cost Report for fiscal year ending in 12/2023.

Privately-owned community
Operated by a business corporation.
Net patient revenue Info Net patient revenue — what the home actually collects for resident care, after contractual allowances, bad debt and discounts are subtracted from its gross charges (CMS cost report, Worksheet G-3). It covers resident care only; money the home earns from other sources is shown separately as "Other income."
$7.0M
Net patient income Info Net patient income: net patient revenue minus the home's total operating expenses. A positive figure means it earns more from resident care than it spends to deliver it; a negative figure means the opposite. It excludes non-operating "other income."
-$10.3M
Privately-owned community Operated by a business corporation.
Net patient revenue Info Net patient revenue — what the home actually collects for resident care, after contractual allowances, bad debt and discounts are subtracted from its gross charges (CMS cost report, Worksheet G-3). It covers resident care only; money the home earns from other sources is shown separately as "Other income."
$7.0M Rank #6 / 79Revenue — State benchmarkedThis home is ranked 6th out of 79 homes in Arizona. Shows this facility's annual revenue compared to the Arizona average. Higher revenue generally means more resources for staffing and capital — read alongside Payroll %.Rankings are based only on facilities in Arizona that report data for that category. Facilities without available data are excluded from the ranking.Click the rank badge to see the full State ranking.Click here to see the full State ranking.
Net patient income Info Net patient income: net patient revenue minus the home's total operating expenses. A positive figure means it earns more from resident care than it spends to deliver it; a negative figure means the opposite. It excludes non-operating "other income."
-$10.3M
Other income Info Money the home earns outside of resident care — such as investments, grants, rentals and other non-operating sources (CMS cost report, Worksheet G-3). It is tracked separately from net patient revenue: it is not part of that figure, and it is not included in net patient income.
$28.1M
Payroll costs Info Staff salaries plus wage-related costs — benefits such as payroll taxes, health insurance and retirement — from the home's own accounting records (CMS cost report, Worksheet A). Contract or agency labor is counted separately, under other operating costs. Rank #38 / 79Payroll — State benchmarkedThis home is ranked 38th out of 79 homes in Arizona. Shows total annual staff payroll benchmarked to the Arizona average. Higher payroll investment relative to peers often signals better staffing and less reliance on cheaper contract labor.Rankings are based only on facilities in Arizona that report data for that category. Facilities without available data are excluded from the ranking.Click the rank badge to see the full State ranking.Click here to see the full State ranking.
$6.1M 87.2% of net patient revenue Info Payroll as a share of revenue: staff salaries and wage-related benefits divided by net patient revenue. A higher figure means more of each revenue dollar goes to staff pay. Rank #78 / 79Payroll % — State benchmarkedThis home is ranked 78th out of 79 homes in Arizona. Shows payroll as a percentage of revenue versus the Arizona average. Well-run Arizona facilities typically land around 58–71% — the top third Statewide. Below 25% may signal understaffing or heavy agency use — read with Staffing ratings.Rankings are based only on facilities in Arizona that report data for that category. Facilities without available data are excluded from the ranking.Click the rank badge to see the full State ranking.Click here to see the full State ranking.
Other operating costs Info Everything it costs to run the home apart from payroll — food, utilities, supplies, maintenance, contract labor and administration. Calculated as total operating expense minus payroll (staff salaries and wage-related benefits).
$11.2M
Total costs Info The home's total operating expense for the year — all the costs of running it, salaries included (CMS cost report, Worksheet G-3).
$17.3M

Who this home usually serves

TYPE OF STAY

Mostly short-term rehab stays

Most residents typically stay for a few weeks or months before returning home or moving on.

Most new residents arrive under Medicare (72% of admissions), and a typical Medicare stay runs around 1 months.

Admissions
129 total

Coverage residents most often arrive under.

Medicare 72%
Private pay 28%
Discharges
133 total

Coverage residents most often leave under.

Medicare 72%
Private pay 28%

Places of interest near Vi at Grayhawk

Address 12.5 miles from city center Info Estimated distance in miles from Scottsdale's city center to Vi at Grayhawk's address, calculated via Google Maps. — 0.28 miles to nearest hospital (HonorHealth Scottsdale Thompson Peak Medical Center)

Calculate Travel Distance to Vi at Grayhawk

Add your location

Address

Compare Nursing Homes around Scottsdale

The information below is reported by the Arizona Department of Health Services, Bureau of Long Term Care Licensing.

4 facilities compared · CMS & AZ Dept. of Health data

Vi at Grayhawk
NH
AL
IL
MC
Scottsdale (Grayhawk)36
91.7%
Facility 91.7%
AZ AVG 72.7%
Rank #12 / 76
+26%
4.77
Facility 4.77
AZ AVG 4.06
Rank #11 / 71
-6%+17%
$0
Facility $0
AZ AVG $31.7k
Rank #1 / 75
-
4
Facility 4
AZ AVG 23.2
Rank #2 / 75
1.3
Facility 1.3
AZ AVG 3.8
Rank #1 / 75
-33A+ 8 Cc Scottsdale Inc
$7.0M
Facility $7.0M
AZ AVG $14.7M
Rank #6 / 79
$6.1M
Facility $6.1M
AZ AVG $6.4M
Rank #38 / 79
87.2%
Facility 87.2%
AZ AVG 48.1%
Rank #78 / 79
35272
Vi at Silverstone
NH
AL
IL
MC
Scottsdale (North Scottsdale)24
83.9%
Facility 83.9%
AZ AVG 72.7%
Rank #27 / 76
+15%
5.65
Facility 5.65
AZ AVG 4.06
Rank #4 / 71
+84%+39%
$0
Facility $0
AZ AVG $31.7k
Rank #1 / 75
-
5
Facility 5
AZ AVG 23.2
Rank #4 / 75
1.7
Facility 1.7
AZ AVG 3.8
Rank #2 / 75
-21- 43 Cc-Silverstone, Inc
$5.0M
Facility $5.0M
AZ AVG $14.7M
Rank #5 / 79
$5.5M
Facility $5.5M
AZ AVG $6.4M
Rank #49 / 79
109.6%
Facility 109.6%
AZ AVG 48.1%
Rank #79 / 79
35281
Plaza Healthcare
NH
Scottsdale (South Scottsdale)179
73.2%
Facility 73.2%
AZ AVG 72.7%
Rank #36 / 76
+1%
3.42
Facility 3.42
AZ AVG 4.06
Rank #55 / 71
+109%-16%
$0
Facility $0
AZ AVG $31.7k
Rank #1 / 75
75
Facility 75
AZ AVG 82
Rank #19 / 53
10
Facility 10
AZ AVG 23.2
Rank #11 / 75
3.3
Facility 3.3
AZ AVG 3.8
Rank #29 / 75
-133- 59 Dmsi LLC
$34.2M
Facility $34.2M
AZ AVG $14.7M
Rank #4 / 79
$21.4M
Facility $21.4M
AZ AVG $6.4M
Rank #4 / 79
62.7%
Facility 62.7%
AZ AVG 48.1%
Rank #44 / 79
35084
Life Care Center of Scottsdale
NH
Scottsdale (Central Scottsdale)132
34.1%
Facility 34.1%
AZ AVG 72.7%
Rank #72 / 76
-53%
4.12
Facility 4.12
AZ AVG 4.06
Rank #25 / 71
-39%+1%
$6.4k
Facility $6.4k
AZ AVG $31.7k
Rank #58 / 75
70
Facility 70
AZ AVG 82
Rank #35 / 53
25
Facility 25
AZ AVG 23.2
Rank #42 / 75
5.0
Facility 5.0
AZ AVG 3.8
Rank #58 / 75
154- 38 Cheryl Wartenberg
$6.9M
Facility $6.9M
AZ AVG $14.7M
Rank #47 / 79
$4.8M
Facility $4.8M
AZ AVG $6.4M
Rank #67 / 79
69.4%
Facility 69.4%
AZ AVG 48.1%
Rank #59 / 79
35143

Financial Assistance for
Nursing Home in Arizona

Vi at Grayhawk is located in Scottsdale, Arizona.
Here are the financial assistance programs available to residents in Arizona.

Get Financial aid guidance

Arizona Long Term Care System

ALTCS

Age 65+ or disabled
General Arizona resident, Medicaid-eligible, nursing home-level care need.
Income Limits (2025) ~$2,829/month 300% FBR, individual
Asset Limits $2,000 (individual), $3,000 (couple).
AZ

Covers tribal members; rural outreach.

Benefits
In-home care (6-8 hours/day) Assisted living Nursing home care Medical services Transportation (10 trips/month)

Non-Medical Home and Community Based Services

AZ DES Non-Medical HCBS

Age 60+
General Arizona resident, at risk of institutionalization.
Income Limits ~$2,000/month individual, varies
Asset Limits $10,000 individual
AZ

Limited funding; waitlists common.

Benefits
Homemaker services (3-5 hours/week) Respite care (up to 10 days/year) Adult day care (~$60/day)

Weatherization Assistance Program (WAP)

AZ WAP

Age 60+ priority
General Arizona resident, own/rent home, low-income.
Income Limits (2025) ~$2,510/month 200% of poverty level, individual
Asset Limits Not applicable; income-focused.
AZ

High demand in rural desert areas; limited annual funds.

Benefits
Insulation Weather stripping HVAC repairs (avg. $500-$1,000/year savings)

Section 202 Supportive Housing for the Elderly

AZ Section 202

Age 62+
General Arizona resident, very low income, able to live independently with support.
Income Limits (2025) ~$1,645/month 50% of area median income, individual, varies by county
Asset Limits $10,000 individual, excludes home if owned
AZ

Limited units; high demand in metro areas like Phoenix.

Benefits
Subsidized rent (30% of income, e.g., $300-$500/month) On-site services (housekeeping, transportation, ~$200/month value)

Arizona CARES Program

AZ CARES

Age
General Caregivers of Arizona residents 60+ needing help with 3+ daily activities; no caregiver age limit.
Income Limits No strict limit; cost-sharing above ~$2,500/month threshold.
Asset Limits Not applicable; need-based.
AZ

Focus on rural access; complements ALTCS respite.

Benefits
Respite care (up to 10 days/year) Counseling (4-6 sessions/year) Training (2-3 workshops/year) Supplies (~$200/year)

AZ DES Non-Medical Home and Community Based Services (HCBS)

AZ DES Non-Medical HCBS

Age 60+ or disabled
General Arizona resident, need assistance with daily activities, not eligible for Medicaid/ALTCS.
Income Limits Above Medicaid threshold but low-income ~$1,500-$2,500/month, varies by region
Asset Limits Not specified; income-driven eligibility.
AZ

Targets those ineligible for ALTCS; prioritizes rural and tribal areas.

Benefits
Homemaker services (3-5 hours/week) Personal care (limited hours) Respite care (up to 10 days/year) Transportation (~5 trips/month)

Frequently Asked Questions about Vi at Grayhawk

What neighborhood is Vi at Grayhawk in?

Vi at Grayhawk is in the Grayhawk neighborhood of Scottsdale.

Is Vi at Grayhawk in a walkable area?

Vi at Grayhawk has a walk score of 8. Car-dependent. Most errands require a car, with limited nearby walkable options.

What is the occupancy rate at Vi at Grayhawk?

Vi at Grayhawk's occupancy is 34.8%.

Are there photos of Vi at Grayhawk?

Yes — there are 6 photos of Vi at Grayhawk in the photo gallery on this page.

What is the address of Vi at Grayhawk?

Vi at Grayhawk is located at 7501 E Thompson Peak Pkwy, Scottsdale, AZ 85255.

What is the phone number of Vi at Grayhawk?

(888) 676-8171 will put you in contact with the team at Vi at Grayhawk.

Is Vi at Grayhawk Medicare or Medicaid certified?

Yes — Vi at Grayhawk is a CMS-certified provider of Medicare and Medicaid.

Guides for Better Senior Living

Care Cost Calculator: See Prices in Your Area

Nursing Home Data Explorer

Don’t Wait Too Long: 7 Red Flag Signs Your Parent Needs Assisted Living Now

The True Cost of Assisted Living in 2025 – And How Families Are Paying For It

Understanding Senior Living Costs: Pricing Models, Discounts & Financial Assistance