Wellpark Health and Rehabilitation
CMS overall rating Info CMS (the Centers for Medicare & Medicaid Services) is the federal agency that rates nursing home quality. Its Overall Rating runs from 1 to 5 stars, combining health inspections, staffing, and quality measures, with inspections weighted most heavily.

Wellpark Health and Rehabilitation

CMS overall rating Info CMS (the Centers for Medicare & Medicaid Services) is the federal agency that rates nursing home quality. Its Overall Rating runs from 1 to 5 stars, combining health inspections, staffing, and quality measures, with inspections weighted most heavily.
Calculator: See prices in your area
Wellpark Health and Rehabilitation accepts Medicaid, Medicare, and private pay.

Overview of Wellpark Health and Rehabilitation

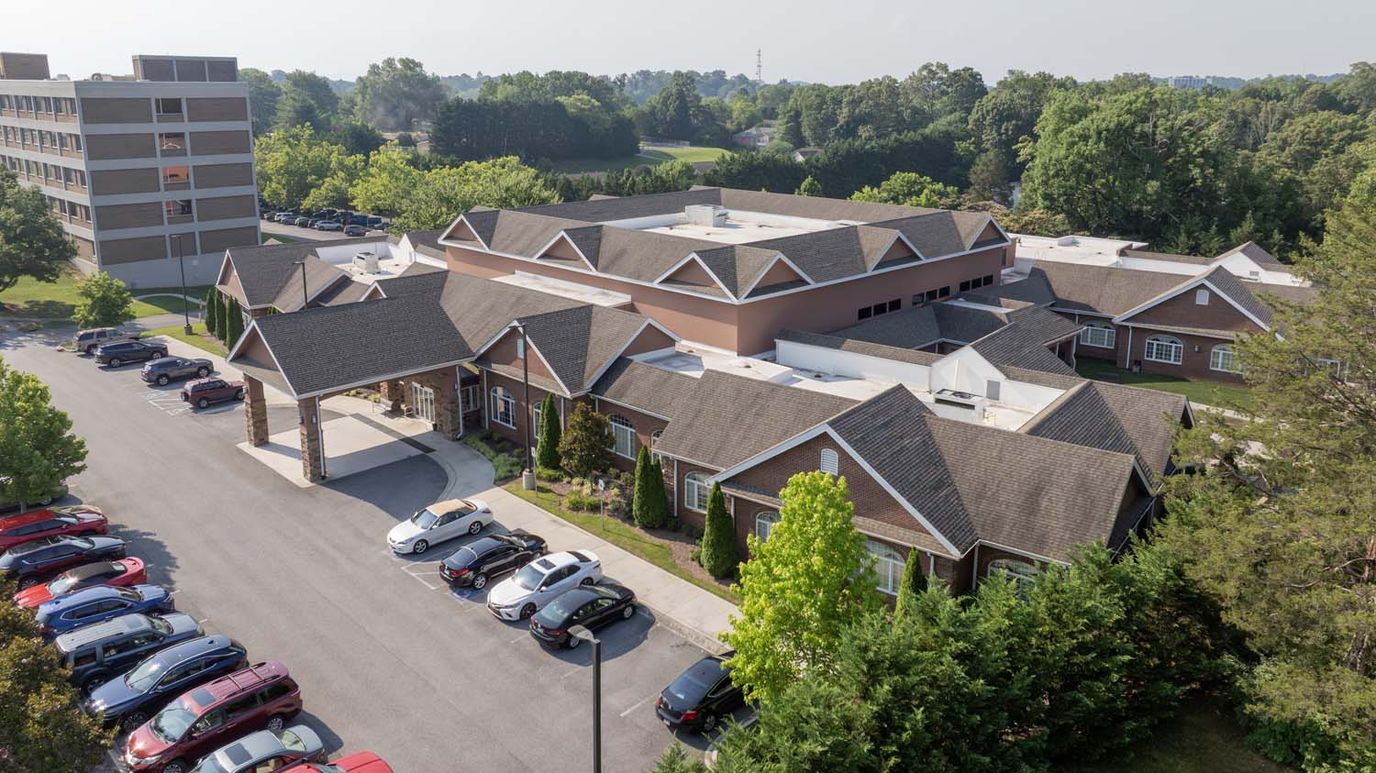
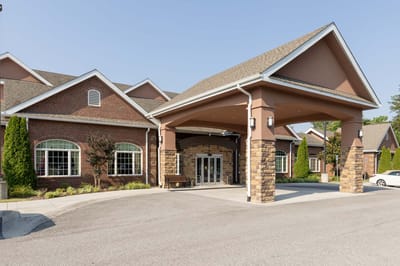
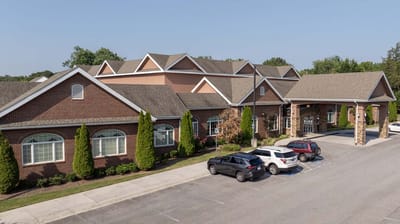
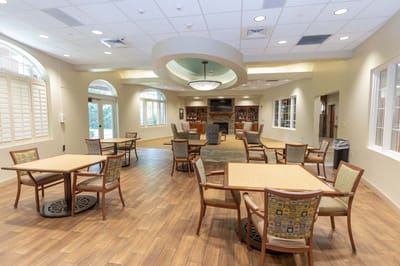
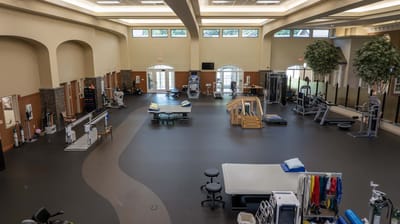
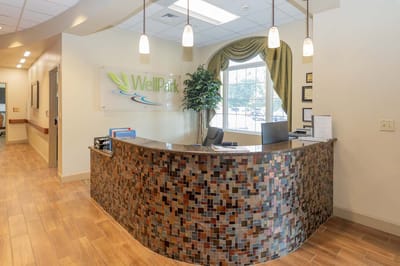
Wellpark Health and Rehabilitation is a nursing home in Knoxville, Tennessee, offering nursing, memory care, and physician-guided therapies, backed by 24-hour staffing and an on-site medical doctor. Operating since October 2015, this 32-bed community is owned by River Bluff Healthcare, Inc., and runs under the nonprofit, church-operated umbrella of Presbyterian Homes of Tennessee, Inc. The community also accommodates individuals utilizing Medicare or private funds and holds an overall 3-star quality rating from CMS.

Regulatory history from the Tennessee Department of Health cited 3 inspections over a seven-year tracking window. The community accumulated 15 total health citations, closely mirroring the state baseline of 15.4. Crucially, every citation was categorized exclusively at a moderate severity level, with zero serious or critical deficiencies on record. The most recent review on January 24, 2025, also cited deficiencies concerning infection control, pharmacy practices, and abuse or neglect prevention, all of which are now documented as fully corrected. No monetary fines have been issued within the past three years.

The community’s nursing staff provides 3 hours and 56 minutes of direct daily care to each resident, outperforming the Tennessee state average by 7%. Weekend coverage remains exceptionally steady at 4 hours and 11 minutes per resident daily, ensuring care levels do not drop outside standard business hours. Second-quarter 2025 records show a total workforce of 92 individuals, consisting of 49 regular employees and 43 contractors. This establishes an excellent staff-to-resident ratio of 3.07 to 1, marking a 71% improvement over the statewide benchmark.

Clinical data show specialized strengths, particularly in short-term preventative medicine. Short-stay individuals receive influenza and pneumococcal immunizations at rates of 95.6% and 93.1%, beating state benchmarks by 20% and 17%, respectively. Furthermore, new antipsychotic drug prescriptions affect just 1.0% of temporary residents, showing a 42% reduction compared to state averages. These metrics support a strong short-term recovery focus, where the average overall stay is 15 days, while Medicare-supported individuals average 18 days.

Wellpark Health and Rehabilitation is a highly suitable option for older adults and families seeking a faith-affiliated environment with excellent staffing ratios and a clean penalty record, especially when transitioning out of a hospital stay for post-acute physical rehabilitation.

Quality ratings

Measured by Centers for Medicare & Medicaid Services (CMS)

Overall rating Info The Overall CMS Rating combines results from health inspections, staffing levels and quality measures. Health inspections carry the most weight. Staffing and quality scores can increase or decrease the final rating based on performance compared to state and national standards.
▲ 5.9% Above TN avg. ▲ 5.9% Above TN avg.TN average: 2.8Click the badge to see the full State ranking.Click here to see the full State ranking.
Health Inspection Info Based on the results of the facility's three most recent standard inspections and any complaint investigations. CMS reviews the number, scope, and severity of deficiencies, with more recent findings weighted more heavily.
▲ 7.7% Above TN avg. ▲ 7.7% Above TN avg.TN average: 2.8Click the badge to see the full State ranking.Click here to see the full State ranking.
Staffing Info Measures average nursing staff hours per resident per day, including Registered Nurses (RNs) and total nursing staff. Ratings are adjusted based on the level of care residents require and are compared to state and national benchmarks.
▼ 58.6% Below TN avg. ▼ 58.6% Below TN avg.TN average: 2.4Click the badge to see the full State ranking.Click here to see the full State ranking.
Quality Measures Info Based on clinical and physical health indicators reported to CMS, such as hospital readmissions, falls, pressure ulcers, and improvements in mobility. These measures reflect how well residents' health needs are being managed.
▲ 45.3% Above TN avg. ▲ 45.3% Above TN avg.TN average: 3.4Click the badge to see the full State ranking.Click here to see the full State ranking.

Staffing hours breakdown

Info Daily nursing hours per resident by staff type, reported to CMS. Higher is generally better — compare this facility to state and national averages to see where staffing stands.

Hours per resident per day — compared to Tennessee state averages

Total nursing care / resident Info This home is ranked 41st out of 192 homes in Tennessee for nurse hours. Total adjusted nursing hours per resident per day, combining RN, LPN, and aide time. CMS adjusts this for case-mix so facilities can be fairly compared.
3h 56m per day
Rank #41 / 192Nurse hours — State benchmarkedThis home is ranked 41st out of 192 homes in Tennessee. Shows adjusted nurse hours per resident per day benchmarked to the Tennessee average, with a ranking across 192 Tennessee facilities. More hours mean more direct care. The national average is about 3.5 hrs; below 3.0 is a red flag.Rankings are based only on facilities in Tennessee that report data for that category. Facilities without available data are excluded from the ranking.Click the rank badge to see the full State ranking.Click here to see the full State ranking.
This facility Tennessee avg (3h 38m per day)
vs Tennessee avg
+8%

0 of 1 metrics below state avg

Standout metric Weekend Total Nursing is +25% above state avg
Staff typeHours / Day / Residentvs state avg
Weekend Total Nursing Info Combined nursing hours (RN + LPN + Nurse Aide) per resident per day on weekends. Staffing often drops on weekends — this figure reveals whether the facility maintains adequate coverage outside of weekday hours. 4h 11m per day ▲ 25% State avg: 3h 21m per day · National avg: 3h 27m per day

Capacity and availability

Avg. Length of Stay
15 days
Bed community size
32-bed community Rank #406 / 426Bed count — State benchmarkedThis home is ranked 406th out of 426 homes in Tennessee. Shows this facility's certified or reported bed count compared to other Tennessee facilities. Larger communities may offer more amenities, programs, and on-site services for residents and families.Rankings are based only on facilities in Tennessee that report data for that category. Facilities without available data are excluded from the ranking.Click the rank badge to see the full State ranking.Click here to see the full State ranking.
A moderately sized community that may balance personal attention with shared amenities and social activities.
Years in operation
10 years in operation Rank #330 / 385Years in operation — State benchmarkedThis home is ranked 330th out of 385 homes in Tennessee. Shows how long this facility has been in operation compared to other Tennessee facilities. Longer operating histories may benefit residents, families, and staff.Rankings are based only on facilities in Tennessee that report data for that category. Facilities without available data are excluded from the ranking.Click the rank badge to see the full State ranking.Click here to see the full State ranking.
A community with a solid operating history and experience delivering ongoing care.
Walk Score
Walk Score: 27 / 100 Rank #328 / 553Walk Score — State benchmarkedThis home is ranked 328th out of 553 homes in Tennessee. Shows how walkable this facility's neighborhood is compared to the average Walk Score across Tennessee facilities. Higher scores benefit residents, families, and staff.Rankings are based only on facilities in Tennessee that report data for that category. Facilities without available data are excluded from the ranking.Click the rank badge to see the full State ranking.Click here to see the full State ranking.
Somewhat walkable. A few nearby services may be reachable on foot, but most trips require transportation.

About this community

Occupancy

Occupancy rate
100%
Rank #35 / 319Occupancy rate — State benchmarkedThis home is ranked 35th out of 319 homes in Tennessee. Shows this facility's occupancy rate versus the Tennessee average, with its Statewide rank out of 319. Higher occupancy signals strong local demand and financial stability.Rankings are based only on facilities in Tennessee that report data for that category. Facilities without available data are excluded from the ranking.Click the rank badge to see the full State ranking.Click here to see the full State ranking.
Higher than the Tennessee average: 71.6%
Occupied beds
32 / 32
Average occupied beds in Tennessee homes 82 beds

License Details

Facility TypeNursing Home
StatusLicensed
IssuanceOctober 19, 2015
ExpirationOctober 18, 2026
License Number00000404
CMS Certification Number445523

Ownership & Operating Entity

Wellpark Health and Rehabilitation is administered by Kyle Albrechtsen.

Owner NameRiver Bluff Healthcare, Inc

Payment & Insurance

2 services
Accept Medicaid
Accept Medicare

Therapy & Rehabilitation

1 service
Rehabilitation Services

Staffing & Medical

2 services
Doctor on Staff
24-Hour Staffing

Amenities & Lifestyle

Specific ProgramsIn-House Therapy, Outpatient Therapy
Religious ServicesYes

Contact Wellpark Health and Rehabilitation

Inspection History

In Tennessee, the Department of Health, Division of Health Care Facilities performs unannounced inspections and investigations to ensure facilities provide high-quality resident care.

Since 2019 · 7 years of data 15 citations

Inspection Scorecard Info This scorecard compares key inspection, citation, and complaint metrics at this facility against the Tennessee state average. Metrics rated ≥15% worse than average are highlighted in red; those ≥15% better are highlighted in green.

Since 2019 vs. Tennessee state average
Overall vs. TN average 2 Worse Metrics worse than Tennessee average:
• Total citations (275% above)
• Citations per year (250% above)
0 Better No metrics in this bucket.
Latest Inspection May 25, 2022

Citations Info Citations are formal regulatory issues recorded during state inspections.

This FacilityTN Averagevs. TN Avg
Total citations Info Formal regulatory issues recorded by inspectors across all inspection types. 154 This facility has 275% more total citations than a typical Tennessee nursing home (15 vs. TN avg 4).↑ 275% worse
Citations per year Info Average citations per year since 2019. 2.10.6 This facility has 250% more citations per year than a typical Tennessee nursing home (2.1 vs. TN avg 0.6).↑ 250% worse

Health Inspection History

Inspections since 2019
Total health inspections 3

Tennessee average 3.5


Last Health inspection on Jan 2025

Total health citations
15 Rank #96 / 196Health citations — State benchmarkedThis home is ranked 96th out of 196 homes in Tennessee. Shows this facility's total health deficiency citations benchmarked to the Tennessee State average, with a ranking across all 196 TN facilities. Lower citation counts earn a better rank.Rankings are based only on facilities in Tennessee that report data for that category. Facilities without available data are excluded from the ranking.Click the rank badge to see the full State ranking.Click here to see the full State ranking.

Tennessee average 15.4

Citations per inspection
5 Rank #122 / 196Citations per inspection — State benchmarkedThis home is ranked 122nd out of 196 homes in Tennessee. Shows average deficiency citations per CMS inspection for this facility versus the Tennessee mean across 196 facilities with citation data. Lower is better.Rankings are based only on facilities in Tennessee that report data for that category. Facilities without available data are excluded from the ranking.Click the rank badge to see the full State ranking.Click here to see the full State ranking.

Tennessee average 4.39


Health citations are formal notices following inspections when they fail to comply with safety and care standards.

14 of 15 citations resulted from standard inspections; and 1 of 15 resulted from complaint investigations.

Breakdown of citation severity (last 7 years)
Critical health citations
0
100% better than Tennessee average

Tennessee average: 1.1


Serious health citations
0
100% better than Tennessee average

Tennessee average: 0.6

0 critical citations Tennessee average: 1.1

0 serious citations Tennessee average: 0.6

15 moderate citations Tennessee average: 13.7

0 minor citations Tennessee average: 0.1
Citations history (last 7 years)
Abuse/Neglect moderate citation Jan 24, 2025
Corrected

Infection Control moderate citation Jan 24, 2025
Corrected

Infection Control moderate citation Jan 24, 2025
Corrected

Pharmacy moderate citation Jan 24, 2025
Corrected

Staffing Data

Reporting period: July 1 – September 30, 2025 (Q3 2025). Source: CMS Payroll-Based Journal report.

Total staff 89
Employees 64
Contractors 25
Staff to resident ratio 2.97 : 1
70% more staff per resident than Tennessee average
Tennessee average ratio: 1.75 : 1 Tennessee average ratio: 1.75 : 1See full Tennessee ranking
Avg staff/day 21
Average shift 8.3 hours
0% compared with Tennessee average
Tennessee average: 8.3 hours Tennessee average shift: 8.3 hoursSee full Tennessee ranking
Total staff hours (quarter) 16,092

Nursing staff breakdown

Q3 2025 · Jul 1 – Sep 30 More info This data comes from the CMS Payroll-Based Journal report covering July 1 – September 30, 2025.
Registered Nurse

Manages medical care and health needs.

RN Staff Info All 3 RN Staff are full-time employees. No contractors work on this role. 3
Average shift length Info Average shift length. Calculated as total hours divided by days worked and average staff per day. 12.6 hours
Licensed Practical Nurse

Assists with medical care and medications.

LPN Staff Info 17 total: 9 full-time employees and 8 contractors. 17
Average shift length Info Average shift length. Calculated as total hours divided by days worked and average staff per day. 8.6 hours
Certified Nursing Assistant

Helps with daily care and mobility.

CNA Staff Info 33 total: 16 full-time employees and 17 contractors. 33
Average shift length Info Average shift length. Calculated as total hours divided by days worked and average staff per day. 9.7 hours

Contractor staffing

Q3 2025 · Jul 1 – Sep 30 More info This data comes from the CMS Payroll-Based Journal report covering July 1 – September 30, 2025.

Total hours from contractors

4.2%

676 contractor hours this quarter

Certified Nursing Assistant: 17 Licensed Practical Nurse: 8

Staff by category

Q3 2025 · Jul 1 – Sep 30 More info This data comes from the CMS Payroll-Based Journal report covering July 1 – September 30, 2025.
Certified Nursing Assistant1617335,68192100%9.7
Licensed Practical Nurse98172,76492100%8.6
Registered Nurse3031,4718997%12.6
Physical Therapy Assistant7071,3607480%7.4
Physical Therapy Aide9091,0777379%6.8
Speech Language Pathologist6069676773%7
Respiratory Therapy Technician4046136874%6.9
Clinical Nurse Specialist2025406166%8.6
Nurse Practitioner1015046368%8
Dental Services Staff1014825863%8.3
Qualified Social Worker4044616975%5.6
Other Dietary Services Staff1011672830%6
Administrator101667%1
33 Certified Nursing Assistant
% of Days 100%
17 Licensed Practical Nurse
% of Days 100%
3 Registered Nurse
% of Days 97%
7 Physical Therapy Assistant
% of Days 80%
9 Physical Therapy Aide
% of Days 79%
6 Speech Language Pathologist
% of Days 73%
4 Respiratory Therapy Technician
% of Days 74%
2 Clinical Nurse Specialist
% of Days 66%
1 Nurse Practitioner
% of Days 68%
1 Dental Services Staff
% of Days 63%
4 Qualified Social Worker
% of Days 75%
1 Other Dietary Services Staff
% of Days 30%
1 Administrator
% of Days 7%

Penalties and fines

Federal penalties imposed by CMS for regulatory violations, including civil money penalties (fines) and denials of payment for new Medicare/Medicaid admissions.

Source: CMS Penalties Database

No penalties in the past 3 years

No civil money penalties or payment denials were reported in the last 3 years.

Quality of care over time

These measures show how residents usually do over time at this home, based on health outcomes and preventive care.

Short-stay resident measures
Pneumococcal Vaccine Info Percent of short-stay residents assessed and appropriately given the pneumococcal vaccine 93.1%
17% better than Tennessee average

Tennessee average: 79.7%

Antipsychotic medication increase Info Percent of short-stay residents who newly received an antipsychotic medication 1.0%
42% better than Tennessee average

Tennessee average: 1.7%

Influenza Vaccine Info Percent of short-stay residents assessed and appropriately given the seasonal influenza vaccine 95.6%
20% better than Tennessee average

Tennessee average: 79.8%

Breakdown by payment type

Medicare

45% of new residents, usually for short-term rehab.

Typical stay 18 days

Private pay

55% of new residents, often for short stays.

Typical stay 15 days

Facility Characteristics

Source: CMS Long-Term Care Facility Characteristics (Data as of Jan 2026)

Total residents 30
Medicare
28
93.3% of residents
Private pay or other
2
6.7% of residents

Finances and operations

Based on CMS SNF Cost Report for fiscal year ending in 12/2023.

Privately-owned community
Operated by a single business entity.
Net patient revenue Info Net patient revenue — what the home actually collects for resident care, after contractual allowances, bad debt and discounts are subtracted from its gross charges (CMS cost report, Worksheet G-3). It covers resident care only; money the home earns from other sources is shown separately as "Other income."
$2.3M
Net patient income Info Net patient income: net patient revenue minus the home's total operating expenses. A positive figure means it earns more from resident care than it spends to deliver it; a negative figure means the opposite. It excludes non-operating "other income."
-$1.4M
Privately-owned community Operated by a single business entity.
Net patient revenue Info Net patient revenue — what the home actually collects for resident care, after contractual allowances, bad debt and discounts are subtracted from its gross charges (CMS cost report, Worksheet G-3). It covers resident care only; money the home earns from other sources is shown separately as "Other income."
$2.3M Rank #193 / 196Revenue — State benchmarkedThis home is ranked 193rd out of 196 homes in Tennessee. Shows this facility's annual revenue compared to the Tennessee average. Higher revenue generally means more resources for staffing and capital — read alongside Payroll %.Rankings are based only on facilities in Tennessee that report data for that category. Facilities without available data are excluded from the ranking.Click the rank badge to see the full State ranking.Click here to see the full State ranking.
Net patient income Info Net patient income: net patient revenue minus the home's total operating expenses. A positive figure means it earns more from resident care than it spends to deliver it; a negative figure means the opposite. It excludes non-operating "other income."
-$1.4M
Other income Info Money the home earns outside of resident care — such as investments, grants, rentals and other non-operating sources (CMS cost report, Worksheet G-3). It is tracked separately from net patient revenue: it is not part of that figure, and it is not included in net patient income.
$17.4K
Payroll costs Info Staff salaries plus wage-related costs — benefits such as payroll taxes, health insurance and retirement — from the home's own accounting records (CMS cost report, Worksheet A). Contract or agency labor is counted separately, under other operating costs. Rank #189 / 196Payroll — State benchmarkedThis home is ranked 189th out of 196 homes in Tennessee. Shows total annual staff payroll benchmarked to the Tennessee average. Higher payroll investment relative to peers often signals better staffing and less reliance on cheaper contract labor.Rankings are based only on facilities in Tennessee that report data for that category. Facilities without available data are excluded from the ranking.Click the rank badge to see the full State ranking.Click here to see the full State ranking.
$2.2M 94.8% of net patient revenue Info Payroll as a share of revenue: staff salaries and wage-related benefits divided by net patient revenue. A higher figure means more of each revenue dollar goes to staff pay. Rank #6 / 196Payroll % — State benchmarkedThis home is ranked 6th out of 196 homes in Tennessee. Shows payroll as a percentage of revenue versus the Tennessee average. Well-run Tennessee facilities typically land around 50–60% — the top third Statewide. Below 25% may signal understaffing or heavy agency use — read with Staffing ratings.Rankings are based only on facilities in Tennessee that report data for that category. Facilities without available data are excluded from the ranking.Click the rank badge to see the full State ranking.Click here to see the full State ranking.
Other operating costs Info Everything it costs to run the home apart from payroll — food, utilities, supplies, maintenance, contract labor and administration. Calculated as total operating expense minus payroll (staff salaries and wage-related benefits).
$1.6M
Total costs Info The home's total operating expense for the year — all the costs of running it, salaries included (CMS cost report, Worksheet G-3).
$3.7M

Who this home usually serves

TYPE OF STAY

Mix of rehab and long-term care

This home supports both short-term rehab and long-term care, with residents staying for a wide range of durations.

Most new residents arrive under private pay (55% of admissions), and a typical private pay stay runs around 15 days.

Admissions
287 total

Coverage residents most often arrive under.

Medicare 45%
Private pay 55%
Discharges
311 total

Coverage residents most often leave under.

Medicare 44%
Private pay 56%

Places of interest near Wellpark Health and Rehabilitation

Address 6.2 miles from city center Info Estimated distance in miles from Knoxville's city center to Wellpark Health and Rehabilitation's address, calculated via Google Maps.

Calculate Travel Distance to Wellpark Health and Rehabilitation

Add your location

Address

Compare Nursing Homes around Knoxville

The information below is reported by the Tennessee Department of Health, Division of Health Care Facilities.

5 facilities compared · CMS & TN Dept. of Health data

Holston Health And Rehabilitation Center
NH
HC
NC
PC
Knoxville
94
Facility 94
TN AVG 88
Rank #174 / 426
81.9%
Facility 81.9%
TN AVG 73%
Rank #128 / 319
+12%
3.36
Facility 3.36
TN AVG 3.63
Rank #97 / 192
-1%-7%
$0
Facility $0
TN AVG $90.9k
Rank #1 / 198
5
Facility 5
TN AVG 15.4
Rank #18 / 196
2.5
Facility 2.5
TN AVG 4.4
Rank #31 / 196
-86-
2
Facility 2
TN AVG 34
Rank #507 / 553
Daniel Mckenzie
$10.2M
Facility $10.2M
TN AVG $11.5M
Rank #90 / 196
$6.2M
Facility $6.2M
TN AVG $4.6M
Rank #83 / 196
61.1%
Facility 61.1%
TN AVG 41%
Rank #86 / 196
445344
NHC HealthCare, Farragut
NH
AL
MC
NC
Knoxville
88
Facility 88
TN AVG 88
Rank #186 / 426
100.0%
Facility 100.0%
TN AVG 73%
Rank #1 / 319
+37%
4.17
Facility 4.17
TN AVG 3.63
Rank #25 / 192
+27%+15%
$0
Facility $0
TN AVG $90.9k
Rank #1 / 198
12
Facility 12
TN AVG 15.4
Rank #76 / 196
6.0
Facility 6.0
TN AVG 4.4
Rank #157 / 196
-94-
24
Facility 24
TN AVG 34
Rank #357 / 553
Karla Lane
$16.3M
Facility $16.3M
TN AVG $11.5M
Rank #24 / 196
$9.6M
Facility $9.6M
TN AVG $4.6M
Rank #28 / 196
58.6%
Facility 58.6%
TN AVG 41%
Rank #85 / 196
445415
Wellpark Health and Rehabilitation
NH
Knoxville
32
Facility 32
TN AVG 88
Rank #406 / 426
100.0%
Facility 100.0%
TN AVG 73%
Rank #35 / 319
+37%
3.93
Facility 3.93
TN AVG 3.63
Rank #41 / 192
-61%+8%
$0
Facility $0
TN AVG $90.9k
Rank #1 / 198
15
Facility 15
TN AVG 15.4
Rank #96 / 196
5.0
Facility 5.0
TN AVG 4.4
Rank #122 / 196
-46-
27
Facility 27
TN AVG 34
Rank #328 / 553
Presbyterian Homes Of Tennessee Inc
$2.3M
Facility $2.3M
TN AVG $11.5M
Rank #193 / 196
$2.2M
Facility $2.2M
TN AVG $4.6M
Rank #189 / 196
94.8%
Facility 94.8%
TN AVG 41%
Rank #6 / 196
445523
Beverly Park Place Health And Rehab
NH
AL
Knoxville (Corinth)
53
Facility 53
TN AVG 88
Rank #331 / 426
49.1%
Facility 49.1%
TN AVG 73%
Rank #290 / 319
-33%
3.40
Facility 3.40
TN AVG 3.63
Rank #97 / 192
+36%-6%
$0
Facility $0
TN AVG $90.9k
Rank #1 / 198
14
Facility 14
TN AVG 15.4
Rank #90 / 196
2.8
Facility 2.8
TN AVG 4.4
Rank #44 / 196
-26-
8
Facility 8
TN AVG 34
Rank #457 / 553
Hillcrest Healthcare Communities Inc
$17.4M
Facility $17.4M
TN AVG $11.5M
Rank #29 / 196
$6.4M
Facility $6.4M
TN AVG $4.6M
Rank #27 / 196
36.8%
Facility 36.8%
TN AVG 41%
Rank #57 / 196
445131
Renaissance Terrace
NH
AL
IL
MC
Knoxville (Fourth & Gill)
50
Facility 50
TN AVG 88
Rank #341 / 426
29.2%
Facility 29.2%
TN AVG 73%
Rank #314 / 319
-60%
2.82
Facility 2.82
TN AVG 3.63
Rank #183 / 192
+75%-22%
$9.3k
Facility $9.3k
TN AVG $90.9k
Rank #141 / 198
27
Facility 27
TN AVG 15.4
Rank #173 / 196
6.8
Facility 6.8
TN AVG 4.4
Rank #170 / 196
143-
74
Facility 74
TN AVG 34
Rank #26 / 553
William Sharpe
$3.7M
Facility $3.7M
TN AVG $11.5M
Rank #189 / 196
$2.2M
Facility $2.2M
TN AVG $4.6M
Rank #187 / 196
59.5%
Facility 59.5%
TN AVG 41%
Rank #94 / 196
445223

Financial Assistance for
Nursing Home in Tennessee

Wellpark Health and Rehabilitation is located in Knoxville, Tennessee.
Here are the financial assistance programs available to residents in Tennessee.

Get Financial aid guidance

CHOICES Program

TN Medicaid CHOICES

Age 65+ or disabled
General Tennessee resident, Medicaid-eligible, nursing home-level care need.
Income Limits (2025) ~$2,829/month 300% FBR, individual
Asset Limits $2,000 (individual), $3,000 (couple).
TN

Managed care model; high rural demand.

Benefits
Personal care (5-7 hours/day) Respite (240 hours/year) Adult day care ($65/day) Home modifications ($1,500 avg.)

Tennessee Options for Community Living

TN Options

Age 60+
General Tennessee resident, at risk of nursing home.
Income Limits ~$2,000/month individual, varies
Asset Limits $5,000 individual
TN

Limited funding; rural/urban balance.

Benefits
In-home care (3-5 hours/week) Respite (up to 10 days/year) Transportation (~5 trips/month)

Medicare Savings Program (MSP)

Tennessee Medicare Savings Program

Age 65+ or disabled
General TN resident, Medicare Part A/B.
Income Limits (2025) ~$2,510/month (QMB), ~$3,380/month (SLMB), ~$3,598/month (QI)—individual.
Asset Limits $9,430 (individual), $14,130 (couple).
TN

Three tiers; includes Extra Help for Part D; no waitlist.

Benefits
Covers Part B premiums ($174.70/month) Deductibles ($240/year) Copays (~20%)

Family Caregiver Support Program (FCSP)

Tennessee Family Caregiver Support Program

Age
General Caregivers of 60+ needing care or 55+ caregivers of others; TN resident; functional needs (2+ ADLs).
Income Limits (2025) No strict cap; prioritizes low-income ~$24,980/year
Asset Limits Not assessed; need-based.
TN

Includes grandparent caregivers; high rural demand.

Benefits
Respite (4-6 hours/week or 5 days/year) Adult day care ($60/day) Training Supplies (~$500/year)

VA Aid and Attendance (A&A) and Housebound Benefits

Tennessee VA Aid and Attendance/Housebound

Age 65+ or disabled veteran/spouse
General TN resident, wartime service, need for ADL help (A&A) or homebound.
Income Limits (2025) Net income < ~$1,984/month (veteran with dependent, A&A); pension offsets income.
Asset Limits ~$155,356 net worth limit
TN

High veteran population; supports rural/urban care needs.

Benefits
Cash (~$1,433-$2,642/month veteran, ~$951-$1,318 spouse) for care costs (e.g., in-home, assisted living)

Elderly Nutrition Program

Tennessee Elderly Nutrition Program

Age 60+
General TN resident; no income limit but prioritizes low-income.
Income Limits (2025) None; donations encouraged.
Asset Limits Not assessed.
TN

Serves ~50,000 annually; 200+ congregate sites plus Meals on Wheels.

Benefits
Congregate meals ($5-$7/meal value) at senior centers Home-delivered meals ($5-$7/meal)

Property Tax Relief Program

Tennessee Property Tax Relief Program

Age 65+
General TN resident, homeowner/renter (or widow/er 50+, disabled 18+).
Income Limits (2025) ~$45,000/year household, excludes half of Social Security
Asset Limits Not assessed; income-focused.
TN

Rebates up to $1,000; serves ~100,000 annually.

Benefits
Tax rebates (~$250-$1,000 based on income; e.g., $1,000 if income < $8,000)

Frequently Asked Questions about Wellpark Health and Rehabilitation

Who is the owner of Wellpark Health and Rehabilitation?

The legal owner and operator of Wellpark Health and Rehabilitation is River Bluff Healthcare, Inc.

Is Wellpark Health and Rehabilitation in a walkable area?

Wellpark Health and Rehabilitation has a walk score of 27. Somewhat walkable. A few nearby services may be reachable on foot, but most trips require transportation.

What is the license number of Wellpark Health and Rehabilitation?

According to TN state health department records, Wellpark Health and Rehabilitation's license number is 00000404.

When does Wellpark Health and Rehabilitation's license expire?

According to TN state health department records, Wellpark Health and Rehabilitation's license expires on October 18, 2026.

What is the occupancy rate at Wellpark Health and Rehabilitation?

Wellpark Health and Rehabilitation's occupancy is 100%.

Who is the administrator of Wellpark Health and Rehabilitation?

Kyle Albrechtsen is the administrator of Wellpark Health and Rehabilitation.

How many beds does Wellpark Health and Rehabilitation have?

Wellpark Health and Rehabilitation has 32 beds.

Guides for Better Senior Living

Care Cost Calculator: See Prices in Your Area

Nursing Home Data Explorer

Don’t Wait Too Long: 7 Red Flag Signs Your Parent Needs Assisted Living Now

The True Cost of Assisted Living in 2025 – And How Families Are Paying For It

Understanding Senior Living Costs: Pricing Models, Discounts & Financial Assistance