Wesley Commons
Nursing Home, Assisted Living, Independent Living & Memory Care · Greenwood, SC
CMS overall rating Info CMS (the Centers for Medicare & Medicaid Services) is the federal agency that rates nursing home quality. Its Overall Rating runs from 1 to 5 stars, combining health inspections, staffing, and quality measures, with inspections weighted most heavily.

Wesley Commons

Nursing Home, Assisted Living, Independent Living & Memory Care · Greenwood, SC
CMS overall rating Info CMS (the Centers for Medicare & Medicaid Services) is the federal agency that rates nursing home quality. Its Overall Rating runs from 1 to 5 stars, combining health inspections, staffing, and quality measures, with inspections weighted most heavily.
Calculator: See prices in your area
Wesley Commons accepts Medicare, Medicaid, and private pay.

Overview of Wesley Commons

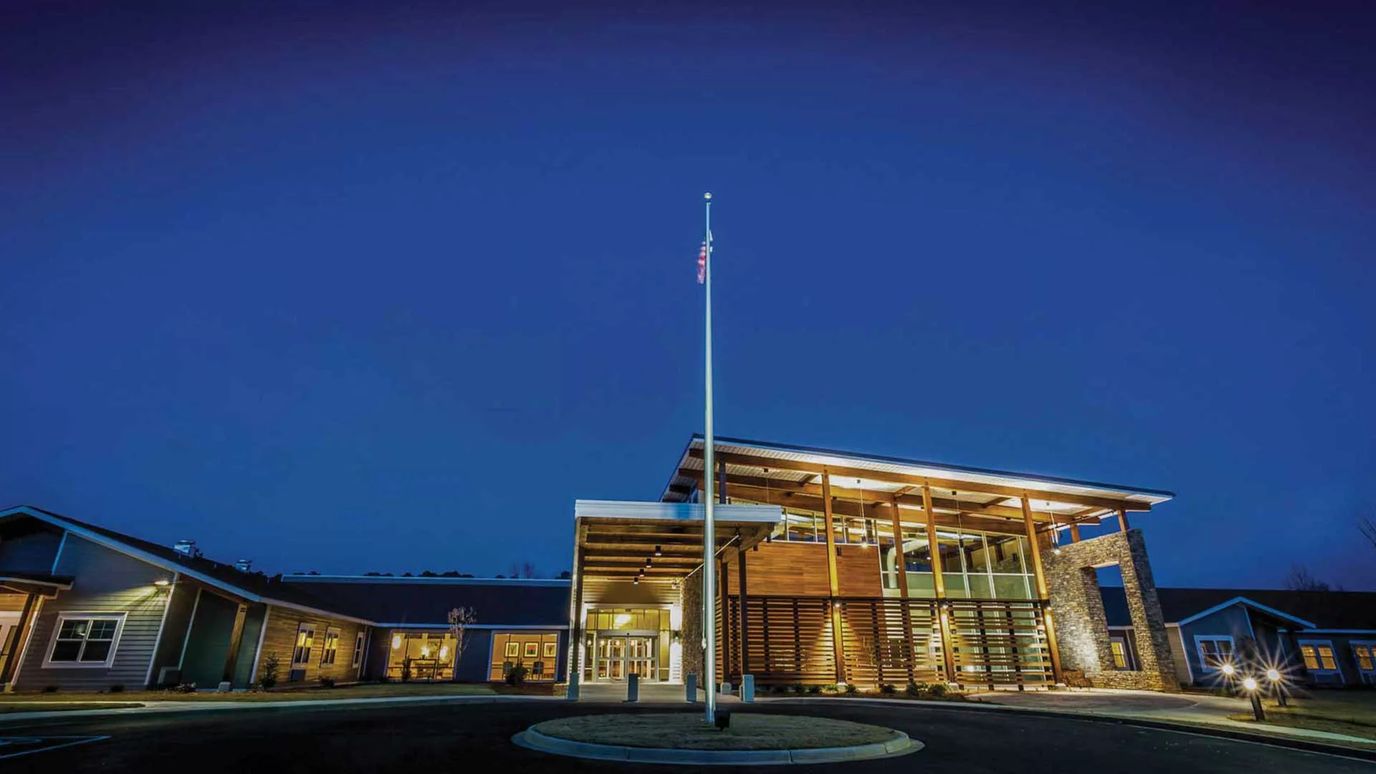
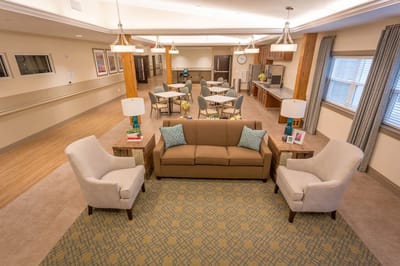
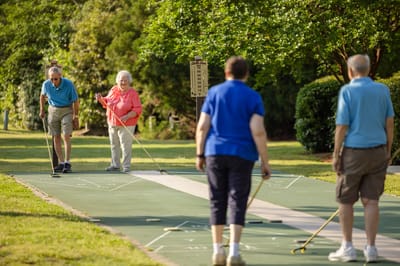
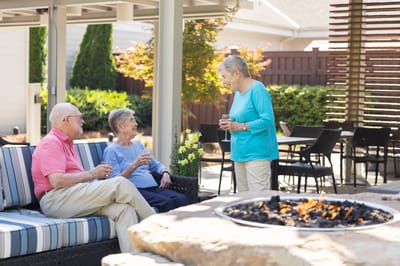
Wesley Commons is a vibrant community for residents looking to find a community that feels like home. Adults and seniors can feel confident with the relaxing independent living lifestyle they’ll be able to enjoy during their stay, and their families can rest easy knowing that their loved ones are in the best environment to retire. For over 50 years, management has continuously dedicated itself to ensuring an active and enhanced senior lifestyle in one of Greenwood’s trust retirement communities.
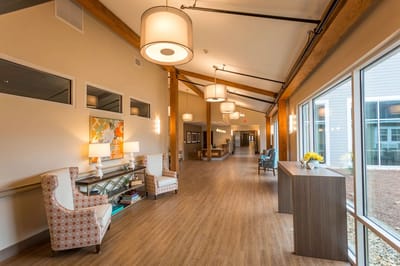
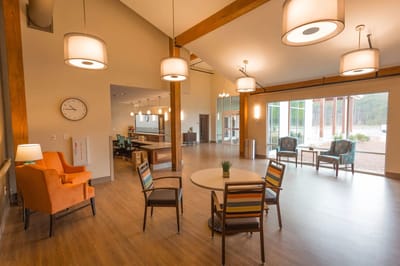
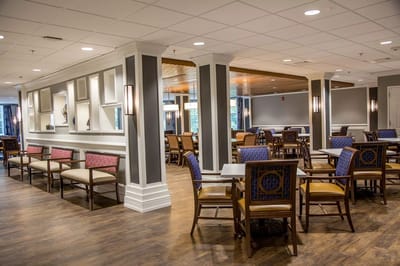
Wesley Commons boasts its independent living options: villa-type or cottages-inspired residential housing around the neighborhood. Adults practice a resident-focused care plan that involves a range of fitness programs, scheduled outings, and engaging programs for holistic wellness.

(888) 298-6222

Quality ratings

Measured by Centers for Medicare & Medicaid Services (CMS)

Overall rating Info The Overall CMS Rating combines results from health inspections, staffing levels and quality measures. Health inspections carry the most weight. Staffing and quality scores can increase or decrease the final rating based on performance compared to state and national standards.
▲ 36.5% Above SC avg. ▲ 36.5% Above SC avg.SC average: 2.9Click the badge to see the full State ranking.Click here to see the full State ranking.
Health Inspection Info Based on the results of the facility's three most recent standard inspections and any complaint investigations. CMS reviews the number, scope, and severity of deficiencies, with more recent findings weighted more heavily.
▲ 45.5% Above SC avg. ▲ 45.5% Above SC avg.SC average: 2.8Click the badge to see the full State ranking.Click here to see the full State ranking.
Staffing Info Measures average nursing staff hours per resident per day, including Registered Nurses (RNs) and total nursing staff. Ratings are adjusted based on the level of care residents require and are compared to state and national benchmarks.
▲ 35.6% Above SC avg. ▲ 35.6% Above SC avg.SC average: 3.0Click the badge to see the full State ranking.Click here to see the full State ranking.
Quality Measures Info Based on clinical and physical health indicators reported to CMS, such as hospital readmissions, falls, pressure ulcers, and improvements in mobility. These measures reflect how well residents' health needs are being managed.
▼ 14.0% Below SC avg. ▼ 14.0% Below SC avg.SC average: 3.5Click the badge to see the full State ranking.Click here to see the full State ranking.

Staffing hours breakdown

Info Daily nursing hours per resident by staff type, reported to CMS. Higher is generally better — compare this facility to state and national averages to see where staffing stands.

Hours per resident per day — compared to South Carolina state averages

Total nursing care / resident Info This home is ranked 21st out of 112 homes in South Carolina for nurse hours. Total adjusted nursing hours per resident per day, combining RN, LPN, and aide time. CMS adjusts this for case-mix so facilities can be fairly compared.
4h 36m per day
Rank #21 / 112Nurse hours — State benchmarkedThis home is ranked 21st out of 112 homes in South Carolina. Shows adjusted nurse hours per resident per day benchmarked to the South Carolina average, with a ranking across 112 South Carolina facilities. More hours mean more direct care. The national average is about 3.5 hrs; below 3.0 is a red flag.Click the rank badge to see the full State ranking.Click here to see the full State ranking.
This facility South Carolina avg (4h 5m per day)
vs South Carolina avg
+12%

2 of 6 metrics below state avg

Standout metric Weekend RN is +44% above state avg
Staff typeHours / Day / Residentvs state avg
Registered Nurse (RN) Info RNs hold the highest nursing license and can assess residents, interpret test results, and direct care plans. More RN hours per day often signals stronger clinical oversight and faster response to health changes. 50m per day ▲ 31% State avg: 38m per day · National avg: 41m per day
LPN / LVN Info Licensed Practical Nurses (LPNs) or Licensed Vocational Nurses (LVNs) deliver routine hands-on care — medication administration, wound dressing, and monitoring vital signs. They work under RN supervision and make up a large share of daily bedside care. 46m per day ▼ 25% State avg: 1h 1m per day · National avg: 52m per day
Nurse Aide Info Certified Nurse Aides (CNAs) provide the most direct day-to-day assistance: bathing, dressing, feeding, and mobility. Nurse aide hours are typically the largest staffing category and directly affect residents' quality of life. 2h 20m per day ▲ 5% State avg: 2h 13m per day · National avg: 2h 21m per day
Weekend Total Nursing Info Combined nursing hours (RN + LPN + Nurse Aide) per resident per day on weekends. Staffing often drops on weekends — this figure reveals whether the facility maintains adequate coverage outside of weekday hours. 3h 27m per day ▲ 4% State avg: 3h 20m per day · National avg: 3h 26m per day
Physical Therapist Info Hours per resident per day provided by licensed Physical Therapists (PTs) or PT Assistants. PT services help residents recover mobility after injury or illness and are especially important for post-acute (short-stay) rehabilitation. 5m per day ▼ 6% State avg: 5m per day · National avg: 4m per day
Weekend RN Info Registered nurse hours specifically on weekends. Facilities sometimes reduce RN presence on Saturdays and Sundays — a low weekend RN figure compared to weekday hours can indicate reduced clinical oversight when most administrative staff are absent. 35m per day ▲ 44% State avg: 24m per day · National avg: 29m per day

Capacity and availability

This home usually has limited availability

Higher occupancy than the South Carolina average: 82.1%
Occupancy rate
90.9% Rank #26 / 122Occupancy rate — State benchmarkedThis home is ranked 26th out of 122 homes in South Carolina. Shows this facility's occupancy rate versus the South Carolina average, with its Statewide rank out of 122. Higher occupancy signals strong local demand and financial stability.Click the rank badge to see the full State ranking.Click here to see the full State ranking.
Avg. Length of Stay
72 days
Years in operation
55 years in operation
A longer operating history, which may indicate experience navigating regulations and delivering ongoing care.
Walk Score
Walk Score: 0 / 100 Rank #229 / 232Walk Score — State benchmarkedThis home is ranked 229th out of 232 homes in South Carolina. Shows how walkable this facility's neighborhood is compared to the average Walk Score across South Carolina facilities. Higher scores benefit residents, families, and staff.Click the rank badge to see the full State ranking.Click here to see the full State ranking.
Car-dependent. Most errands require a car, with limited nearby walkable options.
BBB Rating
BBB Rating: A+ (Not Accredited)
An independent rating from the Better Business Bureau based on factors such as complaint history, transparency, and business practices.
How BBB ratings work

About this community

License Details

CMS Certification Number425078

Staffing

Key information about the people who lead and staff this community.

Leadership

ContactMr. David Buckshorn, President/CEO

Staff Composition

Total Employees
86
Part-Time Employees
86

Therapy & Rehabilitation

3 services
Rehabilitation Services
Respite Care
Short-Term Rehab

Additional Services

1 service
Memory Support

Amenities & Lifestyle

7
500-Square-Foot Wellness Complex
Indoor Pool
Fitness Center
Nature Trails
Pickleball Courts
Shuffleboard Courts
Putting Green
Interest Groups
Volunteer Opportunities

Contact Wesley Commons

Inspection History

In South Carolina, the Department of Public Health, Bureau of Healthcare Quality conducts unannounced inspections to ensure care providers meet all health and safety codes.

Since 2021 · 5 years of data 5 deficiencies

Inspection Scorecard Info This scorecard compares key inspection, citation, and complaint metrics at this facility against the South Carolina state average. Metrics rated ≥15% worse than average are highlighted in red; those ≥15% better are highlighted in green.

Since 2021 vs. South Carolina state average
Overall vs. SC average 0 Worse No metrics in this bucket. 2 Better Metrics better than South Carolina average:
• Total deficiencies (58% below)
• Deficiencies per year (58% below)
Latest Inspection November 27, 2024 Other An inspection that falls outside standard annual surveys and formal complaint investigations. May include administrative compliance checks, documentation reviews, focused surveys on specific concerns, or revisit surveys to verify prior corrections.

Deficiencies Info Deficiencies are formal regulatory issues recorded during state inspections.

This FacilitySC Averagevs. SC Avg
Total deficiencies Info Formal regulatory issues recorded by inspectors across all inspection types. 512 This facility has 58% fewer total deficiencies than a typical South Carolina nursing home (5 vs. SC avg 12).↓ 58% better
Deficiencies per year Info Average deficiencies per year since 2021. 12.4 This facility has 58% fewer deficiencies per year than a typical South Carolina nursing home (1 vs. SC avg 2.4).↓ 58% better

Inspection Reports Summary Info An editor-reviewed summary of the themes and findings across this facility's recent inspection reports.

  • November 27, 2024 inspection found no health deficiencies and no complaints were reported.
  • October 19, 2023 complaint investigation substantiated failure to prevent resident entrapment in quarter side rails, resulting in death and immediate jeopardy findings.
  • April 14, 2023 complaint investigation found medication error rate of 10.71% and unlocked medication carts, indicating lapses in medication management and security.

Health Inspection History

Inspections since 2021
Total health inspections 3

South Carolina average 3.9


Last Health inspection on Oct 2023

Total health citations
6 Rank #17 / 113Health citations — State benchmarkedThis home is ranked 17th out of 113 homes in South Carolina. Shows this facility's total health deficiency citations benchmarked to the South Carolina State average, with a ranking across all 113 SC facilities. Lower citation counts earn a better rank.Click the rank badge to see the full State ranking.Click here to see the full State ranking.

South Carolina average 13.7

Citations per inspection
2 Rank #13 / 113Citations per inspection — State benchmarkedThis home is ranked 13th out of 113 homes in South Carolina. Shows average deficiency citations per CMS inspection for this facility versus the South Carolina mean across 113 facilities with citation data. Lower is better.Click the rank badge to see the full State ranking.Click here to see the full State ranking.

South Carolina average 3.44


Health citations are formal notices following inspections when they fail to comply with safety and care standards.

5 of 6 citations resulted from standard inspections; and 1 of 6 resulted from complaint investigations.

Breakdown of citation severity (last 5 years)
Critical health citations
1
In line with South Carolina average

South Carolina average: 1


Serious health citations
0
100% better than South Carolina average

South Carolina average: 0.3

1 critical citation South Carolina average: 1

0 serious citations South Carolina average: 0.3

5 moderate citations South Carolina average: 12.3

0 minor citations South Carolina average: 0.1
Citations history (last 5 years)
Quality of Care critical citation Oct 19, 2023
Corrected

Pharmacy moderate citation Apr 14, 2023
Corrected

Pharmacy moderate citation Apr 14, 2023
Corrected

Care Planning moderate citation Apr 14, 2023
Corrected

Staffing Data

Reporting period: October 1 – December 31, 2025 (Q4 2025). Source: CMS Payroll-Based Journal report.

Total staff 183
Employees 132
Contractors 51
Staff to resident ratio 2.69 : 1
47% more staff per resident than South Carolina average
South Carolina average ratio: 1.84 : 1 South Carolina average ratio: 1.84 : 1See full South Carolina ranking
Avg staff/day 45
Average shift 7.7 hours
0% compared with South Carolina average
South Carolina average: 7.9 hours South Carolina average shift: 7.9 hoursSee full South Carolina ranking
Total staff hours (quarter) 32,003

Nursing staff breakdown

Q4 2025 · Oct 1 – Dec 31 More info This data comes from the CMS Payroll-Based Journal report covering October 1 – December 31, 2025.
Registered Nurse

Manages medical care and health needs.

RN Staff Info 27 total: 23 full-time employees and 4 contractors. 27
Average shift length Info Average shift length. Calculated as total hours divided by days worked and average staff per day. 8 hours
Licensed Practical Nurse

Assists with medical care and medications.

LPN Staff Info 22 total: 18 full-time employees and 4 contractors. 22
Average shift length Info Average shift length. Calculated as total hours divided by days worked and average staff per day. 7.3 hours
Certified Nursing Assistant

Helps with daily care and mobility.

CNA Staff Info 106 total: 80 full-time employees and 26 contractors. 106
Average shift length Info Average shift length. Calculated as total hours divided by days worked and average staff per day. 8.4 hours

Contractor staffing

Q4 2025 · Oct 1 – Dec 31 More info This data comes from the CMS Payroll-Based Journal report covering October 1 – December 31, 2025.

Total hours from contractors

11.5%

3,683 contractor hours this quarter

Certified Nursing Assistant: 26 Registered Nurse: 4 Licensed Practical Nurse: 4 Physical Therapy Aide: 3 Speech Language Pathologist: 2 Feeding Assistant: 2 Physical Therapy Assistant: 2 Respiratory Therapy Technician: 2 Qualified Social Worker: 1 Medical Director: 1 Occupational Therapy Assistant: 1 Other Physician: 1 Therapeutic Recreation Specialist: 1 Occupational Therapy Aide: 1

Staff by category

Q4 2025 · Oct 1 – Dec 31 More info This data comes from the CMS Payroll-Based Journal report covering October 1 – December 31, 2025.
Certified Nursing Assistant802610616,54192100%8.4
Licensed Practical Nurse184224,40392100%7.3
Registered Nurse234273,95092100%8
Clinical Nurse Specialist4041,5006672%8.1
RN Director of Nursing3039786672%7.7
Physical Therapy Aide0336897379%6.1
Respiratory Therapy Technician0225527480%6.5
Mental Health Service Worker1015276267%8.5
Other Dietary Services Staff1014656470%7.3
Nurse Practitioner1014555762%8
Administrator1014245358%8
Feeding Assistant0224245257%7.7
Speech Language Pathologist0223586672%5.2
Qualified Social Worker0112544751%5.4
Medical Director0112115964%3.6
Therapeutic Recreation Specialist0111032325%4.5
Physical Therapy Assistant022744145%1.8
Occupational Therapy Aide011481213%4
Occupational Therapy Assistant011413336%1.2
Other Physician01171314%0.5
106 Certified Nursing Assistant
% of Days 100%
22 Licensed Practical Nurse
% of Days 100%
27 Registered Nurse
% of Days 100%
4 Clinical Nurse Specialist
% of Days 72%
3 RN Director of Nursing
% of Days 72%
3 Physical Therapy Aide
% of Days 79%
2 Respiratory Therapy Technician
% of Days 80%
1 Mental Health Service Worker
% of Days 67%
1 Other Dietary Services Staff
% of Days 70%
1 Nurse Practitioner
% of Days 62%
1 Administrator
% of Days 58%
2 Feeding Assistant
% of Days 57%
2 Speech Language Pathologist
% of Days 72%
1 Qualified Social Worker
% of Days 51%
1 Medical Director
% of Days 64%
1 Therapeutic Recreation Specialist
% of Days 25%
2 Physical Therapy Assistant
% of Days 45%
1 Occupational Therapy Aide
% of Days 13%
1 Occupational Therapy Assistant
% of Days 36%
1 Other Physician
% of Days 14%

Penalties and fines

Includes penalties issued in 2023

Federal penalties imposed by CMS for regulatory violations, including civil money penalties (fines) and denials of payment for new Medicare/Medicaid admissions.

Source: CMS Penalties Database (Data as of Jan 2026)

Total fines amount $15K Rank #73 / 114Federal fines — State benchmarkedThis home is ranked 73rd out of 114 homes in South Carolina. Shows this facility's cumulative CMS federal fine dollars versus the South Carolina average among facilities with fines, and where it ranks among 114 facilities in the pool. Lower total dollars mean a better rank.Click the rank badge to see the full State ranking.Click here to see the full State ranking.
57% lower than South Carolina average

South Carolina average: $34K

Number of fines 1
59% fewer fines than South Carolina average

South Carolina average: 2.4

Payment Denials Info Serious action where Medicare and/or Medicaid temporarily stops payments for new residents until issues are fixed. 0
100% fewer payment denials than South Carolina average

South Carolina average: 0.1

Fines amount comparison
This facility $15K
South Carolina average $34K
Penalty History

Penalties are imposed by CMS for violations of federal nursing home regulations.

1 penalty in the past 3 years

Oct 19, 2023 · $15K

Civil Money Penalty Info Fines imposed for noncompliance, which can be assessed per day or per instance of violation. Oct 19, 2023
$15K

Last updated: Jan 2026

Quality of care over time

These measures show how residents usually do over time at this home, based on health outcomes and preventive care.

High-risk clinical events score Info A composite score based on pressure ulcers, falls with injury, weight loss, walking ability decline, and activities of daily living decline. 9.4
8% worse than South Carolina average

South Carolina average: 8.7

Functional decline score Info A composite score based on activities of daily living decline, walking ability decline, and incontinence. 19.2
24% worse than South Carolina average

South Carolina average: 15.5

Long-stay resident measures
Average South Carolina avg: 3.9 Info CMS star rating based on long-stay quality measure performance. 5 stars = significantly above average, 1 star = significantly below average.
Need for Help with Daily Activities Increased Info Percent of long-stay residents whose need for help with daily activities has increased 12.1%
7% better than South Carolina average

South Carolina average: 13.1%

Walking Ability Worsened Info Percent of long-stay residents whose ability to move independently worsened 18.8%
16% worse than South Carolina average

South Carolina average: 16.2%

Low Risk Residents with Bowel/Bladder Incontinence Info Percent of low risk long-stay residents who lose control of their bowels or bladder 26.8%
57% worse than South Carolina average

South Carolina average: 17.0%

Falls with Major Injury Info Percent of long-stay residents experiencing one or more falls with major injury 1.8%
39% better than South Carolina average

South Carolina average: 3.0%

High Risk Residents with Pressure Ulcers Info Percent of long-stay high risk residents with pressure ulcers 2.4%
60% better than South Carolina average

South Carolina average: 6.1%

Urinary Tract Infection Info Percent of long-stay residents with a urinary tract infection 6.5%
291% worse than South Carolina average

South Carolina average: 1.6%

Lost Too Much Weight Info Percent of long-stay residents who lose too much weight 12.0%
95% worse than South Carolina average

South Carolina average: 6.2%

Depressive Symptoms Info Percent of long-stay residents who have depressive symptoms 0.0%
100% better than South Carolina average

South Carolina average: 2.8%

Antipsychotic Use Info Percent of long-stay residents who received an antipsychotic medication 32.4%
123% worse than South Carolina average

South Carolina average: 14.5%

Pneumococcal Vaccine Info Percent of long-stay residents assessed and appropriately given the pneumococcal vaccine 100.0%
11% better than South Carolina average

South Carolina average: 90.5%

Influenza Vaccine Info Percent of long-stay residents assessed and appropriately given the seasonal influenza vaccine 100.0%
10% better than South Carolina average

South Carolina average: 90.6%

Hospitalizations per 1,000 days Info Number of hospitalizations per 1,000 long-stay resident days. 3.19
57% worse than South Carolina average

South Carolina average: 2.03

ED visits per 1,000 days Info Number of outpatient emergency department visits per 1,000 long-stay resident days. 2.69
41% worse than South Carolina average

South Carolina average: 1.91

Short-stay resident measures
Average South Carolina avg: 2.8 Info CMS star rating based on short-stay quality measure performance. 5 stars = much above average, 1 star = much below average.
Pneumococcal Vaccine Info Percent of short-stay residents assessed and appropriately given the pneumococcal vaccine 99.4%
25% better than South Carolina average

South Carolina average: 79.5%

Antipsychotic medication increase Info Percent of short-stay residents who newly received an antipsychotic medication 2.2%
30% worse than South Carolina average

South Carolina average: 1.7%

Influenza Vaccine Info Percent of short-stay residents assessed and appropriately given the seasonal influenza vaccine 93.6%
20% better than South Carolina average

South Carolina average: 78.0%

Re-hospitalized after SNF stay Info Percentage of short-stay residents who were re-hospitalized after their nursing home admission. 29.6%
20% worse than South Carolina average

South Carolina average: 24.7%

Emergency department visits Info Percentage of short-stay residents who had an outpatient emergency department visit. 15.0%
6% worse than South Carolina average

South Carolina average: 14.1%

Falls with major injury Info Percentage of SNF residents who experience falls with major injury during their stay. 1.2%
56% worse than South Carolina average

South Carolina average: 0.8%

Ability to care for self at discharge Info Percentage of residents at or above expected ability to care for themselves at discharge. 52.8%
In line with South Carolina average

South Carolina average: 53.7%

Successful return to home or community Info Rate of successful return to home or community from a skilled nursing facility. 56.1%
11% better than South Carolina average

South Carolina average: 50.6%

Breakdown by payment type

Medicare

40% of new residents, usually for short-term rehab.

Typical stay 1 - 2 months

Private pay

52% of new residents, often for short stays.

Typical stay 1 - 2 months

Medicaid

8% of new residents, often for long-term daily care.

Typical stay 1 - 2 years

Facility Characteristics

Source: CMS Long-Term Care Facility Characteristics (Data as of Jan 2026)

Total residents 68
Medicare
10
14.7% of residents
Medicaid
39
57.4% of residents
Private pay or other
19
27.9% of residents
Programs & Services
Residents Group

Residents meet regularly to discuss policies, care quality, and activities

Family Member Group

Family members meet regularly to discuss policies, care quality, and activities

CCRC

Part of a Continuing Care Retirement Community offering multiple care levels

Active Family Council

Organized group of family members that meets regularly to discuss facility policies, resident care, and activities.

Active Resident Council

Organized group of residents that meets regularly to discuss facility policies, quality of life, and activities.

Finances and operations

Based on the 2023 CMS SNF Cost Report.

Governmental community
Operated by a subsidized facility district.
Home revenue
$12.0M
Surplus of revenue
$45.6K
Governmental community Operated by a subsidized facility district.
Home revenue
$12.0M Rank #67 / 116Revenue — State benchmarkedThis home is ranked 67th out of 116 homes in South Carolina. Shows this facility's annual revenue compared to the South Carolina average. Higher revenue generally means more resources for staffing and capital — read alongside Payroll %.Click the rank badge to see the full State ranking.Click here to see the full State ranking.
Surplus of revenue
$45.6K
Payroll costs Info The portion of the home's budget spent on staff, including nurses, caregivers, and other employees who support care and operations. Rank #103 / 116Payroll — State benchmarkedThis home is ranked 103rd out of 116 homes in South Carolina. Shows total annual staff payroll benchmarked to the South Carolina average. Higher payroll investment relative to peers often signals better staffing and less reliance on cheaper contract labor.Click the rank badge to see the full State ranking.Click here to see the full State ranking.
$3.8M
31.8% of revenue Rank #112 / 116Payroll % — State benchmarkedThis home is ranked 112th out of 116 homes in South Carolina. Shows payroll as a percentage of revenue versus the South Carolina average. Well-run South Carolina facilities typically land around 53–64% — the top third Statewide. Below 25% may signal understaffing or heavy agency use — read with Staffing ratings.Click the rank badge to see the full State ranking.Click here to see the full State ranking.
Other operating costs Info All remaining costs needed to run the home, such as food, utilities, building maintenance, supplies and administrative expenses.
$8.1M
Total costs $11.9M

Who this home usually serves

TYPE OF STAY

Mix of rehab and long-term care

This home supports both short-term rehab and long-term care, with residents staying for a wide range of durations.

Most new residents arrive under private pay (52% of admissions), and a typical private pay stay runs around 1 - 2 months.

Admissions
363 total

Coverage residents most often arrive under.

Medicare 40%
Private pay 52%
Medicaid 8%
Discharges
367 total

Coverage residents most often leave under.

Medicare 39%
Private pay 52%
Medicaid 9%

Managed by Kim Holmes Moody

Healthcare Administrator

Places of interest near Wesley Commons

Address 2.4 miles from city center Info Estimated distance in miles from Greenwood's city center to Wesley Commons's address, calculated via Google Maps. — 1.83 miles to nearest hospital (Hospital ER)

Calculate Travel Distance to Wesley Commons

Add your location

Address

Financial Assistance for
Nursing Home in South Carolina

Wesley Commons is located in Greenwood, South Carolina.
Here are the financial assistance programs available to residents in South Carolina.

Get Financial aid guidance

Community Long Term Care (CLTC)

SC Medicaid CLTC

Age 65+ or disabled
General South Carolina resident, Medicaid-eligible, nursing home-level care need.
Income Limits (2025) ~$2,829/month 300% FBR, individual
Asset Limits $2,000 (individual), $3,000 (couple).
SC

High rural demand; waitlists possible.

Benefits
Personal care (5-7 hours/day) Respite (240 hours/year) Adult day care ($60/day) Home modifications ($1,500 avg.)

South Carolina Respite Care Program

SC NFCSP Respite

Age Caregiver of someone 60+ (or with dementia)
General South Carolina resident.
Income Limits No strict limit; prioritizes low-income.
Asset Limits Not applicable.
SC

Limited slots; rural/urban balance.

Benefits
In-home respite (4-6 hours/day) Adult day care (~$60/day) Short-term facility care (up to 5 days)

Medicare Savings Program (MSP)

South Carolina Medicare Savings Program

Age 65+ or disabled
General SC resident, Medicare Part A/B.
Income Limits (2025) ~$2,510/month (QMB), ~$3,380/month (SLMB), ~$3,598/month (QI)—individual.
Asset Limits $9,430 (individual), $14,130 (couple).
SC

Three tiers; includes Extra Help for Part D; no waitlist.

Benefits
Covers Part B premiums ($174.70/month) Deductibles ($240/year) Copays (~20%)

VA Aid and Attendance (A&A) and Housebound Benefits

South Carolina VA Aid and Attendance/Housebound

Age 65+ or disabled veteran/spouse
General SC resident, wartime service, need for ADL help (A&A) or homebound.
Income Limits (2025) Net income < ~$1,984/month (veteran with dependent, A&A); pension offsets income.
Asset Limits ~$155,356 net worth limit
SC

High veteran population; supports rural/urban care needs.

Benefits
Cash (~$1,433-$2,642/month veteran, ~$951-$1,318 spouse) for care costs (e.g., in-home, assisted living)

Senior Farmers’ Market Nutrition Program (SFMNP)

South Carolina SFMNP

Age 60+
General SC resident, low-income.
Income Limits (2025) ~$2,322/month individual, 185% FPL
Asset Limits Not assessed.
SC

Vouchers (~$50/season); serves ~20,000 annually via 10 AAAs.

Benefits
Vouchers (~$50/season) for fresh produce at approved markets

Homestead Exemption Program

South Carolina Homestead Exemption

Age 65+ (or disabled/blind)
General SC resident 1+ year, homeowner.
Income Limits (2025) None; tax-based eligibility.
Asset Limits Not assessed; home-focused.
SC

Saves ~$500-$1,000/year avg.; applies to primary residence.

Benefits
Property tax exemption (~$50,000 value, ~$500-$1,000/year savings)

Elderly Simplified Application Project (ESAP)

South Carolina ESAP (SNAP for Seniors)

Age 60+
General SC resident, no earned income, not on SCCAP.
Income Limits (2025) ~$1,732/month 133% FPL, individual
Asset Limits $4,250 individual, higher than standard SNAP
SC

Simplified process; serves ~50,000 seniors annually.

Benefits
EBT card for food (~$100-$300/month based on income)

Compare Nursing Home around Greenwood

The information below is reported by the South Carolina Department of Public Health, Bureau of Healthcare Quality.

4 facilities compared · CMS & SC Dept. of Health data

Wesley Commons
NH

Nursing Home Licensed facility providing 24/7 skilled nursing care for residents with complex, ongoing medical needs. Staffed by RNs, LPNs, and CNAs. Inspected and star-rated annually by CMS. Accepts Medicare (short-term rehab) and Medicaid (long-term care).

AL

Assisted Living A licensed, long-term care setting for seniors or individuals with disabilities who need help with daily activities — like bathing, dressing, and medication management — but not 24-hour skilled nursing. Offers housing, meals, and around-the-clock support while aiming to maximize resident independence.

IL

Independent Living Lifestyle-focused communities for older adults offering dining, activities, and transportation with minimal personal care. Best for active, independent seniors who want community without medical support.

MC

Memory Care Secured, specialized care for people living with Alzheimer's or dementia. Staff trained in cognitive impairment, with higher staff-to-resident ratios and an environment designed to reduce confusion and wandering risk.

Greenwood (Parkwood)
80
Facility 80
SC AVG 90
Rank #168 / 309
90.9%
Facility 90.9%
SC AVG 82.1%
Rank #26 / 122
+11%
4.60
Facility 4.60
SC AVG 4.00
Rank #21 / 112
+59%+15%
$14.5k
Facility $14.5k
SC AVG $34.8k
Rank #73 / 114
6
Facility 6
SC AVG 13.7
Rank #17 / 113
2.0
Facility 2.0
SC AVG 3.4
Rank #13 / 113
177A+
0
Facility 0
SC AVG 32
Rank #229 / 232
Wesley Commons
$12.0M
Facility $12.0M
SC AVG $13.0M
Rank #67 / 116
$3.8M
Facility $3.8M
SC AVG $5.4M
Rank #103 / 116
31.8%
Facility 31.8%
SC AVG 44%
Rank #112 / 116
425078
NHC HealthCare Greenwood
NH

Nursing Home Licensed facility providing 24/7 skilled nursing care for residents with complex, ongoing medical needs. Staffed by RNs, LPNs, and CNAs. Inspected and star-rated annually by CMS. Accepts Medicare (short-term rehab) and Medicaid (long-term care).

HC

Home Care Professional care delivered in the person's own home — from companionship and errands to skilled nursing and therapy. Allows seniors to age in place. Medicare covers skilled home health when medically necessary.

HC

Home Care Professional care delivered in the person's own home — from companionship and errands to skilled nursing and therapy. Allows seniors to age in place. Medicare covers skilled home health when medically necessary.

NC

Nursing Care

Greenwood
152
Facility 152
SC AVG 90
Rank #22 / 309
88.0%
Facility 88.0%
SC AVG 82.1%
Rank #47 / 122
+7%
3.71
Facility 3.71
SC AVG 4.00
Rank #65 / 112
+46%-7%
$14.4k
Facility $14.4k
SC AVG $34.8k
Rank #82 / 114
16
Facility 16
SC AVG 13.7
Rank #79 / 113
2.7
Facility 2.7
SC AVG 3.4
Rank #36 / 113
2139-
15
Facility 15
SC AVG 32
Rank #173 / 232
Jacob Shearer
$19.0M
Facility $19.0M
SC AVG $13.0M
Rank #29 / 116
$8.6M
Facility $8.6M
SC AVG $5.4M
Rank #28 / 116
45.3%
Facility 45.3%
SC AVG 44%
Rank #68 / 116
425063
Brookdale Greenwood Village
NH

Nursing Home Licensed facility providing 24/7 skilled nursing care for residents with complex, ongoing medical needs. Staffed by RNs, LPNs, and CNAs. Inspected and star-rated annually by CMS. Accepts Medicare (short-term rehab) and Medicaid (long-term care).

AL

Assisted Living A licensed, long-term care setting for seniors or individuals with disabilities who need help with daily activities — like bathing, dressing, and medication management — but not 24-hour skilled nursing. Offers housing, meals, and around-the-clock support while aiming to maximize resident independence.

IL

Independent Living Lifestyle-focused communities for older adults offering dining, activities, and transportation with minimal personal care. Best for active, independent seniors who want community without medical support.

MC

Memory Care Secured, specialized care for people living with Alzheimer's or dementia. Staff trained in cognitive impairment, with higher staff-to-resident ratios and an environment designed to reduce confusion and wandering risk.

Greenwood Village90 87.6% +15%3.96 +4%+3%$0256.3-50B- 71 -$14.4M$10.6M73.1%65376
Magnolia Manor Greenwood
NH

Nursing Home Licensed facility providing 24/7 skilled nursing care for residents with complex, ongoing medical needs. Staffed by RNs, LPNs, and CNAs. Inspected and star-rated annually by CMS. Accepts Medicare (short-term rehab) and Medicaid (long-term care).

HC

Home Care Professional care delivered in the person's own home — from companionship and errands to skilled nursing and therapy. Allows seniors to age in place. Medicare covers skilled home health when medically necessary.

PC

Palliative Care

RC

Respite Care Short-term temporary care — days to weeks — to give family caregivers a break. Full care provided during the stay. Often used after hospitalization or to trial a facility before a permanent placement decision.

Greenwood (Parkway Road)
88
Facility 88
SC AVG 90
Rank #144 / 309
88.8%
Facility 88.8%
SC AVG 82.1%
Rank #41 / 122
+8%
3.41
Facility 3.41
SC AVG 4.00
Rank #82 / 112
+25%-15%
$18.0k
Facility $18.0k
SC AVG $34.8k
Rank #43 / 114
22
Facility 22
SC AVG 13.7
Rank #97 / 113
2.8
Facility 2.8
SC AVG 3.4
Rank #42 / 113
183-
36
Facility 36
SC AVG 32
Rank #102 / 232
Edith Goforth
$11.8M
Facility $11.8M
SC AVG $13.0M
Rank #71 / 116
$4.8M
Facility $4.8M
SC AVG $5.4M
Rank #89 / 116
40.5%
Facility 40.5%
SC AVG 44%
Rank #91 / 116
425172

Frequently Asked Questions about Wesley Commons

What neighborhood is Wesley Commons in?

Wesley Commons is in the Parkwood neighborhood of Greenwood.

What is the occupancy rate at Wesley Commons?

Wesley Commons's occupancy is 90.9%.

Are there photos of Wesley Commons?

Yes — there are 20 photos of Wesley Commons in the photo gallery on this page.

What is the phone number of Wesley Commons?

(888) 298-6222 will put you in contact with the team at Wesley Commons.

Is Wesley Commons Medicare or Medicaid certified?

Yes — Wesley Commons is a CMS-certified provider of Medicare and Medicaid.

Guides for Better Senior Living

Care Cost Calculator: See Prices in Your Area

Nursing Home Data Explorer

Don’t Wait Too Long: 7 Red Flag Signs Your Parent Needs Assisted Living Now

The True Cost of Assisted Living in 2025 – And How Families Are Paying For It

Understanding Senior Living Costs: Pricing Models, Discounts & Financial Assistance

Explore Open Rooms
1 Contact details
2 What type of senior care service are you looking for?
3 What budget do you have in mind for senior care?
4 How soon do you need to find care?
5 Additional details

Thank you for your interest!

Our team will be in touch shortly to help with next steps.