West Hills Health & Rehabilitation Center

Nursing Home in Multnomah County

CMS overall rating Info The Overall CMS Rating is scored from 1 to 5 stars and combines results from health inspections, staffing levels, and quality measures. Health inspections carry the most weight. Staffing and quality scores can increase or decrease the final rating based on performance compared to state and national standards.
Calculator: See prices in your area
West Hills Health & Rehabilitation Center accepts Medicare, Medicaid, and private pay.

Overview of West Hills Health & Rehabilitation Center

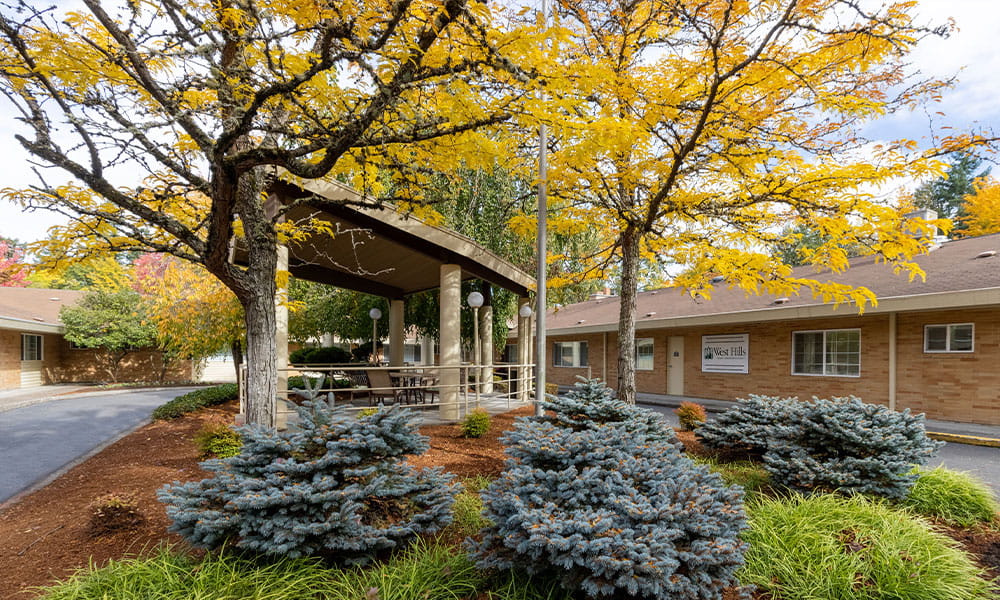
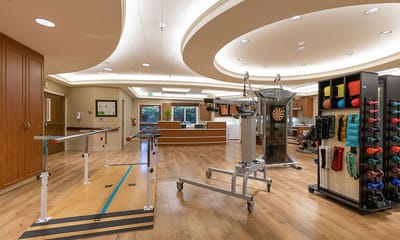
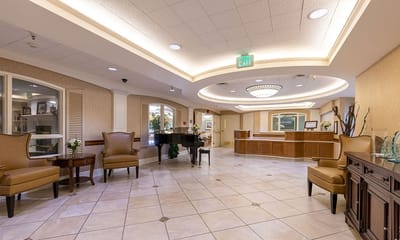
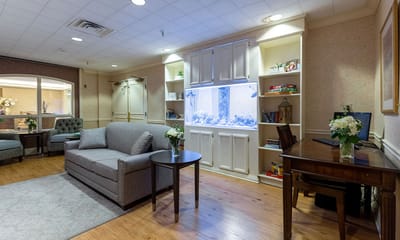
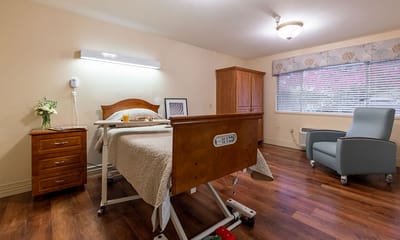
Live to your potential with Westhills Skilled Nursing & Rehabilitation, an esteemed community in Portland, OR, that offers rehabilitation, long-term care, respite care, and hospice care. Utilizing an award-winning care program, residents here experience the highest quality of care and support tailored to their needs and preferences. The community has been providing exceptional care since 1970, promoting a nurturing environment where residents feel at ease.

Here, residents are empowered to live actively with a jam-packed calendar of engaging activities and exciting events. Mealtimes are also something to anticipate, with delicious and healthy meals that cater to residents’ nutritional needs and preferences. The community strives to enhance residents’ living experiences, allowing them to jump back to their lives without worries and create more meaningful moments in their golden years. Proving its exceptional care, the community was awarded U.S. News & World Report’s Best Nursing Homes for Short-Term Rehabilitation.

(503) 244-1107

Quality ratings

Measured by Centers for Medicare & Medicaid Services (CMS)

Overall rating Info The Overall CMS Rating combines results from health inspections, staffing levels and quality measures. Health inspections carry the most weight. Staffing and quality scores can increase or decrease the final rating based on performance compared to state and national standards.
3/5 ■ Avg Oregon average: 3.0/5
Health Inspection Info Based on the results of the facility's three most recent standard inspections and any complaint investigations. CMS reviews the number, scope, and severity of deficiencies, with more recent findings weighted more heavily.
3/5 ▲ 0.2 Oregon average: 2.8/5
Staffing Info Measures average nursing staff hours per resident per day, including Registered Nurses (RNs) and total nursing staff. Ratings are adjusted based on the level of care residents require and are compared to state and national benchmarks.
4/5 ▲ 0.3 Oregon average: 3.7/5
Quality Measures Info Based on clinical and physical health indicators reported to CMS, such as hospital readmissions, falls, pressure ulcers, and improvements in mobility. These measures reflect how well residents' health needs are being managed.
4/5 ▲ 0.6 Oregon average: 3.4/5

Staffing hours breakdown

Info Daily nursing hours per resident by staff type, reported to CMS. Higher is generally better — compare this facility to state and national averages to see where staffing stands.

Hours per resident per day — compared to Oregon state averages

Total nursing care / resident Info This home is ranked 37th out of 78 homes in Oregon.

Total adjusted nursing hours per resident per day, combining RN, LPN, and aide time. CMS adjusts this for case-mix so facilities can be fairly compared.
5h 15m per day
Rank #37 / 78Nurse hours — state benchmarkedThis home is ranked 37th out of 78 homes in Oregon.Shows adjusted nurse hours per resident per day benchmarked to the Oregon average, with a ranking across 78 Oregon SNFs. More hours mean more direct care. The national average is about 3.5 hrs; below 3.0 is a red flag.
This facility Oregon avg (5h 15m per day)
vs Oregon avg
+0%

3 of 6 metrics below state avg

Standout metric LPN / LVN is +37% above state avg
Staff typeHours / dayvs state avg
Registered Nurse (RN) Info RNs hold the highest nursing license and can assess residents, interpret test results, and direct care plans. More RN hours per day often signals stronger clinical oversight and faster response to health changes. 31m per day ▼ 24% State avg: 41m per day · National avg: 41m per day
LPN / LVN Info Licensed Practical Nurses (LPNs) or Licensed Vocational Nurses (LVNs) deliver routine hands-on care — medication administration, wound dressing, and monitoring vital signs. They work under RN supervision and make up a large share of daily bedside care. 1h 14m per day ▲ 37% State avg: 54m per day · National avg: 52m per day
Nurse Aide Info Certified Nurse Aides (CNAs) provide the most direct day-to-day assistance: bathing, dressing, feeding, and mobility. Nurse aide hours are typically the largest staffing category and directly affect residents' quality of life. 3h 20m per day ■ Avg State avg: 3h 22m per day · National avg: 2h 21m per day
Total Nursing (Weekend) Info Combined nursing hours (RN + LPN + Nurse Aide) per resident per day on weekends. Staffing often drops on weekends — this figure reveals whether the facility maintains adequate coverage outside of weekday hours. 4h 29m per day ■ Avg State avg: 4h 23m per day · National avg: 3h 26m per day
Physical Therapist Info Hours per resident per day provided by licensed Physical Therapists (PTs) or PT Assistants. PT services help residents recover mobility after injury or illness and are especially important for post-acute (short-stay) rehabilitation. 4m per day ▼ 20% State avg: 5m per day · National avg: 4m per day
RN (Weekend) Info Registered nurse hours specifically on weekends. Facilities sometimes reduce RN presence on Saturdays and Sundays — a low weekend RN figure compared to weekday hours can indicate reduced clinical oversight when most administrative staff are absent. 16m per day ▼ 38% State avg: 26m per day · National avg: 29m per day

Capacity and availability

This home usually has availability

Occupancy lower than 85% suggests more openings may be available.

Lower occupancy than the Oregon average: 65.7%
Occupancy rate 50% Rank #62 / 74Occupancy rate — state benchmarkedThis home is ranked 62nd out of 74 homes in Oregon.Shows this facility's occupancy rate versus the Oregon average, with its statewide rank out of 74. Higher occupancy signals strong local demand and financial stability.
Avg. Length of Stay 57 days
Occupancy rate
50% Rank #62 / 74Occupancy rate — state benchmarkedThis home is ranked 62nd out of 74 homes in Oregon.Shows this facility's occupancy rate versus the Oregon average, with its statewide rank out of 74. Higher occupancy signals strong local demand and financial stability.
Avg. Length of Stay
57 days

Who this home usually serves

TYPE OF STAY

Mix of rehab and long-term care

This home supports both short-term rehab and long-term care, with residents staying for a wide range of durations.

Breakdown by payment type

Medicare

33% of new residents, usually for short-term rehab.

Typical stay 21 days

Private pay

53% of new residents, often for short stays.

Typical stay 1 - 2 months

Medicaid

14% of new residents, often for long-term daily care.

Typical stay 7 - 8 months

Finances and operations

Privately-owned community
Operated by a partnership between two or more business owners.
Home revenue
$19.2M
Operating loss
-$552.4K
Privately-owned community Operated by a partnership between two or more business owners.
Home revenue
$19.2M Rank #12 / 73Revenue — state benchmarkedThis home is ranked 12th out of 73 homes in Oregon.Shows this facility's annual revenue compared to the Oregon SNF average. Higher revenue generally means more resources for staffing and capital — read alongside Payroll %.
Operating loss
-$552.4K
Payroll costs Info The portion of the home's budget spent on staff, including nurses, caregivers, and other employees who support care and operations. Rank #9 / 73Payroll — state benchmarkedThis home is ranked 9th out of 73 homes in Oregon.Shows total annual staff payroll benchmarked to the Oregon average. Higher payroll investment relative to peers often signals better staffing and less reliance on cheaper contract labor.
$7.0M
36.3% of revenue Rank #36 / 73Payroll % — state benchmarkedThis home is ranked 36th out of 73 homes in Oregon.Shows payroll as a percentage of revenue versus the Oregon average. Well-run SNFs often land around 55–65%. Below 25% may signal understaffing or heavy agency use — read with Staffing ratings.
Other operating costs Info All remaining costs needed to run the home, such as food, utilities, building maintenance, supplies and administrative expenses.
$12.8M
Total costs $19.7M
Walk Score
Walk Score: 29 / 100 Rank #35 / 38Walk Score — state benchmarkedThis home is ranked 35th out of 38 homes in Oregon.Shows how walkable this facility's neighborhood is compared to the average Walk Score across Oregon SNFs. Higher scores benefit residents, families, and staff.
Somewhat walkable. A few nearby services may be reachable on foot, but most trips require transportation.

What does this home offer?

Housing options icon

Housing Options: 1 Bed

Building type icon
Building type icon

Building Type: Single-story

Dining services icon

Dining Services

Beauty services icon

Beauty Services

Housekeeping icon
Housekeeping icon

Housekeeping Services

Health Programs icon

Health Programs

Types of Care at West Hills Health & Rehabilitation Center

Nursing Home Respite Care Hospice Care

Contact West Hills Health & Rehabilitation Center

Health Inspection History

Inspections
Total health inspections 5

Oregon average 5.1


Last Health inspection on Apr 2025

Total health citations
26 Rank #30 / 76Health citations — state benchmarkedThis home is ranked 30th out of 76 homes in Oregon.Shows this facility's total health deficiency citations benchmarked to the Oregon state average, with a ranking across all 76 OR SNFs. Lower citation counts earn a better rank.

Oregon average 34

Citations per inspection
5.2 Rank #28 / 76Citations per inspection — state benchmarkedThis home is ranked 28th out of 76 homes in Oregon.Shows average deficiency citations per CMS inspection for this facility versus the Oregon mean across 76 SNFs with citation data. Lower is better.

Oregon average 6.86


Health citations are formal notices following inspections when they fail to comply with safety and care standards.

16 of 26 citations resulted from standard inspections; 5 of 26 resulted from complaint investigations; and 5 of 26 came from combined inspections (standard and complaint).

Breakdown of citation severity (last 3 years)
Critical Health citations More info
0
100% better than Oregon average

Oregon average: 0.5


Serious Health citations More info 1
17% better than Oregon average

Oregon average: 1.2

0 critical citations More info Oregon average: 0.5

1 serious citation More info Oregon average: 1.2

25 moderate citations More info Oregon average: 32.1

0 minor citations More info Oregon average: 0.2
Citations history (last 3 years)
Nutrition moderate citation Info Issues related to food quality, meal service, and resident's nutritional needs. Apr 25, 2025
Corrected

Resident Rights moderate citation Info Issues related to resident's rights, including dignity, privacy, and the ability to make decisions about their care. Apr 25, 2025
Corrected

Resident Rights moderate citation Info Issues related to resident's rights, including dignity, privacy, and the ability to make decisions about their care. Apr 25, 2025
Corrected

Pharmacy moderate citation Info Issues related to medication management, including how drugs are stored, administered, and monitored. Dec 11, 2024
Corrected

Financial Assistance for
Nursing Home in Oregon

West Hills Health & Rehabilitation Center is located in Portland, Oregon.
Here are the financial assistance programs available to residents in Oregon.

Get Financial aid guidance

Oregon Project Independence (OPI)

OPI

Age 60+
General Oregon resident, at risk of nursing home but not Medicaid-eligible.
Income Limits ~$2,000/month individual, varies
Asset Limits $5,000 individual
OR

Cost-sharing required; rural/urban balance.

Benefits
In-home care (3-5 hours/week) Respite (up to 10 days/year) Adult day care (~$70/day) Transportation (~5 trips/month)

Oregon Medicaid Community-Based Care

OR Medicaid CBC

Age 65+ or disabled
General Oregon resident, Medicaid-eligible, nursing home-level care need.
Income Limits (2025) ~$2,829/month 300% FBR, individual
Asset Limits $2,000 (individual), $3,000 (couple).
OR

High demand in urban areas (e.g., Portland).

Benefits
Personal care (5-7 hours/day) Respite (240 hours/year) Adult day care ($70/day) Home modifications ($1,500 avg.)

Program of All-Inclusive Care for the Elderly (PACE)

Oregon PACE (e.g., Providence ElderPlace)

Age 55+
General OR resident (specific counties), NFLOC, safe with PACE support.
Income Limits (2025) ~$2,829/month (Medicaid-eligible); private pay option available.
Asset Limits $2,000 (individual), $3,000 (couple) for Medicaid enrollees.
OR

Available in 11 counties (e.g., Multnomah, Washington); Providence ElderPlace dominant provider.

Benefits
Personal care (5-7 hours/day) Medical care Meals Transportation Respite Therapies

Medicare Savings Program (MSP)

Oregon Medicare Savings Program

Age 65+ or disabled
General OR resident, Medicare Part A/B.
Income Limits (2025) ~$2,510/month (QMB), ~$3,380/month (SLMB), ~$3,598/month (QI)—individual.
Asset Limits $9,430 (individual), $14,130 (couple).
OR

Three tiers; includes Extra Help for Part D; no waitlist.

Benefits
Covers Part B premiums ($174.70/month) Deductibles ($240/year) Copays (~20%)

Low-Income Home Energy Assistance Program (LIHEAP)

Oregon LIHEAP

Age 60+ prioritized
General OR resident, low-income household.
Income Limits (2025) ~$3,970/month individual, 185% FPL
Asset Limits Not assessed; income-focused.
OR

Covers gas, electric, oil; emergency aid via Oregon Energy Fund (OEF).

Benefits
Heating/cooling aid ($300-$1,000/season) Emergency aid ($500 max via OEF)

Family Caregiver Support Program (FCSP)

Oregon Family Caregiver Support Program

Age
General Caregivers of 60+ needing care or 55+ caregivers of others; OR resident; functional needs (2+ ADLs).
Income Limits (2025) No strict cap; prioritizes low-income ~$24,980/year
Asset Limits Not assessed; need-based.
OR

15 regions; rural priority; includes grandparent caregivers.

Benefits
Respite (4-6 hours/week or 5 days/year) Adult day care ($60/day) Training Supplies (~$500/year)

Senior Community Service Employment Program (SCSEP)

Oregon SCSEP

Age 55+
General unemployed, low-income, OR resident.
Income Limits (2025) ~$1,983/month 125% FPL
Asset Limits Not specified; income-focused.
OR

Priority for veterans, rural residents; Easterseals/AARP partnership.

Benefits
Paid training (~20 hours/week at ~$7.25/hour) Job placement

VA Aid and Attendance (A&A) and Housebound Benefits

Oregon VA Aid and Attendance/Housebound

Age 65+ or disabled veteran/spouse
General OR resident, wartime service, need for ADL help (A&A) or homebound.
Income Limits (2025) Net income < ~$1,984/month (veteran with dependent, A&A); pension offsets income.
Asset Limits ~$155,356 net worth limit
OR

High veteran demand; Oregon Veterans’ Homes option.

Benefits
Cash (~$1,433-$2,642/month veteran, ~$951-$1,318 spouse) for care costs (e.g., in-home, assisted living)

Senior Property Tax Deferral Program

Oregon Property Tax Deferral for Disabled and Senior Citizens

Age 62+
General OR resident, homeowner 5+ years, low-income.
Income Limits (2025) ~$58,000/year household, adjusted annually
Asset Limits Home value < county median; equity > 15%.
OR

Deferred taxes accrue 6% interest; repaid upon sale/death.

Benefits
Tax deferral (~$1,000-$3,000/year avg., varies by county)

Elderly Nutrition Program (ENP)

Oregon Elderly Nutrition Program

Age 60+
General OR resident (or spouse of any age); no income limit.
Income Limits (2025) None; donations encouraged.
Asset Limits Not assessed.
OR

Includes Meals on Wheels; prioritizes homebound/low-income.

Benefits
Home-delivered or congregate meals (~$5-$7/meal value, 5 meals/week avg.)

Places of interest near West Hills Health & Rehabilitation Center

Address 6.7 miles from city center Info Estimated distance in miles from Portland's city center to West Hills Health & Rehabilitation Center's address, calculated via Google Maps.

Calculate Travel Distance to West Hills Health & Rehabilitation Center

Add your location

Address

Staffing Data (Q2 2025)

This data corresponds to Q2 2025 and is based on CMS Payroll-Based Journal.

Total staff 289
Employees 127
Contractors 162
Staff to resident ratio 3.11:1
6% better than Oregon average

Oregon average ratio: 2.92:1

Avg staff/day 62
Average shift 8.5 hours
9% better than Oregon average

Oregon average: 7.8 hours

Total staff hours (quarter) 47,772
Nursing staff breakdown
Registered Nurse

Manages medical care and health needs.

Total count 22
Average shift length Info Average shift length. Calculated as total hours divided by days worked and average staff per day. 9.9 hours

This role is partially covered by contractors.

Licensed Practical Nurse

Assists with medical care and medications.

Total count 49
Average shift length Info Average shift length. Calculated as total hours divided by days worked and average staff per day. 10.1 hours

This role is partially covered by contractors.

Certified Nursing Assistant

Helps with daily care and mobility.

Total count 164
Average shift length Info Average shift length. Calculated as total hours divided by days worked and average staff per day. 8.5 hours

This role is partially covered by contractors.

Contractor staffing

Total hours from contractors

13%

6,208 contractor hours this quarter

Certified Nursing Assistant: 93 Licensed Practical Nurse: 25 Registered Nurse: 13 Respiratory Therapy Technician: 13 Physical Therapy Assistant: 7 Occupational Therapy Aide: 3 Medication Aide/Technician: 2 Speech Language Pathologist: 2 Physical Therapy Aide: 1 Therapeutic Recreation Specialist: 1 Qualified Social Worker: 1 Medical Director: 1
Staff by category
Certified Nursing Assistant719316423,95091100%8.5
Licensed Practical Nurse2425499,28491100%10.1
Medication Aide/Technician92113,35991100%9.9
Registered Nurse913222,4269099%9.9
Clinical Nurse Specialist4041,7738593%8.7
Mental Health Service Worker2021,0146571%8.3
Respiratory Therapy Technician013138538290%5.7
Physical Therapy Assistant0777647481%5.7
Other Dietary Services Staff3037607987%6.8
Dental Services Staff1014946167%8.1
Administrator1014886167%8
Dietitian1014886167%8
RN Director of Nursing1014696066%7.8
Physical Therapy Aide0114546167%7.4
Nurse Practitioner1014325459%8
Qualified Social Worker0112546571%3.9
Therapeutic Recreation Specialist0111913336%5.8
Occupational Therapy Aide0331816066%2.4
Speech Language Pathologist0221242325%5.4
Medical Director011161516%1.1
164 Certified Nursing Assistant
% of Days 100%
49 Licensed Practical Nurse
% of Days 100%
11 Medication Aide/Technician
% of Days 100%
22 Registered Nurse
% of Days 99%
4 Clinical Nurse Specialist
% of Days 93%
2 Mental Health Service Worker
% of Days 71%
13 Respiratory Therapy Technician
% of Days 90%
7 Physical Therapy Assistant
% of Days 81%
3 Other Dietary Services Staff
% of Days 87%
1 Dental Services Staff
% of Days 67%
1 Administrator
% of Days 67%
1 Dietitian
% of Days 67%
1 RN Director of Nursing
% of Days 66%
1 Physical Therapy Aide
% of Days 67%
1 Nurse Practitioner
% of Days 59%
1 Qualified Social Worker
% of Days 71%
1 Therapeutic Recreation Specialist
% of Days 36%
3 Occupational Therapy Aide
% of Days 66%
2 Speech Language Pathologist
% of Days 25%
1 Medical Director
% of Days 16%

Facility Characteristics

Source: CMS Long-Term Care Facility Characteristics (Data as of Jan 2026)

Total residents 93
Medicare
4
4.3% of residents
Medicaid
49
52.7% of residents
Private pay or other
40
43% of residents
Programs & Services
Residents Group

Residents meet regularly to discuss policies, care quality, and activities

Family Member Group

Family members meet regularly to discuss policies, care quality, and activities

Nurse Aide Training

State-approved Nurse Aide Training and Competency Evaluation Program on-site

Active Family Council

Organized group of family members that meets regularly to discuss facility policies, resident care, and activities.

Active Resident Council

Organized group of residents that meets regularly to discuss facility policies, quality of life, and activities.

Quality of care over time

These measures show how residents usually do over time at this home, based on health outcomes and preventive care.

High-risk clinical events score Info A composite score based on pressure ulcers, falls with injury, weight loss, walking ability decline, and activities of daily living decline. 7.9
25% better than Oregon average

Oregon average: 10.5

Functional decline score Info A composite score based on activities of daily living decline, walking ability decline, and incontinence. 16.1
23% better than Oregon average

Oregon average: 21.1

Long-stay resident measures
Above average Oregon avg: 3.4 Info CMS star rating based on long-stay quality measure performance. 5 stars = significantly above average, 1 star = significantly below average.
Need for Help with Daily Activities Increased Info Percent of long-stay residents whose need for help with daily activities has increased 8.2%
50% better than Oregon average

Oregon average: 16.3%

Walking Ability Worsened Info Percent of long-stay residents whose ability to move independently worsened 18.2%
27% better than Oregon average

Oregon average: 24.9%

Low Risk Residents with Bowel/Bladder Incontinence Info Percent of low risk long-stay residents who lose control of their bowels or bladder 22.0%
In line with Oregon average

Oregon average: 22.6%

Falls with Major Injury Info Percent of long-stay residents experiencing one or more falls with major injury 1.2%
49% better than Oregon average

Oregon average: 2.4%

High Risk Residents with Pressure Ulcers Info Percent of long-stay high risk residents with pressure ulcers 2.7%
62% better than Oregon average

Oregon average: 6.9%

Urinary Tract Infection Info Percent of long-stay residents with a urinary tract infection 0.8%
60% better than Oregon average

Oregon average: 2.1%

Lost Too Much Weight Info Percent of long-stay residents who lose too much weight 9.0%
72% worse than Oregon average

Oregon average: 5.3%

Depressive Symptoms Info Percent of long-stay residents who have depressive symptoms 4.4%
5% better than Oregon average

Oregon average: 4.6%

Antipsychotic Use Info Percent of long-stay residents who received an antipsychotic medication 19.5%
47% worse than Oregon average

Oregon average: 13.2%

Pneumococcal Vaccine Info Percent of long-stay residents assessed and appropriately given the pneumococcal vaccine 100.0%
In line with Oregon average

Oregon average: 95.7%

Influenza Vaccine Info Percent of long-stay residents assessed and appropriately given the seasonal influenza vaccine 91.0%
In line with Oregon average

Oregon average: 95.2%

Short-stay resident measures
Above average Oregon avg: 3.2 Info CMS star rating based on short-stay quality measure performance. 5 stars = much above average, 1 star = much below average.
Pneumococcal Vaccine Info Percent of short-stay residents assessed and appropriately given the pneumococcal vaccine 91.8%
6% better than Oregon average

Oregon average: 86.2%

Antipsychotic medication increase Info Percent of short-stay residents who newly received an antipsychotic medication 2.1%
13% worse than Oregon average

Oregon average: 1.8%

Influenza Vaccine Info Percent of short-stay residents assessed and appropriately given the seasonal influenza vaccine 93.1%
15% better than Oregon average

Oregon average: 81.2%

Re-hospitalized after SNF stay Info Percentage of short-stay residents who were re-hospitalized after their nursing home admission. 22.0%
In line with Oregon average

Oregon average: 21.6%

Emergency department visits Info Percentage of short-stay residents who had an outpatient emergency department visit. 10.8%
28% better than Oregon average

Oregon average: 15.1%

Falls with major injury Info Percentage of SNF residents who experience falls with major injury during their stay. 0.0%
100% better than Oregon average

Oregon average: 0.8%

Ability to care for self at discharge Info Percentage of residents at or above expected ability to care for themselves at discharge. 52.2%
In line with Oregon average

Oregon average: 53.7%

Successful return to home or community Info Rate of successful return to home or community from a skilled nursing facility. 66.6%
32% better than Oregon average

Oregon average: 50.6%

Penalties and fines

Federal penalties imposed by CMS for regulatory violations, including civil money penalties (fines) and denials of payment for new Medicare/Medicaid admissions.

Source: CMS Penalties Database (Data as of Jan 2026)

Total fines amount $13K
79% lower than Oregon average

Oregon average: $60K

Number of fines 1
41% fewer fines than Oregon average

Oregon average: 1.7

Payment Denials Info Serious action where Medicare and/or Medicaid temporarily stops payments for new residents until issues are fixed. 0
100% fewer payment denials than Oregon average

Oregon average: 0.1

Fines amount comparison
This facility $13K
Oregon average $60K
Penalty History

Penalties are imposed by CMS for violations of federal nursing home regulations.

1 penalty in the past 3 years

Dec 18, 2023 · $13K

Civil Money Penalty Info Fines imposed for noncompliance, which can be assessed per day or per instance of violation. Dec 18, 2023
$13K

Last updated: Jan 2026

Compare Nursing Homes around Multnomah County The information below is reported by the Oregon Department of Human Services, Aging and People with Disabilities.

4 facilities compared · CMS & OR Dept. of Health data · Updated Apr 2026

Filter by care type
Secora Rehabilitation of Cascadia
NH

Nursing Home Licensed facility providing 24/7 skilled nursing care for residents with complex, ongoing medical needs. Staffed by RNs, LPNs, and CNAs. Inspected and star-rated annually by CMS. Accepts Medicare (short-term rehab) and Medicaid (long-term care).

Portland (Lents)53 93.9% +43%5.56 +51%+6%0477.8049 62 -$11.4M$3.3M29.2%385264
West Hills Health & Rehabilitation Center
HC

Home Care Professional care delivered in the person's own home — from companionship and errands to skilled nursing and therapy. Allows seniors to age in place. Medicare covers skilled home health when medically necessary.

NH

Nursing Home Licensed facility providing 24/7 skilled nursing care for residents with complex, ongoing medical needs. Staffed by RNs, LPNs, and CNAs. Inspected and star-rated annually by CMS. Accepts Medicare (short-term rehab) and Medicaid (long-term care).

RC

Respite Care Short-term temporary care — days to weeks — to give family caregivers a break. Full care provided during the stay. Often used after hospitalization or to trial a facility before a permanent placement decision.

Portland (Southwest Portland)180 50.0% -24%5.24 -14%0%1265.2191 29 West Hills Convalescent Center Limited Partnership$19.2M$7.0M36.3%385112
Glisan Post Acute
NH

Nursing Home Licensed facility providing 24/7 skilled nursing care for residents with complex, ongoing medical needs. Staffed by RNs, LPNs, and CNAs. Inspected and star-rated annually by CMS. Accepts Medicare (short-term rehab) and Medicaid (long-term care).

Portland (Hazelwood)100 62.3% -5%5.89 -70%+12%3394.3677 80 Glisan Snf Healthcare, Llc$16.2M$5.2M32.5%385136
Friendship Health Center
NH

Nursing Home Licensed facility providing 24/7 skilled nursing care for residents with complex, ongoing medical needs. Staffed by RNs, LPNs, and CNAs. Inspected and star-rated annually by CMS. Accepts Medicare (short-term rehab) and Medicaid (long-term care).

Multnomah County (Reed)100 83.0% +26%6.70 +62%+28%2588.3366 74 Blades, Jeff$18.3M$7.8M42.7%385121

Guides for Better Senior Living

Care Cost Calculator: See Prices in Your Area

Nursing Home Data Explorer

Don’t Wait Too Long: 7 Red Flag Signs Your Parent Needs Assisted Living Now

The True Cost of Assisted Living in 2025 – And How Families Are Paying For It

Understanding Senior Living Costs: Pricing Models, Discounts & Financial Assistance

Explore Open Rooms
1 Contact details
2 What type of senior care service are you looking for?
3 What budget do you have in mind for senior care?
4 How soon do you need to find care?
5 Additional details

Thank you for your interest!

Our team will be in touch shortly to help with next steps.