Whitney Place Assisted Living and Memory Care
Nursing Home, Assisted Living & Memory Care · Middlesex County, MA
CMS overall rating Info The Overall CMS Rating is scored from 1 to 5 stars and combines results from health inspections, staffing levels, and quality measures. Health inspections carry the most weight. Staffing and quality scores can increase or decrease the final rating based on performance compared to state and national standards.

Whitney Place Assisted Living and Memory Care

Nursing Home, Assisted Living & Memory Care · Middlesex County, MA
CMS overall rating Info The Overall CMS Rating is scored from 1 to 5 stars and combines results from health inspections, staffing levels, and quality measures. Health inspections carry the most weight. Staffing and quality scores can increase or decrease the final rating based on performance compared to state and national standards.
Calculator: See prices in your area
Whitney Place Assisted Living and Memory Care accepts Medicare, Medicaid, and private pay.

Overview of Whitney Place Assisted Living and Memory Care

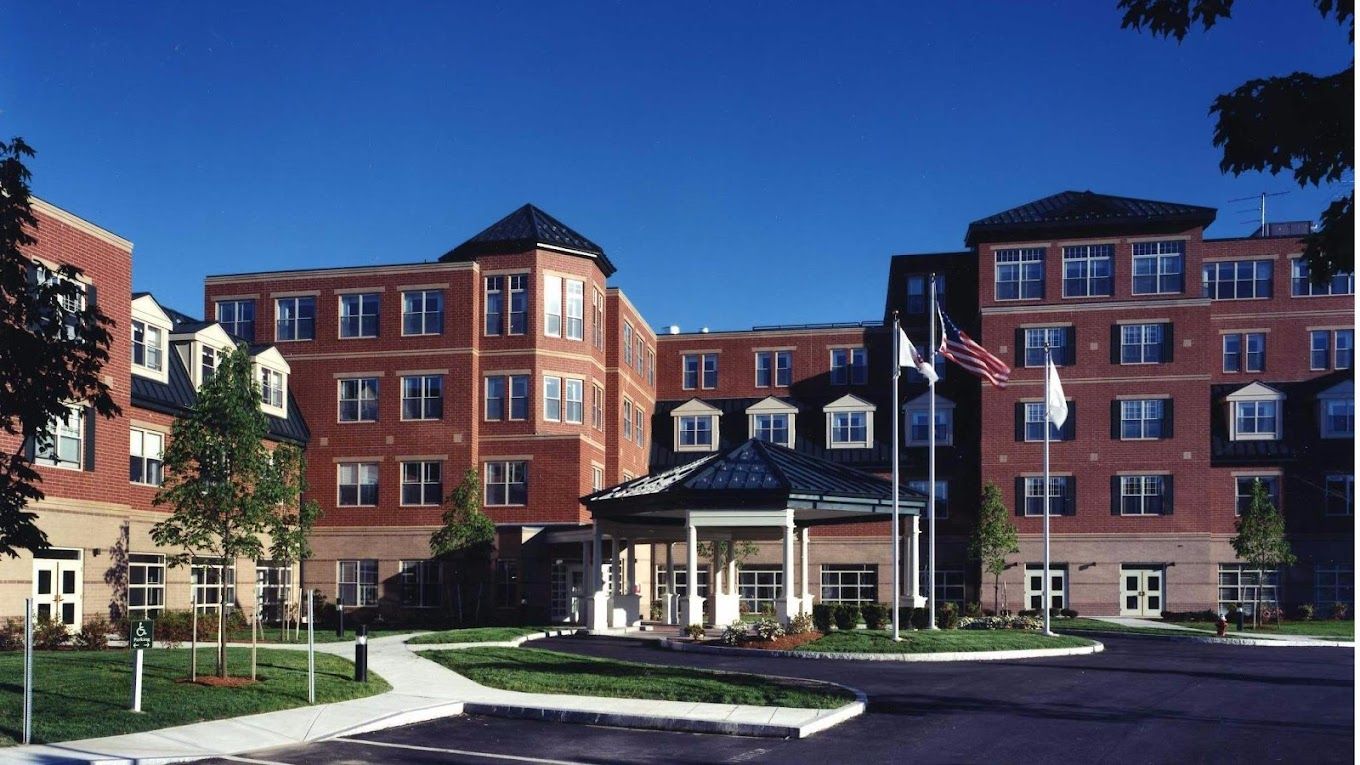
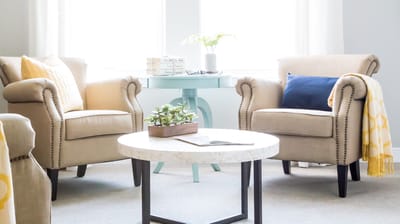
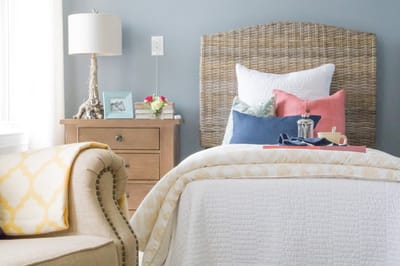
Situated in the welcoming community of Natic, MA, the Whitney Place Assisted Living and Memory Care is a trusted senior living community that offers assisted living and memory care services. A wide range of cozy and beautifully appointed accommodations including studio, one-bedroom, and companion suite are available for its residents. Having a trained and dedicated team, this community is committed to delivering a balance between freedom and senior care.

Experience its exceptional amenities and services including delightful and brain healthy chef-prepared meals, salon services, scheduled transportation services, and integenerational programming with adjacent child care center. Venture personalized wellness programs that fit to your endurance. Visit its museum and theater and participate in various excursions for continuing life enrichment. At Whitney Place Assisted Living and Memory Care, seniors are assured of a classic retirement.

(508) 655-5000

Quality ratings

Measured by Centers for Medicare & Medicaid Services (CMS)

Overall rating Info The Overall CMS Rating combines results from health inspections, staffing levels and quality measures. Health inspections carry the most weight. Staffing and quality scores can increase or decrease the final rating based on performance compared to state and national standards.
▲ 24.6% Above MA avg. ▲ 24.6% Above MA avg.Click the badge to see the full State ranking.Click here to see the full State ranking.
Health Inspection Info Based on the results of the facility's three most recent standard inspections and any complaint investigations. CMS reviews the number, scope, and severity of deficiencies, with more recent findings weighted more heavily.
▲ 33.3% Above MA avg. ▲ 33.3% Above MA avg.Click the badge to see the full State ranking.Click here to see the full State ranking.
Staffing Info Measures average nursing staff hours per resident per day, including Registered Nurses (RNs) and total nursing staff. Ratings are adjusted based on the level of care residents require and are compared to state and national benchmarks.
▼ 12.5% Below MA avg. ▼ 12.5% Below MA avg.Click the badge to see the full State ranking.Click here to see the full State ranking.
Quality Measures Info Based on clinical and physical health indicators reported to CMS, such as hospital readmissions, falls, pressure ulcers, and improvements in mobility. These measures reflect how well residents' health needs are being managed.
▼ 39.2% Below MA avg. ▼ 39.2% Below MA avg.Click the badge to see the full State ranking.Click here to see the full State ranking.

Staffing hours breakdown

Info Daily nursing hours per resident by staff type, reported to CMS. Higher is generally better — compare this facility to state and national averages to see where staffing stands.

Hours per resident per day — compared to Massachusetts state averages

Total nursing care / resident Info This home is ranked 23rd out of 89 homes in Massachusetts. Total adjusted nursing hours per resident per day, combining RN, LPN, and aide time. CMS adjusts this for case-mix so facilities can be fairly compared.
4h 11m per day
Rank #23 / 89Nurse hours — State benchmarkedThis home is ranked 23rd out of 89 homes in Massachusetts. Shows adjusted nurse hours per resident per day benchmarked to the Massachusetts average, with a ranking across 89 Massachusetts SNFs. More hours mean more direct care. The national average is about 3.5 hrs; below 3.0 is a red flag.Click the rank badge to see the full State ranking.Click here to see the full State ranking.
This facility Massachusetts avg (4h 18m per day)
vs Massachusetts avg
-3%

3 of 6 metrics below state avg

Standout metric LPN / LVN is +84% above state avg
Staff typeHours / Day / Residentvs state avg
Registered Nurse (RN) Info RNs hold the highest nursing license and can assess residents, interpret test results, and direct care plans. More RN hours per day often signals stronger clinical oversight and faster response to health changes. 19m per day ▼ 51% State avg: 39m per day · National avg: 41m per day
LPN / LVN Info Licensed Practical Nurses (LPNs) or Licensed Vocational Nurses (LVNs) deliver routine hands-on care — medication administration, wound dressing, and monitoring vital signs. They work under RN supervision and make up a large share of daily bedside care. 1h 47m per day ▲ 84% State avg: 58m per day · National avg: 52m per day
Nurse Aide Info Certified Nurse Aides (CNAs) provide the most direct day-to-day assistance: bathing, dressing, feeding, and mobility. Nurse aide hours are typically the largest staffing category and directly affect residents' quality of life. 2h 8m per day ▼ 6% State avg: 2h 16m per day · National avg: 2h 21m per day
Weekend Total Nursing Info Combined nursing hours (RN + LPN + Nurse Aide) per resident per day on weekends. Staffing often drops on weekends — this figure reveals whether the facility maintains adequate coverage outside of weekday hours. 3h 46m per day ▲ 9% State avg: 3h 27m per day · National avg: 3h 26m per day
Physical Therapist Info Hours per resident per day provided by licensed Physical Therapists (PTs) or PT Assistants. PT services help residents recover mobility after injury or illness and are especially important for post-acute (short-stay) rehabilitation. 6m per day ▲ 50% State avg: 4m per day · National avg: 4m per day
Weekend RN Info Registered nurse hours specifically on weekends. Facilities sometimes reduce RN presence on Saturdays and Sundays — a low weekend RN figure compared to weekday hours can indicate reduced clinical oversight when most administrative staff are absent. 14m per day ▼ 50% State avg: 28m per day · National avg: 29m per day

Types of Care at Whitney Place Assisted Living and Memory Care

Assisted Living Memory Care

Capacity and availability

This home usually has limited availability

Occupancy between 85% and 95% suggests balanced demand.

Higher occupancy than the Massachusetts average: 82%
Occupancy rate 88.5% Rank #36 / 92Occupancy rate — State benchmarkedThis home is ranked 36th out of 92 homes in Massachusetts. Shows this facility's occupancy rate versus the Massachusetts average, with its Statewide rank out of 92. Higher occupancy signals strong local demand and financial stability.Click the rank badge to see the full State ranking.Click here to see the full State ranking.
Avg. Length of Stay 136 days
Occupancy rate
88.5% Rank #36 / 92Occupancy rate — State benchmarkedThis home is ranked 36th out of 92 homes in Massachusetts. Shows this facility's occupancy rate versus the Massachusetts average, with its Statewide rank out of 92. Higher occupancy signals strong local demand and financial stability.Click the rank badge to see the full State ranking.Click here to see the full State ranking.
Avg. Length of Stay
136 days
Years in operation
29 years in operation Rank #37 / 180Years in operation — State benchmarkedThis home is ranked 37th out of 180 homes in Massachusetts. Shows how long this facility has been in operation compared to other Massachusetts SNFs. Longer operating histories may benefit residents, families, and staff.Click the rank badge to see the full State ranking.Click here to see the full State ranking.
A longer operating history, which may indicate experience navigating regulations and delivering ongoing care.
Walk Score
Walk Score: 65 / 100 Rank #196 / 499Walk Score — State benchmarkedThis home is ranked 196th out of 499 homes in Massachusetts. Shows how walkable this facility's neighborhood is compared to the average Walk Score across Massachusetts SNFs. Higher scores benefit residents, families, and staff.Click the rank badge to see the full State ranking.Click here to see the full State ranking.
Moderately walkable. Some errands can be accomplished on foot, with a mix of nearby amenities.

About this community

Type Of Units

Low Income Rooms Yes/No from payment or funding tags indicating low-income accessibility options in state disclosures—not a determination of personal eligibility. No

Safety & Compliance

Wheelchair Accessible
Hoyer Lift

Staffing

Key information about the people who lead and staff this community.

Leadership

ContactMr. Bill McGinley, Executive Director

Therapy & Rehabilitation

1 service
Rehabilitation Services

Staffing & Medical

1 service
24-Hour Staffing

Additional Services

1 service
Home Care

Amenities & Lifestyle

Salon
Housekeeping
Branded ProgramsTapestry Memory Care
Specific Programswellness activities

Dining & Nutrition

Food DescriptionThe dining program features chef-prepared meals in a structured and supportive environment, ensuring residents receive necessary nutrition while maintaining enjoyment and dignity.

Contact Whitney Place Assisted Living and Memory Care

Inspection History

In Massachusetts, the Executive Office of Elder Affairs (for assisted living facilities) and the Department of Public Health (for nursing homes) are the agencies authorized to inspect and report on facility safety.

Read the full inspection reports for this facility, including detailed findings and corrective actions.

Show Inspection Reports

Health Inspection History

Inspections since 2022
Total health inspections 7

Massachusetts average 4.5


Last Health inspection on Sep 2025

Total health citations
15 Rank #20 / 89Health citations — State benchmarkedThis home is ranked 20th out of 89 homes in Massachusetts. Shows this facility's total health deficiency citations benchmarked to the Massachusetts State average, with a ranking across all 89 MA SNFs. Lower citation counts earn a better rank.Click the rank badge to see the full State ranking.Click here to see the full State ranking.

Massachusetts average 32.7

Citations per inspection
2.14 Rank #4 / 89Citations per inspection — State benchmarkedThis home is ranked 4th out of 89 homes in Massachusetts. Shows average deficiency citations per CMS inspection for this facility versus the Massachusetts mean across 89 SNFs with citation data. Lower is better.Click the rank badge to see the full State ranking.Click here to see the full State ranking.

Massachusetts average 7.24


Health citations are formal notices following inspections when they fail to comply with safety and care standards.

8 of 15 citations resulted from standard inspections; and 4 of 15 resulted from complaint investigations.

Breakdown of citation severity (last 4 years)
Critical health citations
0
100% better than Massachusetts average

Massachusetts average: 0.3


Serious health citations
2
33% worse than Massachusetts average

Massachusetts average: 1.5

0 critical citations Massachusetts average: 0.3

2 serious citations Massachusetts average: 1.5

11 moderate citations Massachusetts average: 29.7

2 minor citations Massachusetts average: 1.3
Citations history (last 4 years)
Resident Rights moderate citation Sep 16, 2025
Corrected

Nursing Services minor citation Jan 07, 2025
Corrected

Care Planning minor citation Jan 07, 2025
Corrected

Care Planning moderate citation Jun 04, 2024
Corrected

Staffing Data

Reporting period: October 1 – December 31, 2025 (Q4 2025). Source: CMS Payroll-Based Journal report.

Total staff 96
Employees 54
Contractors 42
Staff to resident ratio 2.00:1
21% better than Massachusetts average
Massachusetts average ratio: 1.66:1 Massachusetts average ratio: 1.66:1See full Massachusetts ranking
Avg staff/day 27
Average shift 7.9 hours
0% compared with Massachusetts average
Massachusetts average: 7.9 hours Massachusetts average shift: 7.9 hoursSee full Massachusetts ranking
Total staff hours (quarter) 19,508

Nursing staff breakdown

Q4 2025 · Oct 1 – Dec 31 More info This data comes from the CMS Payroll-Based Journal report covering October 1 – December 31, 2025.
Registered Nurse

Manages medical care and health needs.

RN Staff 7
Average shift length Info Average shift length. Calculated as total hours divided by days worked and average staff per day. 8 hours

This role is partially covered by contractors.

Licensed Practical Nurse

Assists with medical care and medications.

LPN Staff 22
Average shift length Info Average shift length. Calculated as total hours divided by days worked and average staff per day. 9 hours

This role is partially covered by contractors.

Certified Nursing Assistant

Helps with daily care and mobility.

CNA Staff 32
Average shift length Info Average shift length. Calculated as total hours divided by days worked and average staff per day. 8.7 hours

This role is partially covered by contractors.

Contractor staffing

Q4 2025 · Oct 1 – Dec 31 More info This data comes from the CMS Payroll-Based Journal report covering October 1 – December 31, 2025.

Total hours from contractors

6%

1,179 contractor hours this quarter

Certified Nursing Assistant: 13 Licensed Practical Nurse: 5 Respiratory Therapy Technician: 5 Registered Nurse: 5 Physical Therapy Assistant: 4 Occupational Therapy Assistant: 3 Speech Language Pathologist: 2 Mental Health Service Worker: 2 Medical Director: 1 Qualified Social Worker: 1 Physical Therapy Aide: 1

Staff by category

Q4 2025 · Oct 1 – Dec 31 More info This data comes from the CMS Payroll-Based Journal report covering October 1 – December 31, 2025.
Certified Nursing Assistant1913328,51992100%8.7
Licensed Practical Nurse175225,66392100%9
Other Dietary Services Staff7071,1168896%6.9
Registered Nurse2575645964%8
Clinical Nurse Specialist2025126267%8
Mental Health Service Worker1234966065%8
Administrator1014886166%8
Nurse Practitioner1014806065%8
RN Director of Nursing1014645863%8
Qualified Social Worker0112574751%5.5
Physical Therapy Assistant0442155661%3.7
Speech Language Pathologist0222125459%3.9
Occupational Therapy Aide1011763235%5.5
Nurse Aide in Training1011121516%7.5
Respiratory Therapy Technician055943538%2.6
Dietitian10172910%8
Occupational Therapy Assistant033312932%1
Medical Director011241213%2
Physical Therapy Aide0111355%2.7
32 Certified Nursing Assistant
% of Days 100%
22 Licensed Practical Nurse
% of Days 100%
7 Other Dietary Services Staff
% of Days 96%
7 Registered Nurse
% of Days 64%
2 Clinical Nurse Specialist
% of Days 67%
3 Mental Health Service Worker
% of Days 65%
1 Administrator
% of Days 66%
1 Nurse Practitioner
% of Days 65%
1 RN Director of Nursing
% of Days 63%
1 Qualified Social Worker
% of Days 51%
4 Physical Therapy Assistant
% of Days 61%
2 Speech Language Pathologist
% of Days 59%
1 Occupational Therapy Aide
% of Days 35%
1 Nurse Aide in Training
% of Days 16%
5 Respiratory Therapy Technician
% of Days 38%
1 Dietitian
% of Days 10%
3 Occupational Therapy Assistant
% of Days 32%
1 Medical Director
% of Days 13%
1 Physical Therapy Aide
% of Days 5%

Penalties and fines

Includes penalties issued in 2024

Federal penalties imposed by CMS for regulatory violations, including civil money penalties (fines) and denials of payment for new Medicare/Medicaid admissions.

Source: CMS Penalties Database (Data as of Jan 2026)

Total fines amount $20K Rank #58 / 90Federal fines — State benchmarkedThis home is ranked 58th out of 90 homes in Massachusetts. Shows this facility's cumulative CMS federal fine dollars versus the Massachusetts average among facilities with fines, and where it ranks among 90 skilled nursing facilities in the pool. Lower total dollars mean a better rank.Click the rank badge to see the full State ranking.Click here to see the full State ranking.
72% lower than Massachusetts average

Massachusetts average: $72K

Number of fines 2
17% more fines than Massachusetts average

Massachusetts average: 1.7

Payment Denials Info Serious action where Medicare and/or Medicaid temporarily stops payments for new residents until issues are fixed. 0
100% fewer payment denials than Massachusetts average

Massachusetts average: 0.1

Fines amount comparison
This facility $20K
Massachusetts average $72K
Penalty History

Penalties are imposed by CMS for violations of federal nursing home regulations.

1 penalty in the past 3 years

Jan 17, 2024 · $11K

Civil Money Penalty Info Fines imposed for noncompliance, which can be assessed per day or per instance of violation. Jan 17, 2024
$11K

Last updated: Jan 2026

Quality of care over time

These measures show how residents usually do over time at this home, based on health outcomes and preventive care.

High-risk clinical events score Info A composite score based on pressure ulcers, falls with injury, weight loss, walking ability decline, and activities of daily living decline. 13.3
31% worse than Massachusetts average

Massachusetts average: 10.2

Functional decline score Info A composite score based on activities of daily living decline, walking ability decline, and incontinence. 21.8
9% worse than Massachusetts average

Massachusetts average: 20.0

Long-stay resident measures
Significantly below average Info CMS star rating based on long-stay quality measure performance. 5 stars = significantly above average, 1 star = significantly below average.
Need for Help with Daily Activities Increased Info Percent of long-stay residents whose need for help with daily activities has increased 27.6%
48% worse than Massachusetts average

Massachusetts average: 18.7%

Walking Ability Worsened Info Percent of long-stay residents whose ability to move independently worsened 25.1%
30% worse than Massachusetts average

Massachusetts average: 19.3%

Low Risk Residents with Bowel/Bladder Incontinence Info Percent of low risk long-stay residents who lose control of their bowels or bladder 12.7%
43% better than Massachusetts average

Massachusetts average: 22.1%

Falls with Major Injury Info Percent of long-stay residents experiencing one or more falls with major injury 4.6%
29% worse than Massachusetts average

Massachusetts average: 3.6%

High Risk Residents with Pressure Ulcers Info Percent of long-stay high risk residents with pressure ulcers 4.1%
12% better than Massachusetts average

Massachusetts average: 4.7%

Urinary Tract Infection Info Percent of long-stay residents with a urinary tract infection 3.0%
45% worse than Massachusetts average

Massachusetts average: 2.1%

Lost Too Much Weight Info Percent of long-stay residents who lose too much weight 5.2%
In line with Massachusetts average

Massachusetts average: 5.2%

Depressive Symptoms Info Percent of long-stay residents who have depressive symptoms 1.5%
86% better than Massachusetts average

Massachusetts average: 10.7%

Antipsychotic Use Info Percent of long-stay residents who received an antipsychotic medication 27.2%
34% worse than Massachusetts average

Massachusetts average: 20.3%

Pneumococcal Vaccine Info Percent of long-stay residents assessed and appropriately given the pneumococcal vaccine 94.8%
In line with Massachusetts average

Massachusetts average: 91.9%

Influenza Vaccine Info Percent of long-stay residents assessed and appropriately given the seasonal influenza vaccine 100.0%
5% better than Massachusetts average

Massachusetts average: 94.8%

Hospitalizations per 1,000 days Info Number of hospitalizations per 1,000 long-stay resident days. 2.79
50% worse than Massachusetts average

Massachusetts average: 1.86

ED visits per 1,000 days Info Number of outpatient emergency department visits per 1,000 long-stay resident days. 1.79
16% worse than Massachusetts average

Massachusetts average: 1.54

Short-stay resident measures
Below average Info CMS star rating based on short-stay quality measure performance. 5 stars = much above average, 1 star = much below average.
Pneumococcal Vaccine Info Percent of short-stay residents assessed and appropriately given the pneumococcal vaccine 72.9%
5% worse than Massachusetts average

Massachusetts average: 76.7%

Antipsychotic medication increase Info Percent of short-stay residents who newly received an antipsychotic medication 0.0%
100% better than Massachusetts average

Massachusetts average: 1.3%

Influenza Vaccine Info Percent of short-stay residents assessed and appropriately given the seasonal influenza vaccine 94.4%
21% better than Massachusetts average

Massachusetts average: 77.7%

Re-hospitalized after SNF stay Info Percentage of short-stay residents who were re-hospitalized after their nursing home admission. 20.7%
20% better than Massachusetts average

Massachusetts average: 25.8%

Emergency department visits Info Percentage of short-stay residents who had an outpatient emergency department visit. 13.8%
17% worse than Massachusetts average

Massachusetts average: 11.8%

Falls with major injury Info Percentage of SNF residents who experience falls with major injury during their stay. 2.1%
177% worse than Massachusetts average

Massachusetts average: 0.8%

Ability to care for self at discharge Info Percentage of residents at or above expected ability to care for themselves at discharge. 54.3%
In line with Massachusetts average

Massachusetts average: 53.7%

Successful return to home or community Info Rate of successful return to home or community from a skilled nursing facility. 58.4%
15% better than Massachusetts average

Massachusetts average: 50.6%

Breakdown by payment type

Medicare

76% of new residents, usually for short-term rehab.

Typical stay 21 days

Private pay

21% of new residents, often for short stays.

Typical stay 11 months

Medicaid

4% of new residents, often for long-term daily care.

Typical stay 4 - 5 years

Facility Characteristics

Source: CMS Long-Term Care Facility Characteristics (Data as of Jan 2026)

Total residents 48
Medicare
4
8.3% of residents
Medicaid
28
58.3% of residents
Private pay or other
16
33.3% of residents

Finances and operations

Privately-owned community
Operated by a partnership between two or more business owners.
Home revenue
$16.4M
Operating loss
-$298.0K
Privately-owned community Operated by a partnership between two or more business owners.
Home revenue
$16.4M Rank #62 / 92Revenue — State benchmarkedThis home is ranked 62nd out of 92 homes in Massachusetts. Shows this facility's annual revenue compared to the Massachusetts SNF average. Higher revenue generally means more resources for staffing and capital — read alongside Payroll %.Click the rank badge to see the full State ranking.Click here to see the full State ranking.
Operating loss
-$298.0K
Payroll costs Info The portion of the home's budget spent on staff, including nurses, caregivers, and other employees who support care and operations. Rank #59 / 92Payroll — State benchmarkedThis home is ranked 59th out of 92 homes in Massachusetts. Shows total annual staff payroll benchmarked to the Massachusetts average. Higher payroll investment relative to peers often signals better staffing and less reliance on cheaper contract labor.Click the rank badge to see the full State ranking.Click here to see the full State ranking.
$8.7M
53% of revenue Rank #32 / 92Payroll % — State benchmarkedThis home is ranked 32nd out of 92 homes in Massachusetts. Shows payroll as a percentage of revenue versus the Massachusetts average. Well-run Massachusetts SNFs typically land around 54–65% — the top third Statewide. Below 25% may signal understaffing or heavy agency use — read with Staffing ratings.Click the rank badge to see the full State ranking.Click here to see the full State ranking.
Other operating costs Info All remaining costs needed to run the home, such as food, utilities, building maintenance, supplies and administrative expenses.
$8.0M
Total costs $16.7M

What does this home offer?

Room sizes icon
Room sizes icon

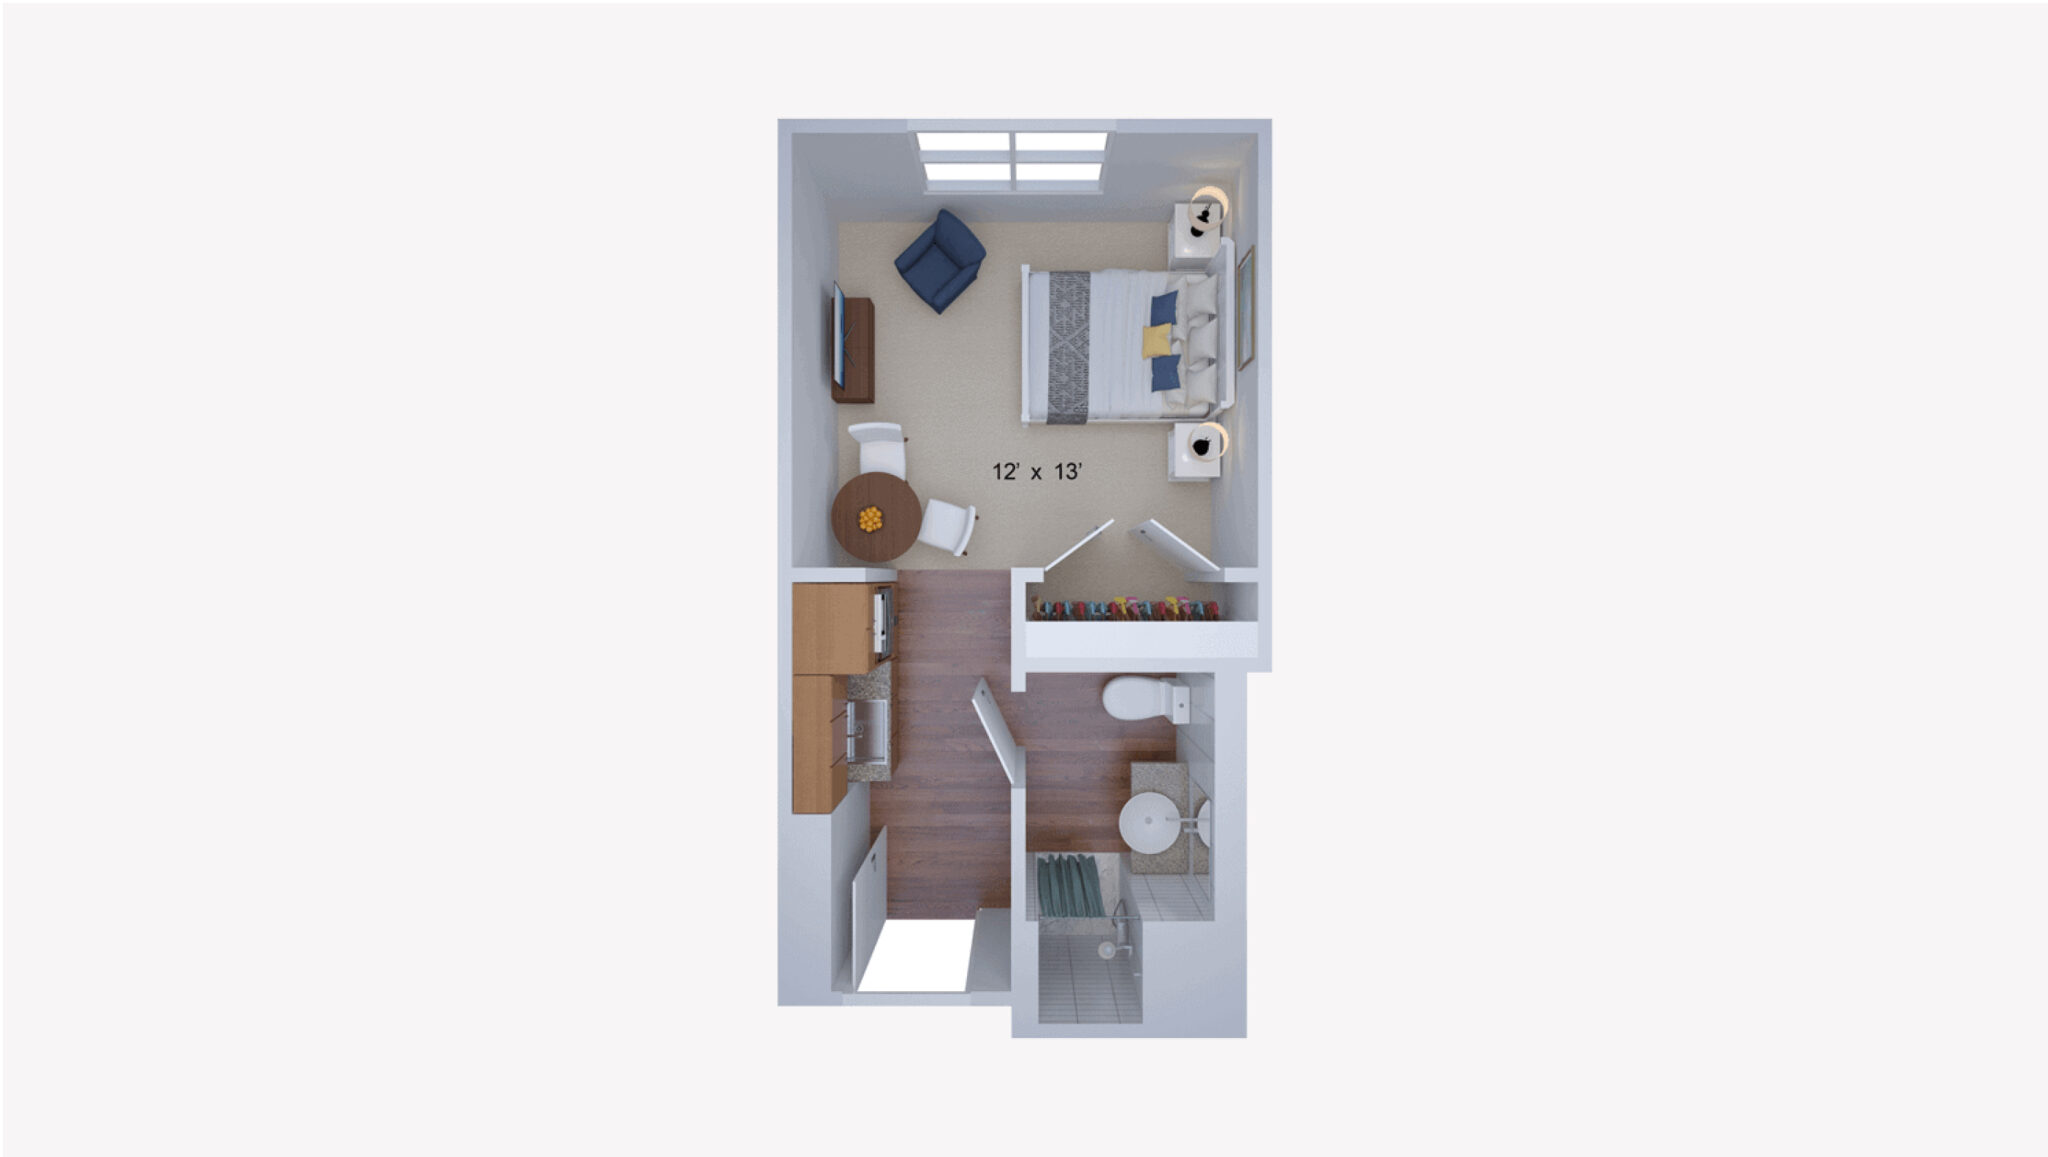
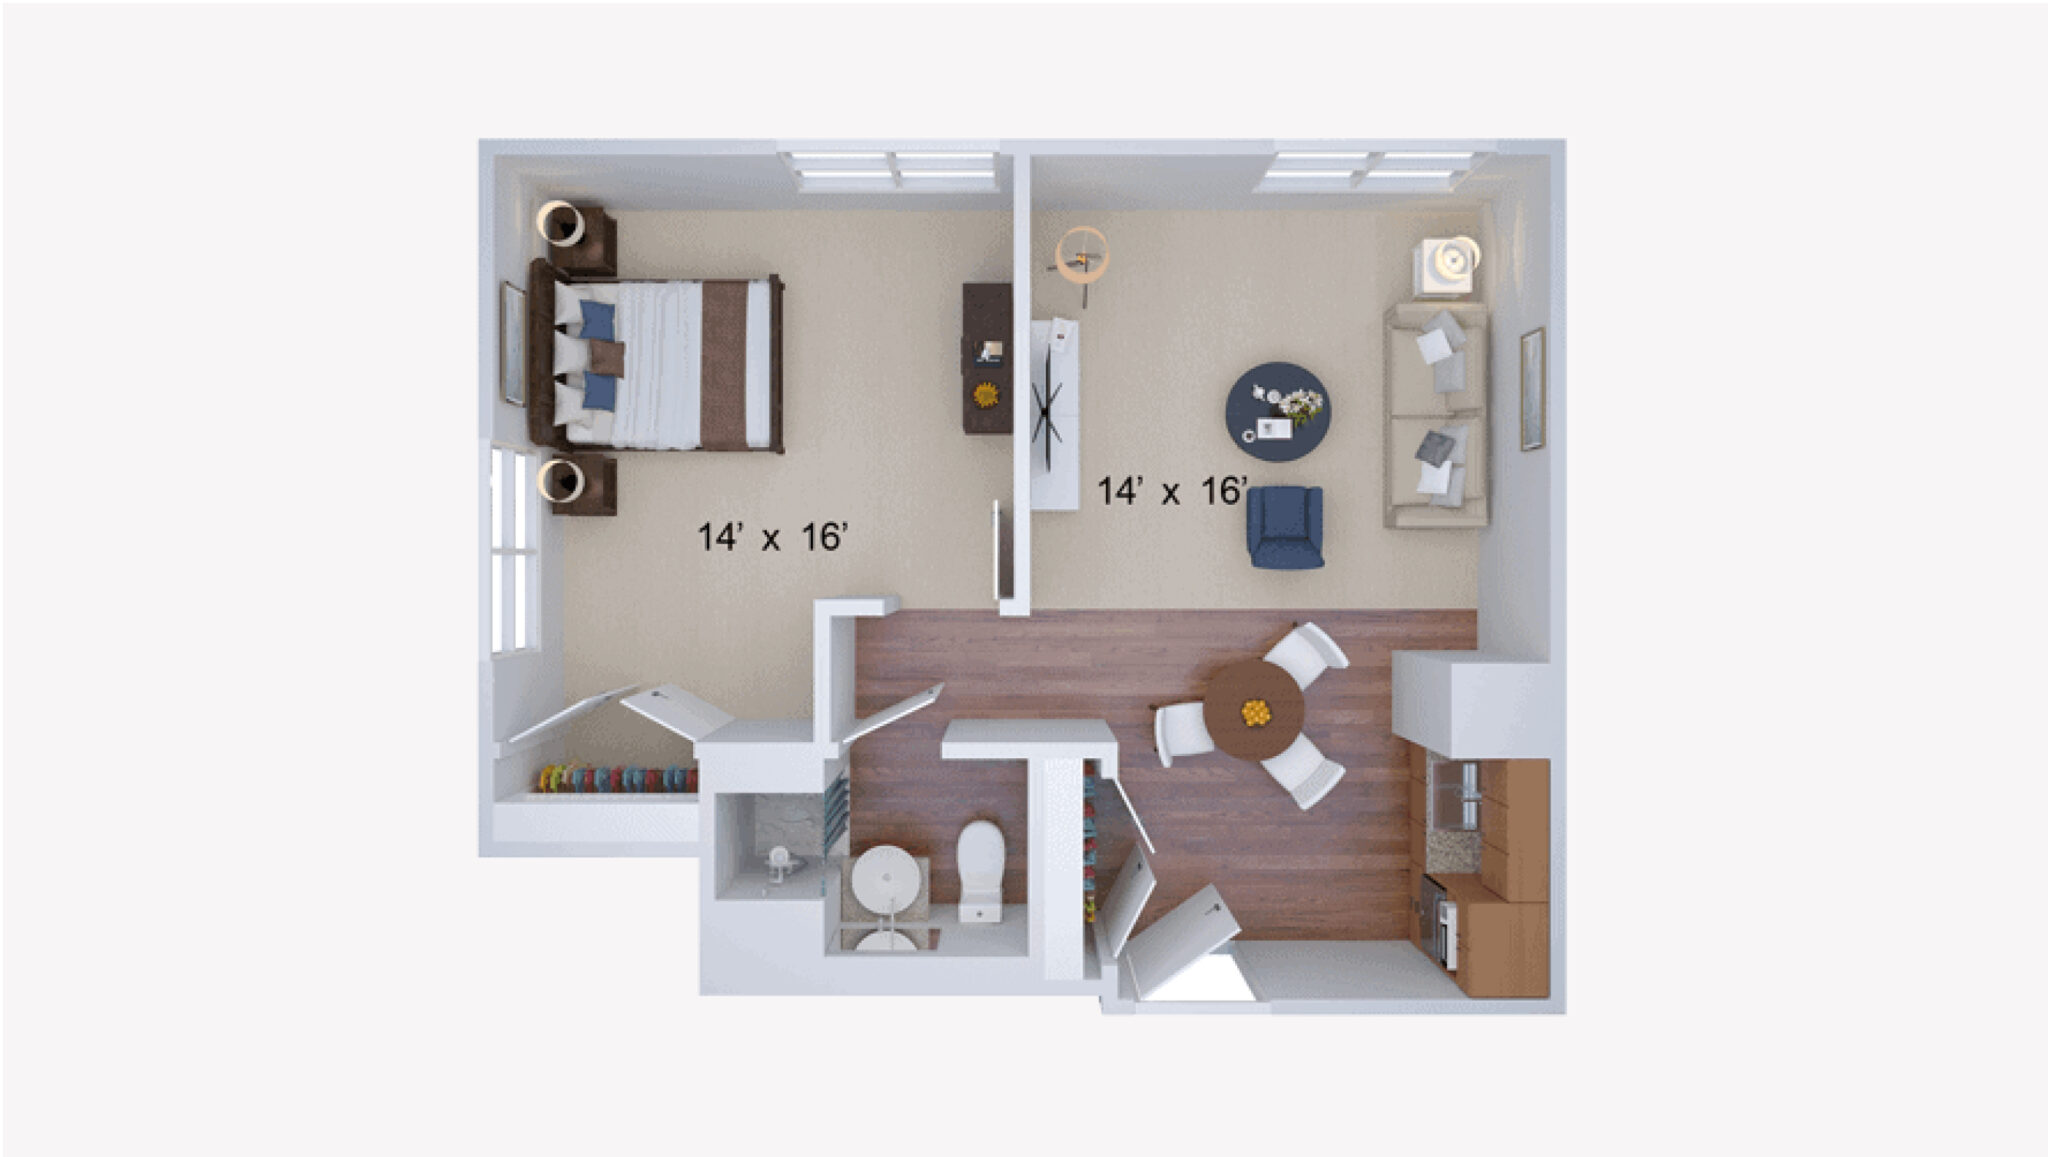
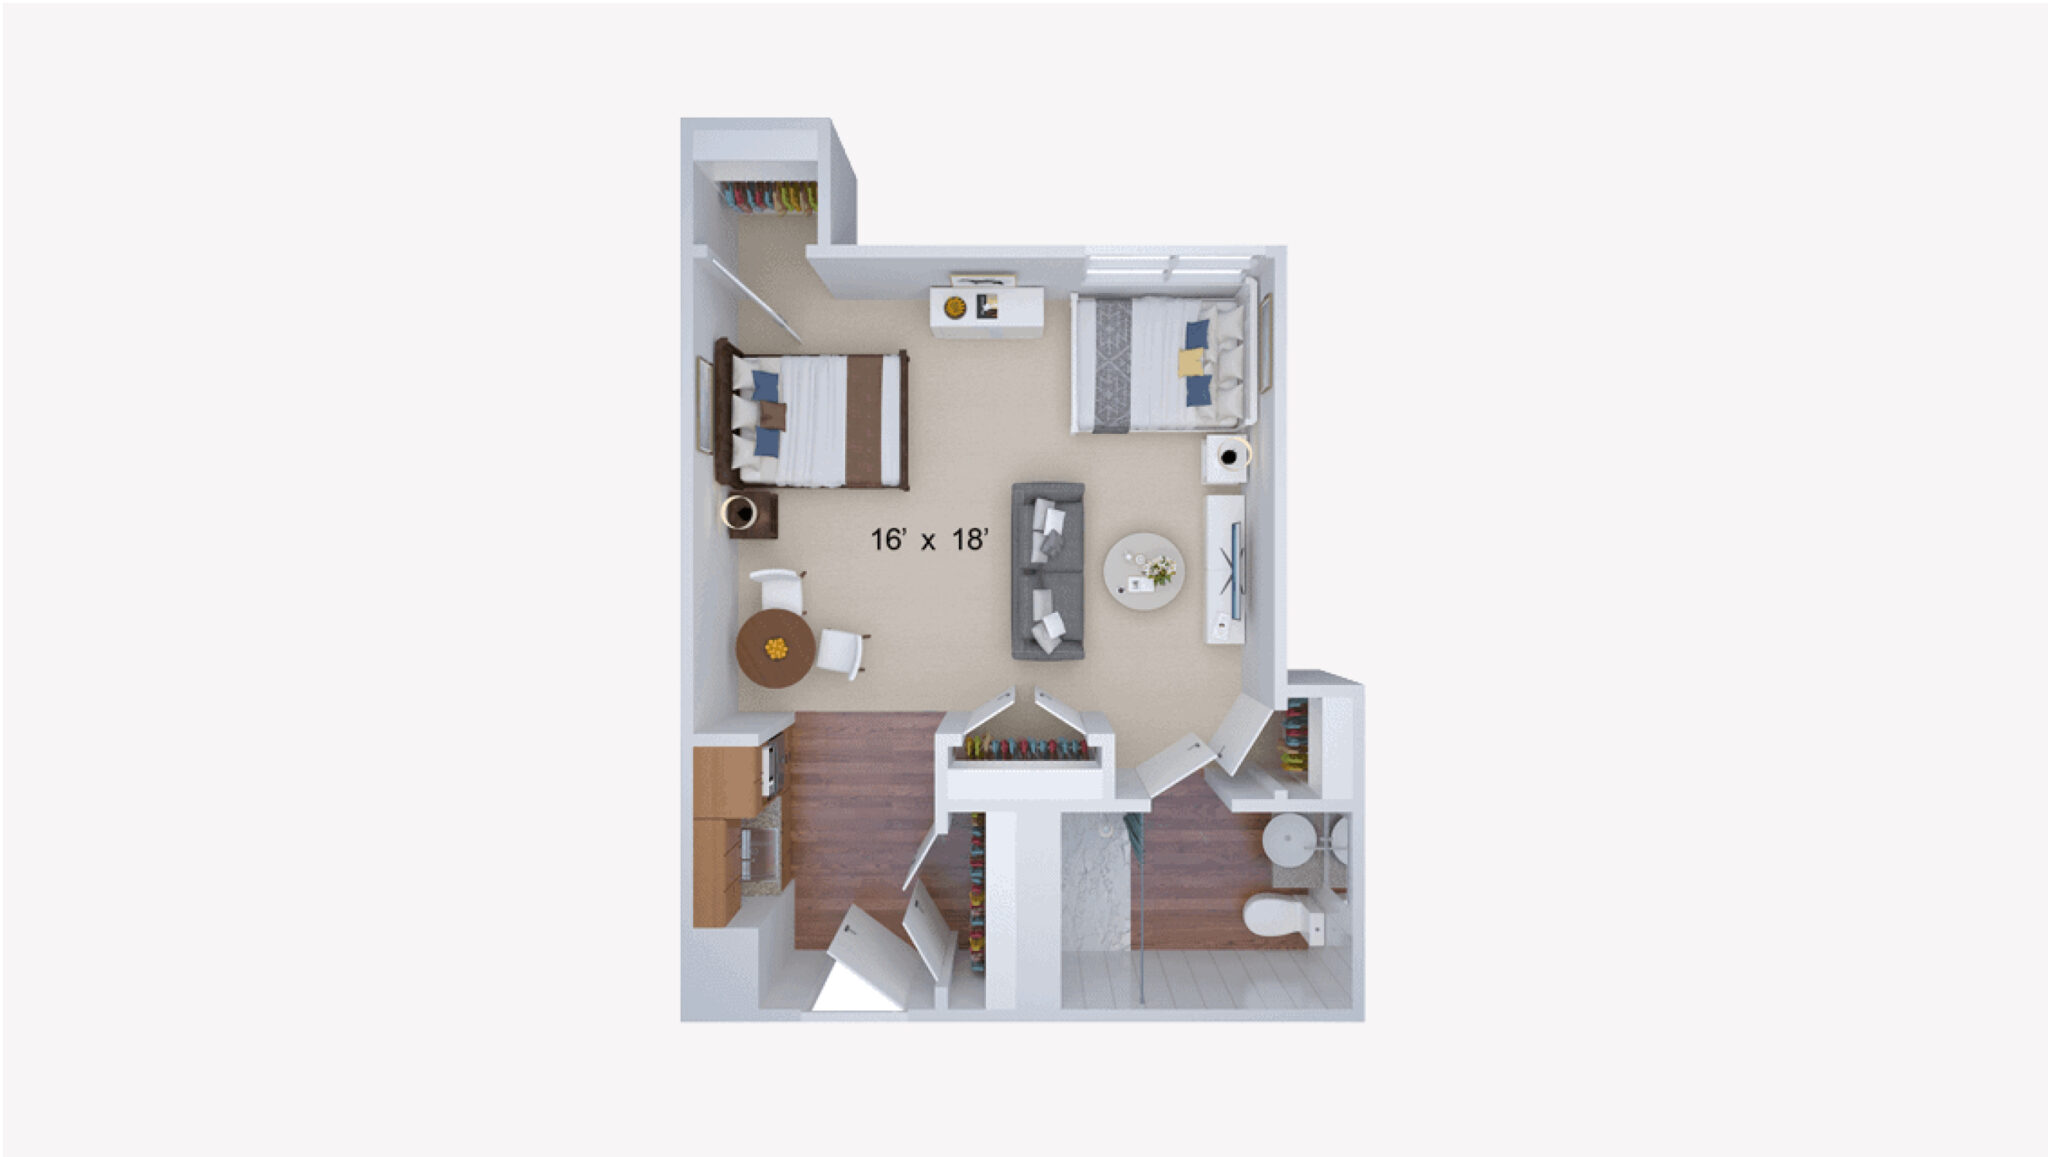
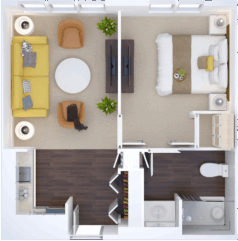
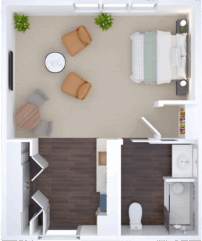
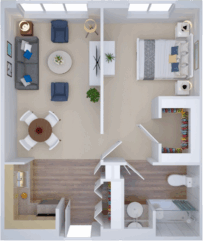
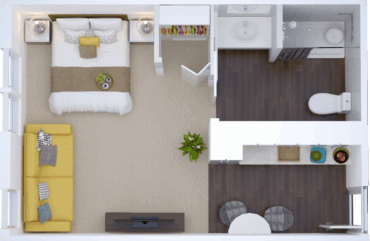
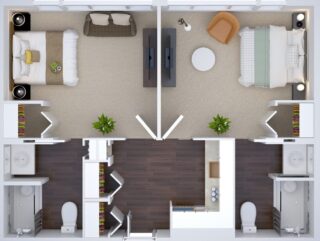
Room Sizes: 323 / 451 / 638 sq. ft

Housing options icon

Housing Options: Studio / 1 Bed / Companion

Building type icon
Building type icon

Building Type: Mid-rise

Transportation services icon

Transportation Services

Who this home usually serves

TYPE OF STAY

Mostly short-term rehab stays

Most residents typically stay for a few weeks or months before returning home or moving on.

Living Spaces & Floor Plans for Whitney Place Assisted Living and Memory Care

Whitney Place Assisted Living And Memory Care
Whitney Place Assisted Living And Memory Care1
Whitney Place Assisted Living And Memory Care2

Places of interest near Whitney Place Assisted Living and Memory Care

Address 3.3 miles from city center Info Estimated distance in miles from Natick's city center to Whitney Place Assisted Living and Memory Care's address, calculated via Google Maps.

Calculate Travel Distance to Whitney Place Assisted Living and Memory Care

Add your location

Address

Financial Assistance for
Nursing Home in Massachusetts

Whitney Place Assisted Living and Memory Care is located in Natick, Massachusetts.
Here are the financial assistance programs available to residents in Massachusetts.

Get Financial aid guidance

Home Care Program

MassHealth Home Care

Age 60+
General Massachusetts resident, at risk of nursing home placement.
Income Limits (2025) ~$1,500/month individual, varies by region
Asset Limits $2,000 individual, excludes home, car
MA

Coordinated through Aging Services Access Points (ASAPs); high demand in urban areas.

Benefits
In-home care (3-5 hours/day) Homemaker services Respite care (up to 14 days/year) Adult day care (~$75/day)

Frail Elder Waiver

Massachusetts Medicaid FE Waiver

Age 65+
General Massachusetts resident, Medicaid-eligible, nursing home-level care need.
Income Limits (2025) ~$2,829/month 300% FBR, individual
Asset Limits $2,000 (individual), $3,000 (couple).
MA

Requires clinical eligibility determination.

Benefits
Personal care (5-7 hours/day) Respite care (240 hours/year) Adult day care (~$75/day) Home health services

Senior Care Options (SCO)

Massachusetts Senior Care Options

Age 65+
General Massachusetts resident, eligible for MassHealth (Medicare optional), nursing home-level care need.
Income Limits (2025) ~$2,829/month (300% FBR, individual); QIT allowed.
Asset Limits $2,000 (individual), $3,000 (couple) (excludes home up to $713,000, car).
MA

Not available in Dukes/Nantucket Counties; multiple SCO providers (e.g., CCA, Tufts).

Benefits
Personal care (5-7 hours/day) Medical care Respite (240 hours/year) Adult

Medicare Savings Program (MSP)

Massachusetts Medicare Savings Program (MassHealth Buy-In)

Age 65+ or disabled
General Massachusetts resident, Medicare Part A/B.
Income Limits (2025) ~$2,510/month (QMB), ~$3,380/month (SLMB), ~$3,598/month (QI)—individual.
Asset Limits $9,430 (individual), $14,130 (couple).
MA

Three tiers; no waitlist; includes Extra Help for Part D.

Benefits
Covers Part B premiums ($174.70/month) Deductibles ($240/year) Copays (~20%)

National Family Caregiver Support Program (NFCSP) Respite

Massachusetts NFCSP Respite Care

Age
General Caregivers of 60+ needing care or 55+ caregivers of others; Massachusetts resident; functional needs (2+ ADLs).
Income Limits (2025) Prioritizes ~$24,980/year (individual); no strict cap.
Asset Limits Not assessed; need-based.
MA

27 ASAPs; prioritizes low-income, rural caregivers.

Benefits
Respite (4-6 hours/week or 5 days/year) Adult day care ($60/day) Caregiver training Supplies (~$500/year)

Prescription Advantage

Massachusetts Prescription Advantage

Age 65+ or disabled
General Massachusetts resident, enrolled in Medicare Part D (or ineligible for Medicare).
Income Limits (2025) No strict limit; copays vary by income ~$24,980-$75,000/year individual
Asset Limits Not assessed.
MA

Supplements Medicare Part D; no enrollment fee for low-income.

Benefits
Covers prescription copays ($5-$40/drug) Fills coverage gaps Catastrophic cost protection ($4,000+ covered)

VA Aid and Attendance (A&A) and Housebound Benefits

Massachusetts VA Aid and Attendance/Housebound

Age 65+ or disabled veteran/spouse
General Massachusetts resident, wartime service, need for ADL help (A&A) or homebound.
Income Limits (2025) Net income < ~$1,984/month (veteran with dependent, A&A); pension offsets income.
Asset Limits ~$155,356 net worth limit
MA

High veteran demand statewide.

Benefits
Cash (~$1,433-$2,642/month veteran, ~$951-$1,318 spouse) for care costs (e.g., in-home, assisted living)

Frequently Asked Questions about Whitney Place Assisted Living and Memory Care

What neighborhood is Whitney Place Assisted Living and Memory Care in?

Whitney Place Assisted Living and Memory Care is in the Vision Drive neighborhood of Natick.

Is Whitney Place Assisted Living and Memory Care in a walkable area?

Whitney Place Assisted Living and Memory Care has a walk score of 65. Moderately walkable. Some errands can be accomplished on foot, with a mix of nearby amenities.

Does Whitney Place Assisted Living and Memory Care have different floorplan options?

Yes — see the floorplan options available at Whitney Place Assisted Living and Memory Care on this page.

What is the address of Whitney Place Assisted Living and Memory Care?

Whitney Place Assisted Living and Memory Care is located at 3 Vision Dr, Natick, MA 01760, United States.

What is the phone number of Whitney Place Assisted Living and Memory Care?

(508) 655-5000 will put you in contact with the team at Whitney Place Assisted Living and Memory Care.

Is Whitney Place Assisted Living and Memory Care Medicare or Medicaid certified?

Yes — Whitney Place Assisted Living and Memory Care is a CMS-certified provider of Medicare and Medicaid.

Guides for Better Senior Living

Care Cost Calculator: See Prices in Your Area

Nursing Home Data Explorer

Don’t Wait Too Long: 7 Red Flag Signs Your Parent Needs Assisted Living Now

The True Cost of Assisted Living in 2025 – And How Families Are Paying For It

Understanding Senior Living Costs: Pricing Models, Discounts & Financial Assistance

Explore Open Rooms
1 Contact details
2 What type of senior care service are you looking for?
3 What budget do you have in mind for senior care?
4 How soon do you need to find care?
5 Additional details

Thank you for your interest!

Our team will be in touch shortly to help with next steps.