Lourdes Senior Community
Nursing Home, Assisted Living, Hospice Care, Independent Living & Memory Care · Waterford Twp, MI
CMS overall rating Info CMS (the Centers for Medicare & Medicaid Services) is the federal agency that rates nursing home quality. Its Overall Rating runs from 1 to 5 stars, combining health inspections, staffing, and quality measures, with inspections weighted most heavily.

Lourdes Senior Community

Nursing Home, Assisted Living, Hospice Care, Independent Living & Memory Care · Waterford Twp, MI
CMS overall rating Info CMS (the Centers for Medicare & Medicaid Services) is the federal agency that rates nursing home quality. Its Overall Rating runs from 1 to 5 stars, combining health inspections, staffing, and quality measures, with inspections weighted most heavily.
Calculator: See prices in your area
Lourdes Senior Community accepts Medicare, Medicaid, and private pay.

Overview of Lourdes Senior Community

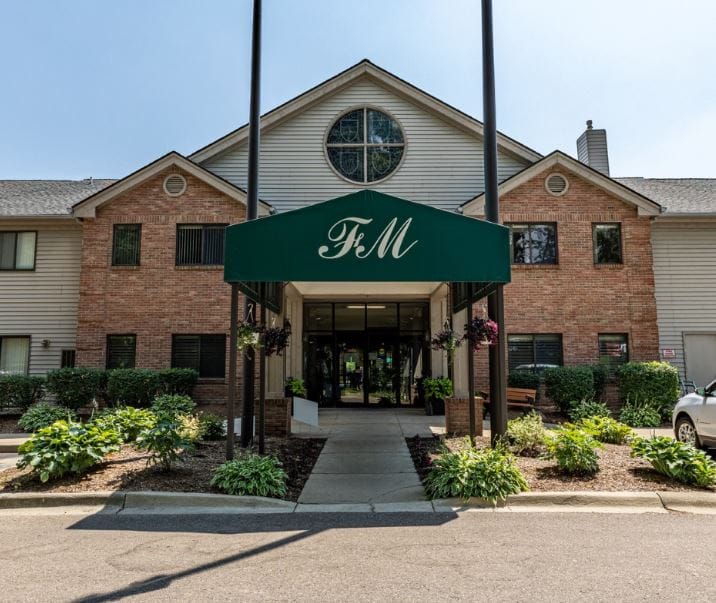
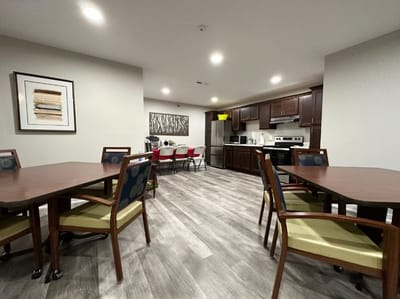
Tucked away in Oakland County, Waterford, Michigan, Lourdes Senior Community is an exceptional senior living community that offers independent living, assisted living, memory care, rehab care, and long-term care. Here, residents get the independence they want and the support they need with the help of a compassionate team, available any time of the day to address their needs. The community commits itself to making residents’ lives much easier with housekeeping and laundry, transportation services, and maintenance.

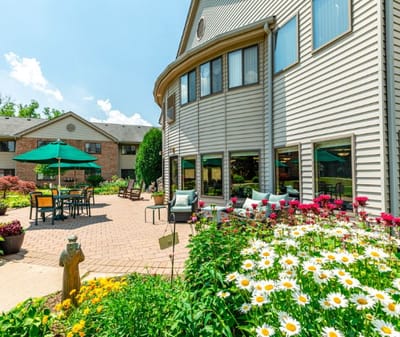
At Lourdes Senior Community, residents are provided with everything they need to stay active and engaged. From specialized programs and amenities to a broad range of activities, residents will never run out of things to do. Dining is an enjoyable experience with chef-prepared meals that cater to unique dietary needs or preferences. Regular safety and wellness checks and emergency call systems throughout the community provide residents the peace of mind that comes from knowing you are staying in a safe and secure environment.

Quality ratings

Measured by Centers for Medicare & Medicaid Services (CMS)

Overall rating Info The Overall CMS Rating combines results from health inspections, staffing levels and quality measures. Health inspections carry the most weight. Staffing and quality scores can increase or decrease the final rating based on performance compared to state and national standards.
Health Inspection Info Based on the results of the facility's three most recent standard inspections and any complaint investigations. CMS reviews the number, scope, and severity of deficiencies, with more recent findings weighted more heavily.
Staffing Info Measures average nursing staff hours per resident per day, including Registered Nurses (RNs) and total nursing staff. Ratings are adjusted based on the level of care residents require and are compared to state and national benchmarks.
Quality Measures Info Based on clinical and physical health indicators reported to CMS, such as hospital readmissions, falls, pressure ulcers, and improvements in mobility. These measures reflect how well residents' health needs are being managed.

Staffing hours breakdown

Info Daily nursing hours per resident by staff type, reported to CMS. Higher is generally better — compare this facility to state and national averages to see where staffing stands.

Hours per resident per day — compared to state averages

Total nursing care / resident Info Total adjusted nursing hours per resident per day, combining RN, LPN, and aide time. CMS adjusts this for case-mix so facilities can be fairly compared.
4h 4m per day
Rank #60 / 142Nurse hours — State benchmarkedThis home is ranked 60th out of 142 homes in Michigan. Shows adjusted nurse hours per resident per day benchmarked to the Michigan average, with a ranking across 142 Michigan facilities. More hours mean more direct care. The national average is about 3.5 hrs; below 3.0 is a red flag.Rankings are based only on facilities in Michigan that report data for that category. Facilities without available data are excluded from the ranking.Click the rank badge to see the full State ranking.Click here to see the full State ranking.
vs avg
Staff typeHours / Day / Residentvs state avg
Registered Nurse (RN) Info RNs hold the highest nursing license and can assess residents, interpret test results, and direct care plans. More RN hours per day often signals stronger clinical oversight and faster response to health changes. 44m per day
LPN / LVN Info Licensed Practical Nurses (LPNs) or Licensed Vocational Nurses (LVNs) deliver routine hands-on care — medication administration, wound dressing, and monitoring vital signs. They work under RN supervision and make up a large share of daily bedside care. 1h 10m per day
Nurse Aide Info Certified Nurse Aides (CNAs) provide the most direct day-to-day assistance: bathing, dressing, feeding, and mobility. Nurse aide hours are typically the largest staffing category and directly affect residents' quality of life. 2h 5m per day
Weekend Total Nursing Info Combined nursing hours (RN + LPN + Nurse Aide) per resident per day on weekends. Staffing often drops on weekends — this figure reveals whether the facility maintains adequate coverage outside of weekday hours. 3h 35m per day
Physical Therapist Info Hours per resident per day provided by licensed Physical Therapists (PTs) or PT Assistants. PT services help residents recover mobility after injury or illness and are especially important for post-acute (short-stay) rehabilitation. 8m per day
Weekend RN Info Registered nurse hours specifically on weekends. Facilities sometimes reduce RN presence on Saturdays and Sundays — a low weekend RN figure compared to weekday hours can indicate reduced clinical oversight when most administrative staff are absent. 37m per day

Capacity and availability

This home usually has availability

Lower occupancy than the state average
Occupancy rate
69.2% Rank #128 / 395Occupancy rate — State benchmarkedThis home is ranked 128th out of 395 homes in Michigan. Shows this facility's occupancy rate versus the Michigan average, with its Statewide rank out of 395. Higher occupancy signals strong local demand and financial stability.Rankings are based only on facilities in Michigan that report data for that category. Facilities without available data are excluded from the ranking.Click the rank badge to see the full State ranking.Click here to see the full State ranking.
Avg. Length of Stay
63 days
Bed community size
80-bed community Rank #181 / 435Bed count — State benchmarkedThis home is ranked 181st out of 435 homes in Michigan. Shows this facility's certified or reported bed count compared to other Michigan facilities. Larger communities may offer more amenities, programs, and on-site services for residents and families.Rankings are based only on facilities in Michigan that report data for that category. Facilities without available data are excluded from the ranking.Click the rank badge to see the full State ranking.Click here to see the full State ranking.
A larger shared setting that may offer more common spaces and organized community services.
Walk Score
Walk Score: 8 / 100 Rank #621 / 703Walk Score — State benchmarkedThis home is ranked 621st out of 703 homes in Michigan. Shows how walkable this facility's neighborhood is compared to the average Walk Score across Michigan facilities. Higher scores benefit residents, families, and staff.Rankings are based only on facilities in Michigan that report data for that category. Facilities without available data are excluded from the ranking.Click the rank badge to see the full State ranking.Click here to see the full State ranking.
Car-dependent. Most errands require a car, with limited nearby walkable options.

Contact Lourdes Senior Community

Staffing Data

Reporting period: October 1 – December 31, 2025 (Q4 2025). Source: CMS Payroll-Based Journal report.

Total staff 114
Employees 93
Contractors 21
Staff to resident ratio 1.84 : 1
0% compared with State average

State average ratio: 0 : 0

Avg staff/day 47
Average shift 7.6 hours
0% compared with State average

State average: 0 hours

Total staff hours (quarter) 33,028

Nursing staff breakdown

Q4 2025 · Oct 1 – Dec 31 More info This data comes from the CMS Payroll-Based Journal report covering October 1 – December 31, 2025.
Registered Nurse

Manages medical care and health needs.

RN Staff Info All 16 RN Staff are full-time employees. No contractors work on this role. 16
Average shift length Info Average shift length. Calculated as total hours divided by days worked and average staff per day. 9.9 hours
Licensed Practical Nurse

Assists with medical care and medications.

LPN Staff Info All 22 LPN Staff are full-time employees. No contractors work on this role. 22
Average shift length Info Average shift length. Calculated as total hours divided by days worked and average staff per day. 8.3 hours
Certified Nursing Assistant

Helps with daily care and mobility.

CNA Staff Info All 37 CNA Staff are full-time employees. No contractors work on this role. 37
Average shift length Info Average shift length. Calculated as total hours divided by days worked and average staff per day. 7.7 hours

Contractor staffing

Q4 2025 · Oct 1 – Dec 31 More info This data comes from the CMS Payroll-Based Journal report covering October 1 – December 31, 2025.

Total hours from contractors

12.5%

4,132 contractor hours this quarter

Physical Therapy Assistant: 5 Speech Language Pathologist: 4 Respiratory Therapy Technician: 4 Qualified Social Worker: 3 Physical Therapy Aide: 2 Clinical Nurse Specialist: 1 Occupational Therapy Assistant: 1 Medical Director: 1

Staff by category

Q4 2025 · Oct 1 – Dec 31 More info This data comes from the CMS Payroll-Based Journal report covering October 1 – December 31, 2025.
Certified Nursing Assistant3703713,50392100%7.7
Licensed Practical Nurse220226,18592100%8.3
Registered Nurse160163,71192100%9.9
Other Dietary Services Staff6061,3838896%5.3
RN Director of Nursing3031,3306470%7.9
Speech Language Pathologist0449787480%6.9
Respiratory Therapy Technician0449078592%6
Physical Therapy Assistant0558788087%6.1
Mental Health Service Worker2026856368%7.9
Physical Therapy Aide0225877683%6
Clinical Nurse Specialist1125286166%8
Occupational Therapy Aide1015046368%8
Nurse Practitioner3034966065%8
Administrator1014495964%7.6
Dietitian1014445863%7.6
Qualified Social Worker0334286571%6.6
Occupational Therapy Assistant011241213%2
Medical Director0111178%1.6
37 Certified Nursing Assistant
% of Days 100%
22 Licensed Practical Nurse
% of Days 100%
16 Registered Nurse
% of Days 100%
6 Other Dietary Services Staff
% of Days 96%
3 RN Director of Nursing
% of Days 70%
4 Speech Language Pathologist
% of Days 80%
4 Respiratory Therapy Technician
% of Days 92%
5 Physical Therapy Assistant
% of Days 87%
2 Mental Health Service Worker
% of Days 68%
2 Physical Therapy Aide
% of Days 83%
2 Clinical Nurse Specialist
% of Days 66%
1 Occupational Therapy Aide
% of Days 68%
3 Nurse Practitioner
% of Days 65%
1 Administrator
% of Days 64%
1 Dietitian
% of Days 63%
3 Qualified Social Worker
% of Days 71%
1 Occupational Therapy Assistant
% of Days 13%
1 Medical Director
% of Days 8%

Penalties and fines

Includes penalties issued in 2023

Federal penalties imposed by CMS for regulatory violations, including civil money penalties (fines) and denials of payment for new Medicare/Medicaid admissions.

Source: CMS Penalties Database (Data as of Jan 2026)

Total fines amount $16K Rank #90 / 145Federal fines — State benchmarkedThis home is ranked 90th out of 145 homes in Michigan. Shows this facility's cumulative CMS federal fine dollars versus the Michigan average among facilities with fines, and where it ranks among 145 facilities in the pool. Lower total dollars mean a better rank.Rankings are based only on facilities in Michigan that report data for that category. Facilities without available data are excluded from the ranking.Click the rank badge to see the full State ranking.Click here to see the full State ranking.
80% lower than State average

State average: $76K

Number of fines 1
51% fewer fines than State average

State average: 2.0

Payment Denials Info Serious action where Medicare and/or Medicaid temporarily stops payments for new residents until issues are fixed. 0
100% fewer payment denials than State average

State average: 0.8

Fines amount comparison
This facility $16K
State average $76K
Penalty History

Penalties are imposed by CMS for violations of federal nursing home regulations.

1 penalty in the past 3 years

Aug 24, 2023 · $16K

Civil Money Penalty Info Fines imposed for noncompliance, which can be assessed per day or per instance of violation. Aug 24, 2023
$16K

Last updated: Jan 2026

Quality of care over time

These measures show how residents usually do over time at this home, based on health outcomes and preventive care.

High-risk clinical events score Info A composite score based on pressure ulcers, falls with injury, weight loss, walking ability decline, and activities of daily living decline. 10.4
24% worse than State average

State average: 8.4

Functional decline score Info A composite score based on activities of daily living decline, walking ability decline, and incontinence. 25.0
53% worse than State average

State average: 16.3

Long-stay resident measures
Need for Help with Daily Activities Increased Info Percent of long-stay residents whose need for help with daily activities has increased 11.2%
10% better than State average

State average: 12.5%

Walking Ability Worsened Info Percent of long-stay residents whose ability to move independently worsened 31.0%
102% worse than State average

State average: 15.3%

Low Risk Residents with Bowel/Bladder Incontinence Info Percent of low risk long-stay residents who lose control of their bowels or bladder 32.7%
55% worse than State average

State average: 21.0%

Falls with Major Injury Info Percent of long-stay residents experiencing one or more falls with major injury 2.7%
14% better than State average

State average: 3.2%

High Risk Residents with Pressure Ulcers Info Percent of long-stay high risk residents with pressure ulcers 3.4%
41% better than State average

State average: 5.7%

Urinary Tract Infection Info Percent of long-stay residents with a urinary tract infection 0.0%
100% better than State average

State average: 1.7%

Lost Too Much Weight Info Percent of long-stay residents who lose too much weight 3.9%
32% better than State average

State average: 5.7%

Depressive Symptoms Info Percent of long-stay residents who have depressive symptoms 0.0%
100% better than State average

State average: 3.9%

Antipsychotic Use Info Percent of long-stay residents who received an antipsychotic medication 2.3%
85% better than State average

State average: 15.0%

Pneumococcal Vaccine Info Percent of long-stay residents assessed and appropriately given the pneumococcal vaccine 99.5%
5% better than State average

State average: 94.9%

Influenza Vaccine Info Percent of long-stay residents assessed and appropriately given the seasonal influenza vaccine 100.0%
5% better than State average

State average: 95.0%

Short-stay resident measures
Pneumococcal Vaccine Info Percent of short-stay residents assessed and appropriately given the pneumococcal vaccine 93.5%
13% better than State average

State average: 82.5%

Antipsychotic medication increase Info Percent of short-stay residents who newly received an antipsychotic medication 0.7%
55% better than State average

State average: 1.4%

Influenza Vaccine Info Percent of short-stay residents assessed and appropriately given the seasonal influenza vaccine 89.5%
13% better than State average

State average: 79.5%

Breakdown by payment type

Medicare

34% of new residents, usually for short-term rehab.

Typical stay 23 days

Private pay

64% of new residents, often for short stays.

Typical stay 28 days

Medicaid

2% of new residents, often for long-term daily care.

Typical stay 4 - 5 years

Facility Characteristics

Source: CMS Long-Term Care Facility Characteristics (Data as of Jan 2026)

Total residents 62
Medicare
23
37.1% of residents
Medicaid
32
51.6% of residents
Private pay or other
7
11.3% of residents
Programs & Services
Residents Group

Residents meet regularly to discuss policies, care quality, and activities

CCRC

Part of a Continuing Care Retirement Community offering multiple care levels

Active Resident Council

Organized group of residents that meets regularly to discuss facility policies, quality of life, and activities.

Finances and operations

Based on CMS SNF Cost Report for fiscal year ending in 12/2023.

Nonprofit
Church Related
Net patient revenue Info Net patient revenue — what the home actually collects for resident care, after contractual allowances, bad debt and discounts are subtracted from its gross charges (CMS cost report, Worksheet G-3). It covers resident care only; money the home earns from other sources is shown separately as "Other income."
$10.9M
Net patient income Info Net patient income: net patient revenue minus the home's total operating expenses. A positive figure means it earns more from resident care than it spends to deliver it; a negative figure means the opposite. It excludes non-operating "other income."
-$155.5K
Nonprofit Church Related
Net patient revenue Info Net patient revenue — what the home actually collects for resident care, after contractual allowances, bad debt and discounts are subtracted from its gross charges (CMS cost report, Worksheet G-3). It covers resident care only; money the home earns from other sources is shown separately as "Other income."
$10.9M Rank #72 / 143Revenue — State benchmarkedThis home is ranked 72nd out of 143 homes in Michigan. Shows this facility's annual revenue compared to the Michigan average. Higher revenue generally means more resources for staffing and capital — read alongside Payroll %.Rankings are based only on facilities in Michigan that report data for that category. Facilities without available data are excluded from the ranking.Click the rank badge to see the full State ranking.Click here to see the full State ranking.
Net patient income Info Net patient income: net patient revenue minus the home's total operating expenses. A positive figure means it earns more from resident care than it spends to deliver it; a negative figure means the opposite. It excludes non-operating "other income."
-$155.5K
Other income Info Money the home earns outside of resident care — such as investments, grants, rentals and other non-operating sources (CMS cost report, Worksheet G-3). It is tracked separately from net patient revenue: it is not part of that figure, and it is not included in net patient income.
$583.4K
Payroll costs Info Staff salaries plus wage-related costs — benefits such as payroll taxes, health insurance and retirement — from the home's own accounting records (CMS cost report, Worksheet A). Contract or agency labor is counted separately, under other operating costs. Rank #82 / 143Payroll — State benchmarkedThis home is ranked 82nd out of 143 homes in Michigan. Shows total annual staff payroll benchmarked to the Michigan average. Higher payroll investment relative to peers often signals better staffing and less reliance on cheaper contract labor.Rankings are based only on facilities in Michigan that report data for that category. Facilities without available data are excluded from the ranking.Click the rank badge to see the full State ranking.Click here to see the full State ranking.
$5.6M 51.7% of net patient revenue Info Payroll as a share of revenue: staff salaries and wage-related benefits divided by net patient revenue. A higher figure means more of each revenue dollar goes to staff pay. Rank #87 / 143Payroll % — State benchmarkedThis home is ranked 87th out of 143 homes in Michigan. Shows payroll as a percentage of revenue versus the Michigan average. Well-run Michigan facilities typically land around 49–59% — the top third Statewide. Below 25% may signal understaffing or heavy agency use — read with Staffing ratings.Rankings are based only on facilities in Michigan that report data for that category. Facilities without available data are excluded from the ranking.Click the rank badge to see the full State ranking.Click here to see the full State ranking.
Other operating costs Info Everything it costs to run the home apart from payroll — food, utilities, supplies, maintenance, contract labor and administration. Calculated as total operating expense minus payroll (staff salaries and wage-related benefits).
$5.4M
Total costs Info The home's total operating expense for the year — all the costs of running it, salaries included (CMS cost report, Worksheet G-3).
$11.0M

What does this home offer?

Housing options icon

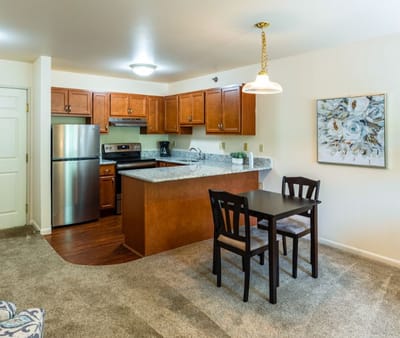
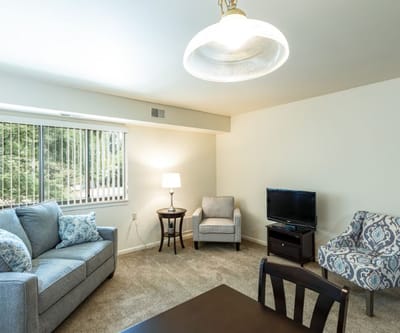
Housing Options: Studio / 1 Bed / 2 Bed

Building type icon
Building type icon

Building Type: 2-story

Transportation services icon

Transportation Services

Fitness and recreation icon

Fitness and Recreation

Who this home usually serves

TYPE OF STAY

Primarily short stays

Residents typically stay for brief periods, with frequent admissions and discharges throughout the year.

Most new residents arrive under private pay (64% of admissions), and a typical private pay stay runs around 28 days.

Admissions
426 total

Coverage residents most often arrive under.

Medicare 34%
Private pay 64%
Medicaid 2%
Discharges
398 total

Coverage residents most often leave under.

Medicare 31%
Private pay 63%
Medicaid 6%

Managed by Jason Mize

Administrator of Lourdes Rehabilitation and Healthcare Center

Places of interest near Lourdes Senior Community

Address 1.7 miles from city center Info Estimated distance in miles from Waterford Twp's city center to Lourdes Senior Community's address, calculated via Google Maps.

Calculate Travel Distance to Lourdes Senior Community

Add your location

Address

Compare Nursing Homes around the area

The information below is reported by the Michigan Department of Licensing and Regulatory Affairs (LARA).

Lourdes Senior Community
NH
AL
HC
IL
MC
Waterford Twp (Watkins-Pontiac Estates) -80 - 8 Studio / 1 Bed / 2 Bed
Iron County Medical Care Facility
NH
AL
MC
Crystal Falls (Us 2) -200 A+ 11 Private Rooms
Majestic Care of Flushing Assisted Living
NH
AL
Flushing -40 A+ 5 Studio
Canterbury-on-the-Lake
NH
AL
HC
IL
MC
NC
Waterford Twp (Waterford Township) -128 A+ 22 Studio / 1 Bed / 2 Bed
Chelsea Retirement Community
NH
AL
IL
MC
Chelsea -172 - 13 Studio / 1 Bed / 2 Bed / Cottage

Frequently Asked Questions about Lourdes Senior Community

What neighborhood is Lourdes Senior Community in?

Lourdes Senior Community is in the Watkins-Pontiac Estates neighborhood.

Is Lourdes Senior Community in a walkable area?

Lourdes Senior Community has a walk score of 8. Car-dependent. Most errands require a car, with limited nearby walkable options.

What is the occupancy rate at Lourdes Senior Community?

Lourdes Senior Community's occupancy is 69.2%.

Does Lourdes Senior Community operate as a for-profit or non-profit?

Lourdes Senior Community is registered as a non-profit.

Are there photos of Lourdes Senior Community?

Yes — there are 5 photos of Lourdes Senior Community in the photo gallery on this page.

What is the address of Lourdes Senior Community?

Lourdes Senior Community is located at 2300 Watkins Lake Rd, Waterford Twp, MI 48328.

What is the phone number of Lourdes Senior Community?

(248) 963-7189 will put you in contact with the team at Lourdes Senior Community.

Guides for Better Senior Living

Care Cost Calculator: See Prices in Your Area

Nursing Home Data Explorer

Don’t Wait Too Long: 7 Red Flag Signs Your Parent Needs Assisted Living Now

The True Cost of Assisted Living in 2025 – And How Families Are Paying For It

Understanding Senior Living Costs: Pricing Models, Discounts & Financial Assistance