Moran Manor
Nursing Home & Hospice Care · Chanute, KS
CMS overall rating Info CMS (the Centers for Medicare & Medicaid Services) is the federal agency that rates nursing home quality. Its Overall Rating runs from 1 to 5 stars, combining health inspections, staffing, and quality measures, with inspections weighted most heavily.

Moran Manor

Nursing Home & Hospice Care · Chanute, KS
CMS overall rating Info CMS (the Centers for Medicare & Medicaid Services) is the federal agency that rates nursing home quality. Its Overall Rating runs from 1 to 5 stars, combining health inspections, staffing, and quality measures, with inspections weighted most heavily.
Calculator: See prices in your area
Moran Manor accepts Medicare, Medicaid, and private pay.

Overview of Moran Manor

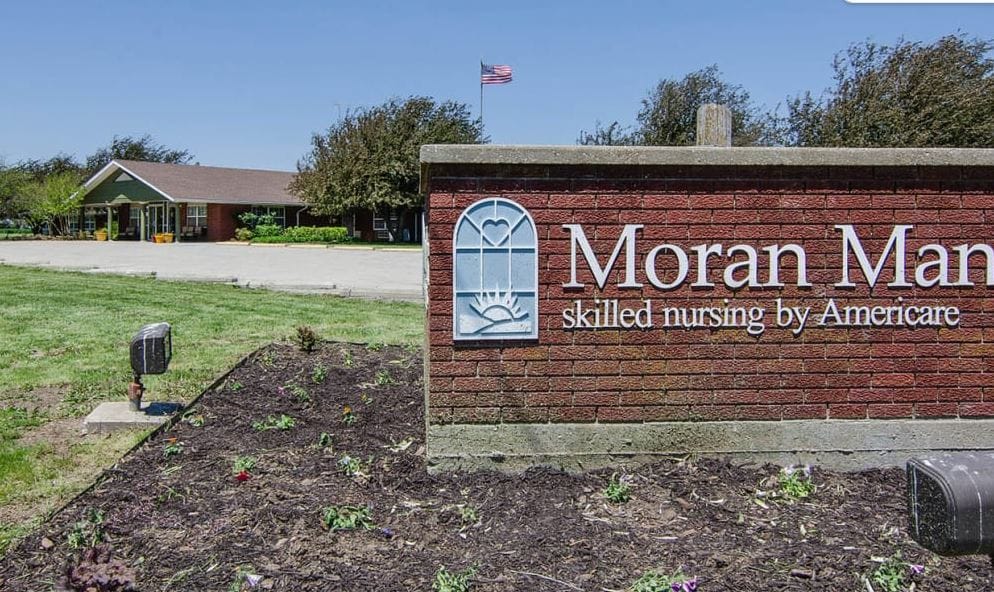
Ideally placed in the countryside setting of the U.S. Highway 54, Moran, KS, is the idyllic senior living community of Moran Manor Skilled Nursing by Americare that provides skilled nursing, hospice, adult day club, home health care, and rehabilitation. Featuring snug and purposely built residences in various studio floor plans, the community ensures seniors experience unparalleled comfort and security. Dedicated to improving seniors’ quality of life, Moran Manor delivers top-tier care and assistance that cater to their special needs and preferences.

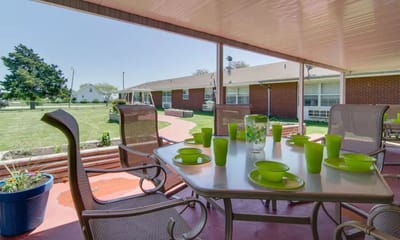
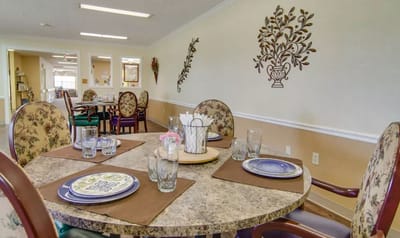
Live the lifestyle of your dreams with the community providing the utmost support in wellness and happiness through exciting activities and fun fitness classes. Have a delightful dining experience with delightful and healthy meals that cater to dietary requirements and preferences. Moran Manor is a haven for seniors looking to enjoy every moment of their best years without worries.

(620) 237-4309

Quality ratings

Measured by Centers for Medicare & Medicaid Services (CMS)

Overall rating Info The Overall CMS Rating combines results from health inspections, staffing levels and quality measures. Health inspections carry the most weight. Staffing and quality scores can increase or decrease the final rating based on performance compared to state and national standards.
▼ 30.8% Below KS avg. ▼ 30.8% Below KS avg.KS average: 2.9Click the badge to see the full State ranking.Click here to see the full State ranking.
Health Inspection Info Based on the results of the facility's three most recent standard inspections and any complaint investigations. CMS reviews the number, scope, and severity of deficiencies, with more recent findings weighted more heavily.
▲ 8.6% Above KS avg. ▲ 8.6% Above KS avg.KS average: 2.8Click the badge to see the full State ranking.Click here to see the full State ranking.
Staffing Info Measures average nursing staff hours per resident per day, including Registered Nurses (RNs) and total nursing staff. Ratings are adjusted based on the level of care residents require and are compared to state and national benchmarks.
▲ 15.7% Above KS avg. ▲ 15.7% Above KS avg.KS average: 3.5Click the badge to see the full State ranking.Click here to see the full State ranking.
Quality Measures Info Based on clinical and physical health indicators reported to CMS, such as hospital readmissions, falls, pressure ulcers, and improvements in mobility. These measures reflect how well residents' health needs are being managed.
▼ 67.7% Below KS avg. ▼ 67.7% Below KS avg.KS average: 3.1Click the badge to see the full State ranking.Click here to see the full State ranking.

Staffing hours breakdown

Info Daily nursing hours per resident by staff type, reported to CMS. Higher is generally better — compare this facility to state and national averages to see where staffing stands.

Hours per resident per day — compared to Kansas state averages

Total nursing care / resident Info Total adjusted nursing hours per resident per day, combining RN, LPN, and aide time. CMS adjusts this for case-mix so facilities can be fairly compared.
4h 16m per day
This facility Kansas avg (4h 38m per day)
vs Kansas avg
-8%

5 of 6 metrics below state avg

Standout metric Registered Nurse (RN) is +7% above state avg
Staff typeHours / Day / Residentvs state avg
Registered Nurse (RN) Info RNs hold the highest nursing license and can assess residents, interpret test results, and direct care plans. More RN hours per day often signals stronger clinical oversight and faster response to health changes. 46m per day ▲ 7% State avg: 43m per day · National avg: 41m per day
LPN / LVN Info Licensed Practical Nurses (LPNs) or Licensed Vocational Nurses (LVNs) deliver routine hands-on care — medication administration, wound dressing, and monitoring vital signs. They work under RN supervision and make up a large share of daily bedside care. 20m per day ▼ 51% State avg: 40m per day · National avg: 52m per day
Nurse Aide Info Certified Nurse Aides (CNAs) provide the most direct day-to-day assistance: bathing, dressing, feeding, and mobility. Nurse aide hours are typically the largest staffing category and directly affect residents' quality of life. 2h 10m per day ▼ 20% State avg: 2h 42m per day · National avg: 2h 21m per day
Weekend Total Nursing Info Combined nursing hours (RN + LPN + Nurse Aide) per resident per day on weekends. Staffing often drops on weekends — this figure reveals whether the facility maintains adequate coverage outside of weekday hours. 2h 42m per day ▼ 24% State avg: 3h 35m per day · National avg: 3h 26m per day
Physical Therapist Info Hours per resident per day provided by licensed Physical Therapists (PTs) or PT Assistants. PT services help residents recover mobility after injury or illness and are especially important for post-acute (short-stay) rehabilitation. 0m per day ▼ 80% State avg: 2m per day · National avg: 4m per day
Weekend RN Info Registered nurse hours specifically on weekends. Facilities sometimes reduce RN presence on Saturdays and Sundays — a low weekend RN figure compared to weekday hours can indicate reduced clinical oversight when most administrative staff are absent. 26m per day ▼ 11% State avg: 29m per day · National avg: 29m per day

Capacity and availability

This home usually has availability

Lower occupancy than the Kansas average: 79.5%
Occupancy rate
66.7%
Avg. Length of Stay
173 days
Bed community size
45-bed community Rank #152 / 224Bed count — State benchmarkedThis home is ranked 152nd out of 224 homes in Kansas. Shows this facility's certified or reported bed count compared to other Kansas facilities. Larger communities may offer more amenities, programs, and on-site services for residents and families.Rankings are based only on facilities in Kansas that report data for that category. Facilities without available data are excluded from the ranking.Click the rank badge to see the full State ranking.Click here to see the full State ranking.
A moderately sized community that may balance personal attention with shared amenities and social activities.
Walk Score
Walk Score: 21 / 100 Rank #305 / 363Walk Score — State benchmarkedThis home is ranked 305th out of 363 homes in Kansas. Shows how walkable this facility's neighborhood is compared to the average Walk Score across Kansas facilities. Higher scores benefit residents, families, and staff.Rankings are based only on facilities in Kansas that report data for that category. Facilities without available data are excluded from the ranking.Click the rank badge to see the full State ranking.Click here to see the full State ranking.
Car-dependent. Most errands require a car, with limited nearby walkable options.

Contact Moran Manor

Staffing Data

Reporting period: October 1 – December 31, 2025 (Q4 2025). Source: CMS Payroll-Based Journal report.

Total staff 73
Employees 53
Contractors 20
Staff to resident ratio 2.03 : 1
10% fewer staff per resident than Kansas average
Kansas average ratio: 2.24 : 1 Kansas average ratio: 2.24 : 1See full Kansas ranking
Avg staff/day 21
Average shift 7.1 hours
8% worse than Kansas average
Kansas average: 7.7 hours Kansas average shift: 7.7 hoursSee full Kansas ranking
Total staff hours (quarter) 13,798

Nursing staff breakdown

Q4 2025 · Oct 1 – Dec 31 More info This data comes from the CMS Payroll-Based Journal report covering October 1 – December 31, 2025.
Registered Nurse

Manages medical care and health needs.

RN Staff Info All 7 RN Staff are full-time employees. No contractors work on this role. 7
Average shift length Info Average shift length. Calculated as total hours divided by days worked and average staff per day. 8.4 hours
Licensed Practical Nurse

Assists with medical care and medications.

LPN Staff Info All 3 LPN Staff are full-time employees. No contractors work on this role. 3
Average shift length Info Average shift length. Calculated as total hours divided by days worked and average staff per day. 9.3 hours
Certified Nursing Assistant

Helps with daily care and mobility.

CNA Staff Info All 32 CNA Staff are full-time employees. No contractors work on this role. 32
Average shift length Info Average shift length. Calculated as total hours divided by days worked and average staff per day. 7.1 hours

Contractor staffing

Q4 2025 · Oct 1 – Dec 31 More info This data comes from the CMS Payroll-Based Journal report covering October 1 – December 31, 2025.

Total hours from contractors

7.3%

1,010 contractor hours this quarter

Respiratory Therapy Technician: 5 Speech Language Pathologist: 4 Physical Therapy Aide: 3 Occupational Therapy Aide: 3 Physical Therapy Assistant: 2 Occupational Therapy Assistant: 1 Qualified Social Worker: 1 Therapeutic Recreation Specialist: 1

Staff by category

Q4 2025 · Oct 1 – Dec 31 More info This data comes from the CMS Payroll-Based Journal report covering October 1 – December 31, 2025.
Certified Nursing Assistant320326,70892100%7.1
Registered Nurse7071,91692100%8.4
Licensed Practical Nurse3031,1568188%9.3
Medication Aide/Technician6069058390%8
Administrator1015046368%8
Dental Services Staff1014565964%7.7
Nurse Practitioner1014426166%7.3
Speech Language Pathologist0444226672%6
Dietitian1013645459%6.7
Physical Therapy Aide0333586773%4.9
Clinical Nurse Specialist1013375155%6.6
Qualified Social Worker0111263942%3.2
Therapeutic Recreation Specialist0113555%7
Respiratory Therapy Technician055243437%0.7
Occupational Therapy Assistant0111633%5.4
Occupational Therapy Aide033152224%0.7
Physical Therapy Assistant022142527%0.6
32 Certified Nursing Assistant
% of Days 100%
7 Registered Nurse
% of Days 100%
3 Licensed Practical Nurse
% of Days 88%
6 Medication Aide/Technician
% of Days 90%
1 Administrator
% of Days 68%
1 Dental Services Staff
% of Days 64%
1 Nurse Practitioner
% of Days 66%
4 Speech Language Pathologist
% of Days 72%
1 Dietitian
% of Days 59%
3 Physical Therapy Aide
% of Days 73%
1 Clinical Nurse Specialist
% of Days 55%
1 Qualified Social Worker
% of Days 42%
1 Therapeutic Recreation Specialist
% of Days 5%
5 Respiratory Therapy Technician
% of Days 37%
1 Occupational Therapy Assistant
% of Days 3%
3 Occupational Therapy Aide
% of Days 24%
2 Physical Therapy Assistant
% of Days 27%

Penalties and fines

Federal penalties imposed by CMS for regulatory violations, including civil money penalties (fines) and denials of payment for new Medicare/Medicaid admissions.

Source: CMS Penalties Database

No penalties in the past 3 years

No civil money penalties or payment denials were reported in the last 3 years.

Quality of care over time

These measures show how residents usually do over time at this home, based on health outcomes and preventive care.

High-risk clinical events score Info A composite score based on pressure ulcers, falls with injury, weight loss, walking ability decline, and activities of daily living decline. 10.6
In line with Kansas average

Kansas average: 10.5

Functional decline score Info A composite score based on activities of daily living decline, walking ability decline, and incontinence. 22.0
6% worse than Kansas average

Kansas average: 20.7

Long-stay resident measures
Below average Kansas avg: 3.0 Info CMS star rating based on long-stay quality measure performance. 5 stars = significantly above average, 1 star = significantly below average.
Need for Help with Daily Activities Increased Info Percent of long-stay residents whose need for help with daily activities has increased 15.7%
17% better than Kansas average

Kansas average: 19.0%

Walking Ability Worsened Info Percent of long-stay residents whose ability to move independently worsened 20.9%
8% worse than Kansas average

Kansas average: 19.4%

Low Risk Residents with Bowel/Bladder Incontinence Info Percent of low risk long-stay residents who lose control of their bowels or bladder 29.2%
23% worse than Kansas average

Kansas average: 23.8%

Falls with Major Injury Info Percent of long-stay residents experiencing one or more falls with major injury 4.6%
5% worse than Kansas average

Kansas average: 4.4%

High Risk Residents with Pressure Ulcers Info Percent of long-stay high risk residents with pressure ulcers 4.8%
In line with Kansas average

Kansas average: 4.6%

Urinary Tract Infection Info Percent of long-stay residents with a urinary tract infection 3.3%
In line with Kansas average

Kansas average: 3.1%

Lost Too Much Weight Info Percent of long-stay residents who lose too much weight 6.8%
34% worse than Kansas average

Kansas average: 5.1%

Depressive Symptoms Info Percent of long-stay residents who have depressive symptoms 9.8%
89% worse than Kansas average

Kansas average: 5.2%

Antipsychotic Use Info Percent of long-stay residents who received an antipsychotic medication 26.2%
55% worse than Kansas average

Kansas average: 16.9%

Pneumococcal Vaccine Info Percent of long-stay residents assessed and appropriately given the pneumococcal vaccine 98.5%
7% better than Kansas average

Kansas average: 91.9%

Influenza Vaccine Info Percent of long-stay residents assessed and appropriately given the seasonal influenza vaccine 87.9%
8% worse than Kansas average

Kansas average: 95.5%

Hospitalizations per 1,000 days Info Number of hospitalizations per 1,000 long-stay resident days. 1.93
5% worse than Kansas average

Kansas average: 1.84

ED visits per 1,000 days Info Number of outpatient emergency department visits per 1,000 long-stay resident days. 5.20
141% worse than Kansas average

Kansas average: 2.16

Short-stay resident measures
Below average Kansas avg: 2.6 Info CMS star rating based on short-stay quality measure performance. 5 stars = much above average, 1 star = much below average.
Pneumococcal Vaccine Info Percent of short-stay residents assessed and appropriately given the pneumococcal vaccine 62.2%
18% worse than Kansas average

Kansas average: 75.6%

Antipsychotic medication increase Info Percent of short-stay residents who newly received an antipsychotic medication 0.0%
100% better than Kansas average

Kansas average: 2.2%

Influenza Vaccine Info Percent of short-stay residents assessed and appropriately given the seasonal influenza vaccine 61.9%
16% worse than Kansas average

Kansas average: 73.5%

Re-hospitalized after SNF stay Info Percentage of short-stay residents who were re-hospitalized after their nursing home admission. 24.5%
7% worse than Kansas average

Kansas average: 23.0%

Emergency department visits Info Percentage of short-stay residents who had an outpatient emergency department visit. 14.9%
27% worse than Kansas average

Kansas average: 11.7%

Falls with major injury Info Percentage of SNF residents who experience falls with major injury during their stay. 2.8%
261% worse than Kansas average

Kansas average: 0.8%

Ability to care for self at discharge Info Percentage of residents at or above expected ability to care for themselves at discharge. 27.3%
49% worse than Kansas average

Kansas average: 53.7%

Successful return to home or community Info Rate of successful return to home or community from a skilled nursing facility. 51.9%
In line with Kansas average

Kansas average: 50.6%

Breakdown by payment type

Medicare

35% of new residents, usually for short-term rehab.

Typical stay 1 - 2 months

Private pay

46% of new residents, often for short stays.

Typical stay 3 - 4 months

Medicaid

19% of new residents, often for long-term daily care.

Typical stay 2 years

Facility Characteristics

Source: CMS Long-Term Care Facility Characteristics (Data as of Jan 2026)

Total residents 36
Medicare
6
16.7% of residents
Medicaid
20
55.6% of residents
Private pay or other
10
27.8% of residents
Programs & Services
Residents Group

Residents meet regularly to discuss policies, care quality, and activities

Active Resident Council

Organized group of residents that meets regularly to discuss facility policies, quality of life, and activities.

Finances and operations

Based on CMS SNF Cost Report for fiscal year ending in 12/2023.

Voluntary non-profit community
Operated by a church.
Net patient revenue Info Net patient revenue — what the home actually collects for resident care, after contractual allowances, bad debt and discounts are subtracted from its gross charges (CMS cost report, Worksheet G-3). It covers resident care only; money the home earns from other sources is shown separately as "Other income."
$3.2M
Net patient income Info Net patient income: net patient revenue minus the home's total operating expenses. A positive figure means it earns more from resident care than it spends to deliver it; a negative figure means the opposite. It excludes non-operating "other income."
$502.8K
Voluntary non-profit community Operated by a church.
Net patient revenue Info Net patient revenue — what the home actually collects for resident care, after contractual allowances, bad debt and discounts are subtracted from its gross charges (CMS cost report, Worksheet G-3). It covers resident care only; money the home earns from other sources is shown separately as "Other income."
$3.2M
Net patient income Info Net patient income: net patient revenue minus the home's total operating expenses. A positive figure means it earns more from resident care than it spends to deliver it; a negative figure means the opposite. It excludes non-operating "other income."
$502.8K
Other income Info Money the home earns outside of resident care — such as investments, grants, rentals and other non-operating sources (CMS cost report, Worksheet G-3). It is tracked separately from net patient revenue: it is not part of that figure, and it is not included in net patient income.
$56.8K
Payroll costs Info Staff salaries plus wage-related costs — benefits such as payroll taxes, health insurance and retirement — from the home's own accounting records (CMS cost report, Worksheet A). Contract or agency labor is counted separately, under other operating costs.
$1.5M 45% of net patient revenue Info Payroll as a share of revenue: staff salaries and wage-related benefits divided by net patient revenue. A higher figure means more of each revenue dollar goes to staff pay.
Other operating costs Info Everything it costs to run the home apart from payroll — food, utilities, supplies, maintenance, contract labor and administration. Calculated as total operating expense minus payroll (staff salaries and wage-related benefits).
$1.3M
Total costs Info The home's total operating expense for the year — all the costs of running it, salaries included (CMS cost report, Worksheet G-3).
$2.7M

What does this home offer?

Pets allowed icon
Pets allowed icon

Pets Allowed

Room sizes icon
Room sizes icon

Room Sizes: 210 - 260 sq. ft.

Housing options icon

Housing Options: Studio

Building type icon
Building type icon

Building Type: Single-story

Transportation services icon

Transportation Services

Fitness and recreation icon

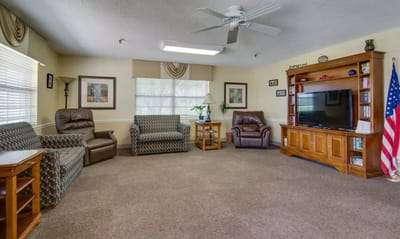
Fitness and Recreation

Who this home usually serves

TYPE OF STAY

Mix of rehab and long-term care

This home supports both short-term rehab and long-term care, with residents staying for a wide range of durations.

New residents most often arrive under private pay (46% of admissions), and a typical private pay stay runs around 3 - 4 months.

Admissions
63 total

Coverage residents most often arrive under.

Medicare 35%
Private pay 46%
Medicaid 19%
Discharges
69 total

Coverage residents most often leave under.

Medicare 28%
Private pay 45%
Medicaid 28%

Places of interest near Moran Manor

Address 29.6 miles from city center Info Estimated distance in miles from Moran's city center to Moran Manor's address, calculated via Google Maps.

Calculate Travel Distance to Moran Manor

Add your location

Address

Compare Nursing Homes around Chanute

The information below is reported by the Kansas Department for Aging and Disability Services.

2 facilities compared · CMS & KS Dept. of Health data

Moran Manor
NH
HC
Moran
45
Facility 45
KS AVG 69
Rank #152 / 224
66.7% -16%4.27 -6%-8%$14.1k265.2138-
21
Facility 21
KS AVG 46
Rank #305 / 363
R H Montgomery Properties, Inc$3.2M$1.5M45%175224
Heritage Health Care
NH
HC
Chanute (West 2Nd Street)
71
Facility 71
KS AVG 69
Rank #82 / 224
83.1% +5%4.08 -8%-12%$13.8k289.3156-
15
Facility 15
KS AVG 46
Rank #326 / 363
Timothy Summerhays$6.0M$2.8M46.3%175249

Financial Assistance for
Nursing Home in Kansas

Moran Manor is located in Moran, Kansas.
Here are the financial assistance programs available to residents in Kansas.

Get Financial aid guidance

Frail Elderly Waiver

Kansas Medicaid FE Waiver

Age 65+
General Kansas resident, Medicaid-eligible, nursing home- level care need.
Income Limits (2025) ~$2,829/month 300% FBR, individual
Asset Limits $2,000 (individual), $3,000 (couple).
KS

Requires care level assessment.

Benefits
Personal care (5-7 hours/day) Respite (240 hours/year) Adult day care (~$60/day) Home aides

Senior Care Act

Kansas SCA

Age 60+
General Kansas resident, at risk of nursing home.
Income Limits ~$1,800/month individual, varies
Asset Limits $2,000 individual
KS

Limited funding; waitlists common.

Benefits
In-home care (3-5 hours/week) Respite (up to 10 days/year) Homemaker services

Medicare Savings Program (MSP)

Kansas Medicare Savings Program

Age 65+ or disabled
General Kansas resident, Medicare Part A/B.
Income Limits (2025) ~$2,510/month (QMB), ~$3,380/month (SLMB), ~$3,598/month (QI)—individual.
Asset Limits $9,430 (individual), $14,130 (couple).
KS

Three tiers; no waitlist.

Benefits
Covers Part B premiums ($174.70/month) Deductibles ($240/year) Copays (~20%)

National Family Caregiver Support Program (NFCSP) Respite

Kansas NFCSP Respite Care

Age
General Caregivers of 60+ needing care or 55+ caregivers of others; Kansas resident; functional needs (2+ ADLs).
Income Limits (2025) Prioritizes ~$24,980/year (individual); no strict cap.
Asset Limits Not assessed; need-based.
KS

11 AAAs; prioritizes low-income, rural caregivers.

Benefits
Respite (4-6 hours/week or 5 days/year) Adult day care ($60/day) Caregiver training

VA Aid and Attendance (A&A) and Housebound Benefits

Kansas VA Aid and Attendance/Housebound

Age 65+ or disabled veteran/spouse
General Kansas resident, wartime service, need for ADL help (A&A) or homebound.
Income Limits (2025) Net income < ~$1,984/month (veteran with dependent, A&A); pension offsets income.
Asset Limits ~$155,356 net worth limit
KS

High veteran demand in rural/urban areas.

Benefits
Cash (~$1,433-$2,642/month veteran, ~$951-$1,318 spouse) for care costs (e.g., in-home, assisted living)

Frequently Asked Questions about Moran Manor

What neighborhood is Moran Manor in?

Moran Manor is in the Moran neighborhood.

Is Moran Manor in a walkable area?

Moran Manor has a walk score of 21. Car-dependent. Most errands require a car, with limited nearby walkable options.

What is the occupancy rate at Moran Manor?

Moran Manor's occupancy is 66.7%.

Are there photos of Moran Manor?

Yes — there are 4 photos of Moran Manor in the photo gallery on this page.

What is the address of Moran Manor?

Moran Manor is located at 3940 Us-54, Moran, KS 66755.

What is the phone number of Moran Manor?

(620) 237-4309 will put you in contact with the team at Moran Manor.

Is Moran Manor Medicare or Medicaid certified?

Yes — Moran Manor is a CMS-certified provider of Medicare and Medicaid.

Guides for Better Senior Living

Care Cost Calculator: See Prices in Your Area

Nursing Home Data Explorer

Don’t Wait Too Long: 7 Red Flag Signs Your Parent Needs Assisted Living Now

The True Cost of Assisted Living in 2025 – And How Families Are Paying For It

Understanding Senior Living Costs: Pricing Models, Discounts & Financial Assistance