


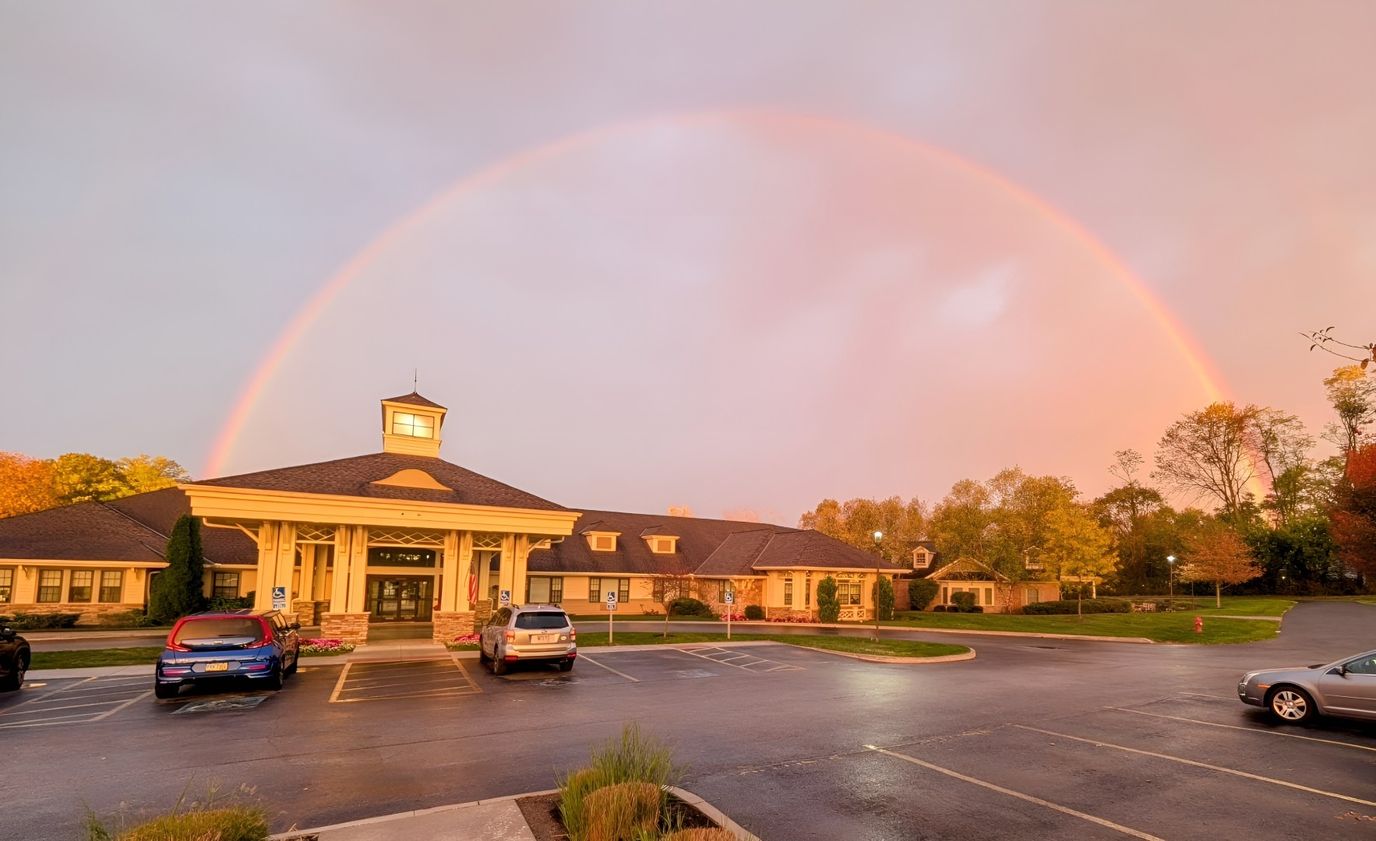
The Campus of Anna Maria of Aurora
Nursing Home, Assisted Living, Home Care, Independent Living, Memory Care & Skilled Nursing · Aurora, OH
The Campus of Anna Maria of Aurora
Nursing Home, Assisted Living, Home Care, Independent Living, Memory Care & Skilled Nursing · Aurora, OH
Anna Maria of Aurora is a well-regarded nursing home in Aurora, OH, that offers comprehensive care options, ranging from independent living to skilled nursing. As a family-owned and operated nursing home, the community ensures older adults can find a home away from home during their stay. 24-hour care, household and maintenance services, and chef-prepared dining are among the high-quality services provided to enrich residents’ living experiences. Through resident-centered care, the community strives to meet residents’ unique needs for their comfort and safety.
Social programs, exciting trips, and recreational activities provide residents with more opportunities to explore interests and gain fun experiences. The community also features a beauty and barber shop, an emergency response system, and spacious courtyards, ensuring residents can rest and interact with their surroundings. Set in the tree-lined neighborhood of Aurora, residents have a laid-back retirement. As a trusted continuing care retirement community in OH, this nursing home continuously provides the highest quality of care to help older adults have a worry-free retirement.
Walk Score: 17 / 100 Rank #567 / 704Walk Score — State benchmarkedThis home is ranked 567th out of 704 homes in Ohio for walk score. Shows how walkable this facility's neighborhood is compared to the average walk score across Ohio facilities. Higher scores benefit residents, families, and staff.Facilities with the same value for a metric share the same rank. Rankings are based only on facilities in Ohio that report data for that category. Facilities without available data are excluded from the ranking.Click the rank badge to see the full State ranking.Click here to see the full State ranking.
Car-dependent. Most errands require a car, with limited nearby walkable options.
What does this home offer?
No pets allowed
Housing Options: 1 Bed / 2 Bed
Building Type: Single-story
Beauty Services
Transportation Services
Housekeeping Services
Social and Recreational Activities
Exercise Programs

Meal Preparation

Grocery Shopping and Errands

Medication Reminders
Places of interest near The Campus of Anna Maria of Aurora
![]() 2.3 miles from city center
2.3 miles from city center
![]() Estimated distance in miles from Aurora's city center to The Campus of Anna Maria of Aurora's address, calculated via Google Maps.
Estimated distance in miles from Aurora's city center to The Campus of Anna Maria of Aurora's address, calculated via Google Maps.
Calculate Travel Distance to The Campus of Anna Maria of Aurora
Add your location
Compare Nursing Homes around the area
Info below is compiled from CMS reports & the OH Dept. of Health, senior community websites & trusted data sources such as Walk Score & BBB.
Communities are listed from highest to lowest based on our ranking methodology.
| Brookdale Westlake Village | NH AL IL MC SNF | Westlake | 60
Facility
60
OH AVG
75
Rank
#177 / 309 |
96.7%
Facility
96.7%
OH AVG
81.7
Rank
#4 / 138 | +18% | 4.38
Facility
4.38
OH AVG
3.54
Rank
#21 / 182 | +18% | +24% | $0
Facility
$0
OH AVG
$74.0k
Rank
#1 / 183 | 5
Facility
5
OH AVG
30.9
Rank
#9 / 183 | 1.3
Facility
1.3
OH AVG
4.6
Rank
#2 / 183 | - | 58 | A+ |
25
Facility
25
OH AVG
40
Rank
#500 / 704 | Labeed Diab | $20.1MFiscal year ending 12/2023
Facility
$20.1MFiscal year ending 12/2023
OH AVG
$10.1M
Rank
#66 / 183 | $10.2MFiscal year ending 12/2023
Facility
$10.2MFiscal year ending 12/2023
OH AVG
$3.9M
Rank
#11 / 183 | 50.8%Fiscal year ending 12/2023
Facility
50.8%Fiscal year ending 12/2023
OH AVG
40.2%
Rank
#5 / 183 | 366373 | ||||
| The Knolls of Oxford | NH AL IL MC SNF | Oxford | 50
Facility
50
OH AVG
75
Rank
#214 / 309 |
92.8%
Facility
92.8%
OH AVG
81.7
Rank
#25 / 138 | +14% | 4.09
Facility
4.09
OH AVG
3.54
Rank
#36 / 182 | -31% | +15% | $0
Facility
$0
OH AVG
$74.0k
Rank
#1 / 183 | 4
Facility
4
OH AVG
30.9
Rank
#4 / 183 | 2.0
Facility
2.0
OH AVG
4.6
Rank
#10 / 183 | - | 46 | - |
0
Facility
0
OH AVG
40
Rank
#686 / 704 | Ronald Beymer | $6.2MFiscal year ending 12/2023
Facility
$6.2MFiscal year ending 12/2023
OH AVG
$10.1M
Rank
#146 / 183 | $4.3MFiscal year ending 12/2023
Facility
$4.3MFiscal year ending 12/2023
OH AVG
$3.9M
Rank
#119 / 183 | 69.5%Fiscal year ending 12/2023
Facility
69.5%Fiscal year ending 12/2023
OH AVG
40.2%
Rank
#17 / 183 | 366282 | ||||
| Elizabeth Scott Community | NH AL MC SNF | Maumee | 60
Facility
60
OH AVG
75
Rank
#177 / 309 |
86.7%
Facility
86.7%
OH AVG
81.7
Rank
#68 / 138 | +6% | 3.52
Facility
3.52
OH AVG
3.54
Rank
#86 / 182 | -64% | -1% | $0
Facility
$0
OH AVG
$74.0k
Rank
#1 / 183 | 9
Facility
9
OH AVG
30.9
Rank
#21 / 183 | 2.3
Facility
2.3
OH AVG
4.6
Rank
#16 / 183 | - | 52 | A+ |
0
Facility
0
OH AVG
40
Rank
#686 / 704 | Elizabeth Scott, Inc | $6.7MFiscal year ending 12/2023
Facility
$6.7MFiscal year ending 12/2023
OH AVG
$10.1M
Rank
#129 / 183 | $3.2MFiscal year ending 12/2023
Facility
$3.2MFiscal year ending 12/2023
OH AVG
$3.9M
Rank
#118 / 183 | 48%Fiscal year ending 12/2023
Facility
48%Fiscal year ending 12/2023
OH AVG
40.2%
Rank
#50 / 183 | 366184 | ||||
| Locust Ridge | NH MC RC SNF | Williamsburg | 61
Facility
61
OH AVG
75
Rank
#174 / 309 |
90.2%
Facility
90.2%
OH AVG
81.7
Rank
#42 / 138 | +10% | 4.46
Facility
4.46
OH AVG
3.54
Rank
#17 / 182 | +35% | +26% | $0
Facility
$0
OH AVG
$74.0k
Rank
#1 / 183 | 18
Facility
18
OH AVG
30.9
Rank
#48 / 183 | 4.5
Facility
4.5
OH AVG
4.6
Rank
#108 / 183 | - | 55 | A+ |
0
Facility
0
OH AVG
40
Rank
#686 / 704 | Gary Vannostrand | $5.9MFiscal year ending 12/2023
Facility
$5.9MFiscal year ending 12/2023
OH AVG
$10.1M
Rank
#157 / 183 | $2.7MFiscal year ending 12/2023
Facility
$2.7MFiscal year ending 12/2023
OH AVG
$3.9M
Rank
#149 / 183 | 45.2%Fiscal year ending 12/2023
Facility
45.2%Fiscal year ending 12/2023
OH AVG
40.2%
Rank
#34 / 183 | 365336 |
Frequently Asked Questions about The Campus of Anna Maria of Aurora
Is The Campus of Anna Maria of Aurora in a walkable area?
The Campus of Anna Maria of Aurora has a walk score of 17. Car-dependent. Most errands require a car, with limited nearby walkable options.
Are pets allowed at The Campus of Anna Maria of Aurora?
No, The Campus of Anna Maria of Aurora has a no-pet policy.
Are there photos of The Campus of Anna Maria of Aurora?
Yes — there are 6 photos of The Campus of Anna Maria of Aurora in the photo gallery on this page.
What is the address of The Campus of Anna Maria of Aurora?
The Campus of Anna Maria of Aurora is located at 889 N Aurora Rd, Aurora, OH 44202.
What is the phone number of The Campus of Anna Maria of Aurora?
(330) 562-6171 will put you in contact with the team at The Campus of Anna Maria of Aurora.
Is The Campus of Anna Maria of Aurora Medicare or Medicaid certified?
The Campus of Anna Maria of Aurora is not currently listed as a CMS-certified provider of Medicare or Medicaid.
Guides for Better Senior Living
Care Cost Calculator: See Prices in Your Area
Nursing Home Data Explorer
Don’t Wait Too Long: 7 Red Flag Signs Your Parent Needs Assisted Living Now
The True Cost of Assisted Living in 2025 – And How Families Are Paying For It
Understanding Senior Living Costs: Pricing Models, Discounts & Financial Assistance
Updated on
