JAG Healthcare Burbank
Nursing Home, Assisted Living & Skilled Nursing · Ohio, OH
CMS overall rating Info The Overall CMS Rating is scored from 1 to 5 stars and combines results from health inspections, staffing levels, and quality measures. Health inspections carry the most weight. Staffing and quality scores can increase or decrease the final rating based on performance compared to state and national standards.

JAG Healthcare Burbank

Nursing Home, Assisted Living & Skilled Nursing · Ohio, OH
CMS overall rating Info The Overall CMS Rating is scored from 1 to 5 stars and combines results from health inspections, staffing levels, and quality measures. Health inspections carry the most weight. Staffing and quality scores can increase or decrease the final rating based on performance compared to state and national standards.
Calculator: See prices in your area
JAG Healthcare Burbank accepts Medicare, Medicaid, and private pay.

Overview of Jag Healthcare Burbank

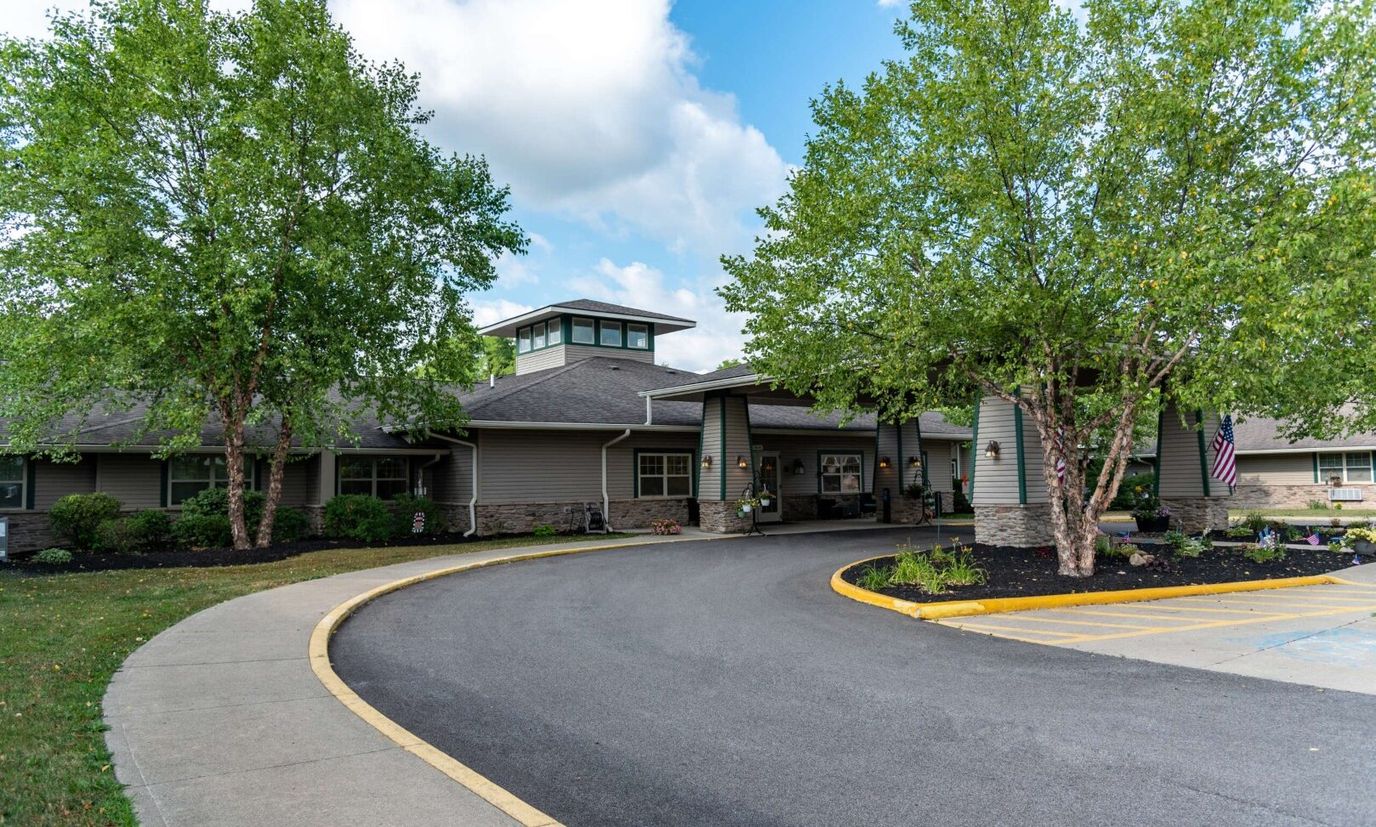
JAG Healthcare- Burbank is a trusted nursing home in Burbank, OH, that offers a wide range of care options, including assisted living, skilled nursing, and hospice care. The community also treats older adults like family, ensuring their comfort and safety. With a specially trained team, nutritious meals, and recreational activities, residents experience a hassle-free lifestyle. Prioritizing residents’ ever-changing needs, the community works closely with trusted healthcare providers to create care plans that best match them.

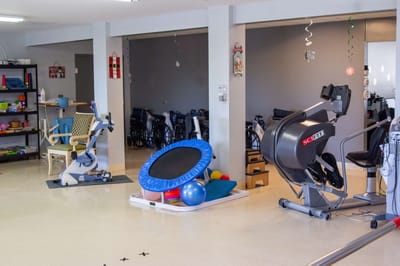
Holiday celebrations, fitness programs, and pet visits are among the leisure activities that residents can join to prevent loneliness and isolation. State-of-the-art amenities and lively gathering areas are also available, ensuring residents can keep their peace of mind. With its quiet setting in Burbank, the community ensures a laid-back and convenient lifestyle. This nursing home is one of the best options for senior living in Ohio, as it has comprehensive care options that aim to help older adults recover with ease and age gracefully.

Quality ratings

Measured by Centers for Medicare & Medicaid Services (CMS)

Overall rating Info The Overall CMS Rating combines results from health inspections, staffing levels and quality measures. Health inspections carry the most weight. Staffing and quality scores can increase or decrease the final rating based on performance compared to state and national standards.
▼ 5.7% Below OH avg. ▼ 5.7% Below OH avg.Click the badge to see the full State ranking.Click here to see the full State ranking.
Health Inspection Info Based on the results of the facility's three most recent standard inspections and any complaint investigations. CMS reviews the number, scope, and severity of deficiencies, with more recent findings weighted more heavily.
▼ 28.6% Below OH avg. ▼ 28.6% Below OH avg.Click the badge to see the full State ranking.Click here to see the full State ranking.
Staffing Info Measures average nursing staff hours per resident per day, including Registered Nurses (RNs) and total nursing staff. Ratings are adjusted based on the level of care residents require and are compared to state and national benchmarks.
▼ 18.1% Below OH avg. ▼ 18.1% Below OH avg.Click the badge to see the full State ranking.Click here to see the full State ranking.
Quality Measures Info Based on clinical and physical health indicators reported to CMS, such as hospital readmissions, falls, pressure ulcers, and improvements in mobility. These measures reflect how well residents' health needs are being managed.
▲ 14.7% Above OH avg. ▲ 14.7% Above OH avg.Click the badge to see the full State ranking.Click here to see the full State ranking.

Staffing hours breakdown

Info Daily nursing hours per resident by staff type, reported to CMS. Higher is generally better — compare this facility to state and national averages to see where staffing stands.

Hours per resident per day — compared to Ohio state averages

Total nursing care / resident Info This home is ranked 85th out of 203 homes in Ohio. Total adjusted nursing hours per resident per day, combining RN, LPN, and aide time. CMS adjusts this for case-mix so facilities can be fairly compared.
3h 37m per day
Rank #85 / 203Nurse hours — State benchmarkedThis home is ranked 85th out of 203 homes in Ohio. Shows adjusted nurse hours per resident per day benchmarked to the Ohio average, with a ranking across 203 Ohio SNFs. More hours mean more direct care. The national average is about 3.5 hrs; below 3.0 is a red flag.Click the rank badge to see the full State ranking.Click here to see the full State ranking.
This facility Ohio avg (3h 32m per day)
vs Ohio avg
+2%
Staff type Hours / Day / Resident vs state avg
Weekend Total Nursing Info Combined nursing hours (RN + LPN + Nurse Aide) per resident per day on weekends. Staffing often drops on weekends — this figure reveals whether the facility maintains adequate coverage outside of weekday hours. 3h 22m per day

Types of Care at JAG Healthcare Burbank

Assisted Living Skilled Nursing

Capacity and availability

This home usually has availability

Occupancy lower than 85% suggests more openings may be available.

Higher occupancy than the Ohio average: 78.7%
Occupancy rate 84.3% Rank #90 / 204Occupancy rate — State benchmarkedThis home is ranked 90th out of 204 homes in Ohio. Shows this facility's occupancy rate versus the Ohio average, with its Statewide rank out of 204. Higher occupancy signals strong local demand and financial stability.Click the rank badge to see the full State ranking.Click here to see the full State ranking.
Avg. Length of Stay 181 days
Occupancy rate
84.3% Rank #90 / 204Occupancy rate — State benchmarkedThis home is ranked 90th out of 204 homes in Ohio. Shows this facility's occupancy rate versus the Ohio average, with its Statewide rank out of 204. Higher occupancy signals strong local demand and financial stability.Click the rank badge to see the full State ranking.Click here to see the full State ranking.
Avg. Length of Stay
181 days
Walk Score
Walk Score: 1 / 100 Rank #675 / 706Walk Score — State benchmarkedThis home is ranked 675th out of 706 homes in Ohio. Shows how walkable this facility's neighborhood is compared to the average Walk Score across Ohio SNFs. Higher scores benefit residents, families, and staff.Click the rank badge to see the full State ranking.Click here to see the full State ranking.
Car-dependent. Most errands require a car, with limited nearby walkable options.

About this community

Therapy & Rehabilitation

1 service
Rehabilitation Services

Additional Services

3 services
Intermediate Care
Specialized Memory Care
Hospice Services

Amenities & Lifestyle

Specific ProgramsBurbank, Columbus, Harding, Mansfield, Marion, Orrville, Shelby, Union City, Wooster, Employment Opportunities, Nurse Aide Training

Contact JAG Healthcare Burbank

Staffing Data

Reporting period: October 1 – December 31, 2025 (Q4 2025). Source: CMS Payroll-Based Journal report.

Total staff 106
Employees 102
Contractors 4
Staff to resident ratio 1.58:1
22% worse than Ohio average
Ohio average ratio: 2.04:1 Ohio average ratio: 2.04:1See full Ohio ranking
Avg staff/day 46
Average shift 6.7 hours
17% worse than Ohio average
Ohio average: 8.1 hours Ohio average shift: 8.1 hoursSee full Ohio ranking
Total staff hours (quarter) 28,544

Nursing staff breakdown

Q4 2025 · Oct 1 – Dec 31 More info This data comes from the CMS Payroll-Based Journal report covering October 1 – December 31, 2025.
Registered Nurse

Manages medical care and health needs.

RN Staff 8
Average shift length Info Average shift length. Calculated as total hours divided by days worked and average staff per day. 7.1 hours

No contractors work on this role.

Licensed Practical Nurse

Assists with medical care and medications.

LPN Staff 18
Average shift length Info Average shift length. Calculated as total hours divided by days worked and average staff per day. 7.8 hours

No contractors work on this role.

Certified Nursing Assistant

Helps with daily care and mobility.

CNA Staff 52
Average shift length Info Average shift length. Calculated as total hours divided by days worked and average staff per day. 6.6 hours

No contractors work on this role.

Contractor staffing

Q4 2025 · Oct 1 – Dec 31 More info This data comes from the CMS Payroll-Based Journal report covering October 1 – December 31, 2025.

Total hours from contractors

0.5%

156 contractor hours this quarter

Feeding Assistant: 2 Medical Director: 1 Occupational Therapy Assistant: 1

Staff by category

Q4 2025 · Oct 1 – Dec 31 More info This data comes from the CMS Payroll-Based Journal report covering October 1 – December 31, 2025.
Certified Nursing Assistant 52 0 52 14,232 92 100% 6.6
Licensed Practical Nurse 18 0 18 5,912 92 100% 7.8
Registered Nurse 8 0 8 1,248 85 92% 7.1
Clinical Nurse Specialist 3 0 3 1,158 74 80% 8
Physical Therapy Aide 2 0 2 1,009 79 86% 7.6
RN Director of Nursing 2 0 2 880 65 71% 8.2
Other Dietary Services Staff 5 0 5 846 89 97% 4.6
Speech Language Pathologist 2 0 2 760 76 83% 7
Mental Health Service Worker 1 0 1 488 61 66% 8
Nurse Aide in Training 3 0 3 449 52 57% 7.8
Nurse Practitioner 1 0 1 400 50 54% 8
Dietitian 1 0 1 382 64 70% 6
Administrator 1 0 1 192 28 30% 6.9
Physical Therapy Assistant 1 0 1 152 45 49% 3.4
Qualified Social Worker 1 0 1 150 56 61% 2.7
Respiratory Therapy Technician 1 0 1 134 46 50% 2.9
Feeding Assistant 0 2 2 102 29 32% 3.4
Occupational Therapy Assistant 0 1 1 35 14 15% 2.5
Medical Director 0 1 1 20 13 14% 1.5
52 Certified Nursing Assistant
% of Days 100%
18 Licensed Practical Nurse
% of Days 100%
8 Registered Nurse
% of Days 92%
3 Clinical Nurse Specialist
% of Days 80%
2 Physical Therapy Aide
% of Days 86%
2 RN Director of Nursing
% of Days 71%
5 Other Dietary Services Staff
% of Days 97%
2 Speech Language Pathologist
% of Days 83%
1 Mental Health Service Worker
% of Days 66%
3 Nurse Aide in Training
% of Days 57%
1 Nurse Practitioner
% of Days 54%
1 Dietitian
% of Days 70%
1 Administrator
% of Days 30%
1 Physical Therapy Assistant
% of Days 49%
1 Qualified Social Worker
% of Days 61%
1 Respiratory Therapy Technician
% of Days 50%
2 Feeding Assistant
% of Days 32%
1 Occupational Therapy Assistant
% of Days 15%
1 Medical Director
% of Days 14%

Penalties and fines

Federal penalties imposed by CMS for regulatory violations, including civil money penalties (fines) and denials of payment for new Medicare/Medicaid admissions.

Source: CMS Penalties Database

No penalties in the past 3 years

No civil money penalties or payment denials were reported in the last 3 years.

Quality of care over time

These measures show how residents usually do over time at this home, based on health outcomes and preventive care.

High-risk clinical events score Info A composite score based on pressure ulcers, falls with injury, weight loss, walking ability decline, and activities of daily living decline. 5.4
7% better than Ohio average

Ohio average: 5.8

Functional decline score Info A composite score based on activities of daily living decline, walking ability decline, and incontinence. 9.4
26% better than Ohio average

Ohio average: 12.7

Long-stay resident measures
Need for Help with Daily Activities Increased Info Percent of long-stay residents whose need for help with daily activities has increased 6.0%
13% better than Ohio average

Ohio average: 6.8%

Walking Ability Worsened Info Percent of long-stay residents whose ability to move independently worsened 9.4%
6% worse than Ohio average

Ohio average: 8.9%

Low Risk Residents with Bowel/Bladder Incontinence Info Percent of low risk long-stay residents who lose control of their bowels or bladder 12.8%
42% better than Ohio average

Ohio average: 22.0%

Falls with Major Injury Info Percent of long-stay residents experiencing one or more falls with major injury 3.4%
In line with Ohio average

Ohio average: 3.4%

High Risk Residents with Pressure Ulcers Info Percent of long-stay high risk residents with pressure ulcers 1.7%
57% better than Ohio average

Ohio average: 3.9%

Urinary Tract Infection Info Percent of long-stay residents with a urinary tract infection 2.3%
318% worse than Ohio average

Ohio average: 0.5%

Lost Too Much Weight Info Percent of long-stay residents who lose too much weight 6.6%
7% worse than Ohio average

Ohio average: 6.2%

Depressive Symptoms Info Percent of long-stay residents who have depressive symptoms 65.0%
171% worse than Ohio average

Ohio average: 24.0%

Antipsychotic Use Info Percent of long-stay residents who received an antipsychotic medication 12.7%
50% worse than Ohio average

Ohio average: 8.4%

Pneumococcal Vaccine Info Percent of long-stay residents assessed and appropriately given the pneumococcal vaccine 95.5%
In line with Ohio average

Ohio average: 92.4%

Influenza Vaccine Info Percent of long-stay residents assessed and appropriately given the seasonal influenza vaccine 98.6%
In line with Ohio average

Ohio average: 94.5%

Short-stay resident measures
Pneumococcal Vaccine Info Percent of short-stay residents assessed and appropriately given the pneumococcal vaccine 77.8%
In line with Ohio average

Ohio average: 78.0%

Antipsychotic medication increase Info Percent of short-stay residents who newly received an antipsychotic medication 0.0%
100% better than Ohio average

Ohio average: 1.3%

Influenza Vaccine Info Percent of short-stay residents assessed and appropriately given the seasonal influenza vaccine 79.4%
5% better than Ohio average

Ohio average: 75.6%

Breakdown by payment type

Medicare

14% of new residents, usually for short-term rehab.

Typical stay 1 months

Private pay

74% of new residents, often for short stays.

Typical stay 6 - 7 months

Medicaid

12% of new residents, often for long-term daily care.

Typical stay 9 - 10 months

Facility Characteristics

Source: CMS Long-Term Care Facility Characteristics (Data as of Jan 2026)

Total residents 67
Medicare
1
1.5% of residents
Medicaid
50
74.6% of residents
Private pay or other
16
23.9% of residents
Programs & Services
Residents Group

Residents meet regularly to discuss policies, care quality, and activities

Family Member Group

Family members meet regularly to discuss policies, care quality, and activities

Nurse Aide Training

State-approved Nurse Aide Training and Competency Evaluation Program on-site

Active Family Council

Organized group of family members that meets regularly to discuss facility policies, resident care, and activities.

Active Resident Council

Organized group of residents that meets regularly to discuss facility policies, quality of life, and activities.

Finances and operations

Privately-owned community
Operated by a business corporation.
Home revenue
$7.8M
Profit
$569.6K
Privately-owned community Operated by a business corporation.
Home revenue
$7.8M Rank #156 / 203Revenue — State benchmarkedThis home is ranked 156th out of 203 homes in Ohio. Shows this facility's annual revenue compared to the Ohio SNF average. Higher revenue generally means more resources for staffing and capital — read alongside Payroll %.Click the rank badge to see the full State ranking.Click here to see the full State ranking.
Profit
$569.6K
Payroll costs Info The portion of the home's budget spent on staff, including nurses, caregivers, and other employees who support care and operations. Rank #147 / 203Payroll — State benchmarkedThis home is ranked 147th out of 203 homes in Ohio. Shows total annual staff payroll benchmarked to the Ohio average. Higher payroll investment relative to peers often signals better staffing and less reliance on cheaper contract labor.Click the rank badge to see the full State ranking.Click here to see the full State ranking.
$4.2M
54.2% of revenue Rank #65 / 203Payroll % — State benchmarkedThis home is ranked 65th out of 203 homes in Ohio. Shows payroll as a percentage of revenue versus the Ohio average. Well-run Ohio SNFs typically land around 54–64% — the top third Statewide. Below 25% may signal understaffing or heavy agency use — read with Staffing ratings.Click the rank badge to see the full State ranking.Click here to see the full State ranking.
Other operating costs Info All remaining costs needed to run the home, such as food, utilities, building maintenance, supplies and administrative expenses.
$3.0M
Total costs $7.3M

What does this home offer?

Housing options icon

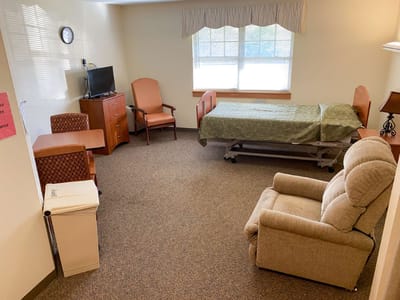
Housing Options: Private Rooms

Building type icon
Building type icon

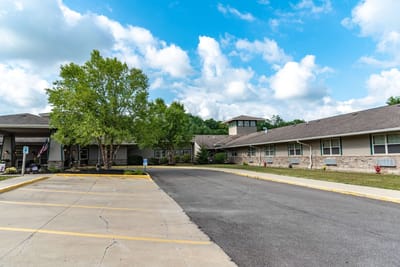
Building Type: Single-story

Dining services icon

Dining Services

Rehabilitative support icon

Rehabilitative Support

On-site medical care and health services icon

On-site Medical Care and Health Services

Who this home usually serves

TYPE OF STAY

Primarily short stays

Residents typically stay for brief periods, with frequent admissions and discharges throughout the year.

Places of interest near JAG Healthcare Burbank

Address 0.6 miles from city center Info Estimated distance in miles from Burbank's city center to JAG Healthcare Burbank's address, calculated via Google Maps.

Calculate Travel Distance to JAG Healthcare Burbank

Add your location

Address

Financial Assistance for
Nursing Home in Ohio

JAG Healthcare Burbank is located in Burbank, Ohio.
Here are the financial assistance programs available to residents in Ohio.

Get Financial aid guidance

PASSPORT Waiver

Ohio Medicaid PASSPORT

Age 60+
General Ohio resident, Medicaid-eligible, nursing home-level care need.
Income Limits (2025) ~$2,829/month 300% FBR, individual
Asset Limits $2,000 (individual), $3,000 (couple).
OH

Administered through regional agencies; waitlists possible.

Benefits
Personal care (5-7 hours/day) Respite (240 hours/year) Adult day care ($65/day) Home modifications ($1,500 avg.)

Ohio Home Care Program (non-Medicaid)

OH HCP

Age 60+
General Ohio resident, at risk of decline.
Income Limits ~$2,000/month individual, varies
Asset Limits $5,000 individual
OH

Limited funding; regional variation.

Benefits
In-home care (3-5 hours/week) Respite (up to 10 days/year) Transportation (~5 trips/month)

Assisted Living Waiver (ALW)

Ohio Assisted Living Waiver

Age 21+ (65+ prioritized)
General OH resident, Medicaid-eligible, NFLOC.
Income Limits (2025) ~$2,829/month (individual); QIT required.
Asset Limits $2,000 (individual), $3,000 (couple).
OH

Covers ~300 facilities; room/board not included (separate cost).

Benefits
Personal care Meals Medication management Transportation (~$3,000-$4,000/month value)

Program of All-Inclusive Care for the Elderly (PACE)

Ohio PACE (e.g., McGregor PACE)

Age 55+
General OH resident (specific counties), NFLOC, safe with PACE support.
Income Limits (2025) ~$2,829/month (Medicaid-eligible); private pay option available.
Asset Limits $2,000 (individual), $3,000 (couple) for Medicaid enrollees.
OH

Available in 9 counties (e.g., Cuyahoga, Franklin); expanding via Healthy Aging Grants.

Benefits
Personal care (5-7 hours/day) Medical care Meals Transportation Respite Therapies

Medicare Savings Program (MSP)

Ohio Medicare Savings Program

Age 65+ or disabled
General OH resident, Medicare Part A/B.
Income Limits (2025) ~$2,510/month (QMB), ~$3,380/month (SLMB), ~$3,598/month (QI)—individual.
Asset Limits $9,430 (individual), $14,130 (couple).
OH

Three tiers; includes Extra Help for Part D; no waitlist.

Benefits
Covers Part B premiums ($174.70/month) Deductibles ($240/year) Copays (~20%)

Home Energy Assistance Program (HEAP)

Ohio HEAP

Age 60+ prioritized
General OH resident, low-income household.
Income Limits (2025) ~$3,970/month individual, 185% FPL
Asset Limits Not assessed; income-focused.
OH

Covers gas, electric, oil; emergency aid via Winter/Summer Crisis Programs.

Benefits
Heating/cooling aid ($300-$1,000/season) Emergency aid ($500 max)

Family Caregiver Support Program (FCSP)

Ohio Family Caregiver Support Program

Age
General Caregivers of 60+ needing care or 55+ caregivers of others; OH resident; functional needs (2+ ADLs).
Income Limits (2025) Prioritizes ~$24,980/year (individual); no strict cap.
Asset Limits Not assessed; need-based.
OH

12 AAAs; rural/low-income priority; volunteer respite option.

Benefits
Respite (4-6 hours/week or 5 days/year) Adult day care ($60/day) Training Supplies (~$500/year)

VA Aid and Attendance (A&A) and Housebound Benefits

Ohio VA Aid and Attendance/Housebound

Age 65+ or disabled veteran/spouse
General OH resident, wartime service, need for ADL help (A&A) or homebound.
Income Limits (2025) Net income < ~$1,984/month (veteran with dependent, A&A); pension offsets income.
Asset Limits ~$155,356 net worth limit
OH

High veteran demand; supports care in multiple settings.

Benefits
Cash (~$1,433-$2,642/month veteran, ~$951-$1,318 spouse) for care costs (e.g., in-home, assisted living)

Homestead Exemption

Ohio Homestead Exemption

Age 65+ (or disabled)
General OH resident, homeowner, low-income.
Income Limits (2025) ~$38,500/year individual, adjusted annually
Asset Limits Not assessed; home ownership required.
OH

Reduces taxable value by $25,000; applies to primary residence.

Benefits
Tax reduction (~$400-$800/year avg., varies by county)

Save the Dream Ohio (Homeowner Assistance Fund)

Ohio Save the Dream

Age 60+ prioritized
General OH resident, homeowner, hardship post-Jan 21, 2020.
Income Limits (2025) ~$147,600/year family of 4, 150% AMI; varies by county
Asset Limits Not assessed; hardship-focused.
OH

Covers delinquent mortgages, utilities, taxes; max $25,000 mortgage aid.

Benefits
Mortgage aid ($25,000 max) Utility/property tax aid ($5,000 avg.)

Frequently Asked Questions about JAG Healthcare Burbank

Is JAG Healthcare Burbank in a walkable area?

JAG Healthcare Burbank has a walk score of 1. Car-dependent. Most errands require a car, with limited nearby walkable options.

Are there photos of JAG Healthcare Burbank?

Yes — there are 3 photos of JAG Healthcare Burbank in the photo gallery on this page.

What is the address of JAG Healthcare Burbank?

JAG Healthcare Burbank is located at 14976 Burbank Rd, Burbank, OH 44214.

What is the phone number of JAG Healthcare Burbank?

(330) 624-7406 will put you in contact with the team at JAG Healthcare Burbank.

Is JAG Healthcare Burbank Medicare or Medicaid certified?

Yes — JAG Healthcare Burbank is a CMS-certified provider of Medicare and Medicaid.

Guides for Better Senior Living

Care Cost Calculator: See Prices in Your Area

Nursing Home Data Explorer

Don’t Wait Too Long: 7 Red Flag Signs Your Parent Needs Assisted Living Now

The True Cost of Assisted Living in 2025 – And How Families Are Paying For It

Understanding Senior Living Costs: Pricing Models, Discounts & Financial Assistance

Explore Open Rooms
1 Contact details
2 What type of senior care service are you looking for?
3 What budget do you have in mind for senior care?
4 How soon do you need to find care?
5 Additional details

Thank you for your interest!

Our team will be in touch shortly to help with next steps.