


Total staff
161
Employees
58
Contractors
103


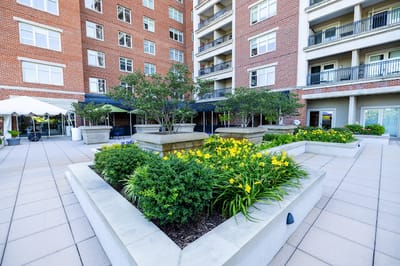


Focused on short-term rehabilitation, Harbor’s Edge is a 33-bed nursing community owned by Cathy L’heureux. Residents stay an average of 39 days, making it a suitable option for older adults recovering from surgery, orthopedic procedures, or hospitalization before returning home. The high-rise community offers one-bedroom, two-bedroom, and three-bedroom residences and accepts Medicare and private pay.
Around-the-clock nursing support is available, with residents receiving an average of 6 hours and 37 minutes of daily care. Registered nurses provide approximately 1 hour and 45 minutes each day, nursing aides contribute 4 hours and 3 minutes, and LPNs/LVNs add another 1 hour and 19 minutes to support rehabilitation and recovery.
Fine dining and a variety of freshly prepared meals help make daily life more comfortable during a rehabilitation stay. The surrounding neighborhood has a walkability score of 46, allowing access to some nearby destinations on foot, although most trips require transportation. Tours are available daily from 9:00 a.m. to 5:00 p.m., which allows families to explore the residences and learn more about the community.
Staffing hours
![]() Daily nursing hours per resident by staff type, reported to CMS. Higher is generally better — compare this facility to state and national averages to see where staffing stands.
Daily nursing hours per resident by staff type, reported to CMS. Higher is generally better — compare this facility to state and national averages to see where staffing stands.
Hours per resident per day vs Virginia averages
Total nursing care
![]() This home is ranked 3rd out of 70 homes in Virginia for nurse hours. Total adjusted nursing hours per resident per day, combining RN, LPN, and aide time. CMS adjusts this for case-mix so facilities can be fairly compared.
This home is ranked 3rd out of 70 homes in Virginia for nurse hours. Total adjusted nursing hours per resident per day, combining RN, LPN, and aide time. CMS adjusts this for case-mix so facilities can be fairly compared.
6h 37m
77% above state avgAll 6 underlying metrics are above the state average
Reporting period: October 1 – December 31, 2025 (Q4 2025). Source: CMS Payroll-Based Journal report.
Manages medical care and health needs.
Assists with medical care and medications.
Helps with daily care and mobility.
Total hours from contractors
8,231 contractor hours this quarter
| Certified Nursing Assistant | 26 | 53 | 79 | 10,889 | 92 | 100% | 7.4 |
| Registered Nurse | 11 | 6 | 17 | 3,487 | 92 | 100% | 8.3 |
| Licensed Practical Nurse | 11 | 25 | 36 | 3,034 | 92 | 100% | 7.3 |
| Speech Language Pathologist | 0 | 6 | 6 | 1,241 | 63 | 68% | 6.6 |
| Administrator | 2 | 0 | 2 | 990 | 66 | 72% | 7.5 |
| Physical Therapy Aide | 0 | 2 | 2 | 859 | 65 | 71% | 7.4 |
| Clinical Nurse Specialist | 2 | 0 | 2 | 847 | 63 | 68% | 8.3 |
| RN Director of Nursing | 1 | 0 | 1 | 520 | 70 | 76% | 7.4 |
| Occupational Therapy Aide | 1 | 1 | 2 | 506 | 60 | 65% | 5.2 |
| Other Dietary Services Staff | 1 | 0 | 1 | 495 | 66 | 72% | 7.5 |
| Dental Services Staff | 1 | 0 | 1 | 491 | 61 | 66% | 8 |
| Therapeutic Recreation Specialist | 0 | 1 | 1 | 433 | 66 | 72% | 6.6 |
| Respiratory Therapy Technician | 0 | 4 | 4 | 423 | 60 | 65% | 5.5 |
| Nurse Practitioner | 2 | 0 | 2 | 390 | 52 | 57% | 7.5 |
| Physical Therapy Assistant | 0 | 2 | 2 | 200 | 43 | 47% | 4.7 |
| Qualified Social Worker | 0 | 1 | 1 | 116 | 44 | 48% | 2.6 |
| Medical Director | 0 | 1 | 1 | 45 | 33 | 36% | 1.4 |
| Occupational Therapy Assistant | 0 | 1 | 1 | 6 | 3 | 3% | 2 |
Federal penalties imposed by CMS for regulatory violations, including civil money penalties (fines) and denials of payment for new Medicare/Medicaid admissions.
Source: CMS Penalties Database
No penalties in the past 3 years
No civil money penalties or payment denials were reported in the last 3 years.
These measures show how residents usually do over time at this home, based on health outcomes and preventive care.
Virginia average: 10.1
Virginia average: 19.7
Virginia average: 16.8%
Virginia average: 22.6%
Virginia average: 3.6%
Virginia average: 5.4%
Virginia average: 1.5%
Virginia average: 5.9%
Virginia average: 14.9%
Virginia average: 12.9%
Virginia average: 91.3%
Virginia average: 74.9%
Virginia average: 1.2%
Virginia average: 73.6%
Quality measures are calculated from Minimum Data Set (MDS) assessments. For most measures, lower percentages indicate better care quality.
74% of new residents, usually for short-term rehab.
26% of new residents, often for short stays.
Source: CMS Long-Term Care Facility Characteristics (Data as of Jan 2026)
Residents meet regularly to discuss policies, care quality, and activities
Part of a Continuing Care Retirement Community offering multiple care levels
Organized group of residents that meets regularly to discuss facility policies, quality of life, and activities.
Data sourced from CMS Long-Term Care Facility Characteristics quarterly report. Payer mix reflects the current resident census by primary payment source.
Historical financial and operational data for Harbor‘s Edge from 2012–2023, based on CMS SNF Cost Reports.
Key figures below are for fiscal year ending in 09/2023.
Based on CMS SNF Cost Report for fiscal year ending in 09/2023.
Pets Allowed
Housing Options: 1 Bed / 2 Bed / 3 Bed
Building Type: High-rise
Transportation Services
Fitness and Recreation
Most residents typically stay for a few weeks or months before returning home or moving on.
Most new residents arrive under Medicare (74% of admissions), and a typical Medicare stay runs around 28 days.
Coverage residents most often arrive under.
Coverage residents most often leave under.
![]() 1.6 miles from city center
1.6 miles from city center
![]() Estimated distance in miles from Norfolk's city center to Harbor‘s Edge's address, calculated via Google Maps.
Estimated distance in miles from Norfolk's city center to Harbor‘s Edge's address, calculated via Google Maps.
Add your location
Info below is compiled from CMS reports & the VA Depts. of Social Services & Health, senior community websites & trusted data sources such as Walk Score & BBB.
Communities are listed from highest to lowest based on our ranking methodology.
| Harbor‘s Edge | NH AL IL MC SNF | Norfolk (Fort Norfolk) | 33
Facility
33
VA AVG
96
Rank
#332 / 365 |
88.8%
Facility
88.8%
VA AVG
70.4
Rank
#48 / 297 | +26% | 6.62
Facility
6.62
VA AVG
3.74
Rank
#3 / 70 | +10% | +77% | $0
Facility
$0
VA AVG
$54.3k
Rank
#1 / 74 | 20
Facility
20
VA AVG
38.4
Rank
#25 / 69 | 5.0
Facility
5.0
VA AVG
8.9
Rank
#19 / 69 | - | 29 | - |
46
Facility
46
VA AVG
45
Rank
#201 / 435 | Cathy L'heureux | $32.5MFiscal year ending 09/2023
Facility
$32.5MFiscal year ending 09/2023
VA AVG
$19.9M
Rank
#8 / 69 | $12.3MFiscal year ending 09/2023
Facility
$12.3MFiscal year ending 09/2023
VA AVG
$11.3M
Rank
#23 / 69 | 37.8%Fiscal year ending 09/2023
Facility
37.8%Fiscal year ending 09/2023
VA AVG
76.3%
Rank
#66 / 69 | 495395 | ||||
| Autumn Care of Norfolk | NH HOS MC RC SNF | Norfolk (Foxhall) | 120
Facility
120
VA AVG
96
Rank
#88 / 365 |
94.0%
Facility
94.0%
VA AVG
70.4
Rank
#26 / 297 | +34% | 3.24
Facility
3.24
VA AVG
3.74
Rank
#57 / 70 | -26% | -13% | $0
Facility
$0
VA AVG
$54.3k
Rank
#1 / 74 | 43
Facility
43
VA AVG
38.4
Rank
#49 / 69 | 14.3
Facility
14.3
VA AVG
8.9
Rank
#58 / 69 | - | 113 | - |
56
Facility
56
VA AVG
45
Rank
#142 / 435 | Celia Soper | $10.8MFiscal year ending 12/2023
Facility
$10.8MFiscal year ending 12/2023
VA AVG
$19.9M
Rank
#52 / 69 | $6.5MFiscal year ending 12/2023
Facility
$6.5MFiscal year ending 12/2023
VA AVG
$11.3M
Rank
#50 / 69 | 59.9%Fiscal year ending 12/2023
Facility
59.9%Fiscal year ending 12/2023
VA AVG
76.3%
Rank
#20 / 69 | 495253 | ||||
| Signature Healthcare of Norfolk | NH HOS MC PC RC SNF | Norfolk (Ghent) | 169
Facility
169
VA AVG
96
Rank
#29 / 365 |
92.3%
Facility
92.3%
VA AVG
70.4
Rank
#34 / 297 | +31% | 3.39
Facility
3.39
VA AVG
3.74
Rank
#46 / 70 | +11% | -9% | $0
Facility
$0
VA AVG
$54.3k
Rank
#1 / 74 | 47
Facility
47
VA AVG
38.4
Rank
#54 / 69 | 15.7
Facility
15.7
VA AVG
8.9
Rank
#64 / 69 | 3 | 156 | - |
88
Facility
88
VA AVG
45
Rank
#20 / 435 | Dr. Cie Ake | $13.4MFiscal year ending 12/2023
Facility
$13.4MFiscal year ending 12/2023
VA AVG
$19.9M
Rank
#44 / 69 | $6.3MFiscal year ending 12/2023
Facility
$6.3MFiscal year ending 12/2023
VA AVG
$11.3M
Rank
#51 / 69 | 47.1%Fiscal year ending 12/2023
Facility
47.1%Fiscal year ending 12/2023
VA AVG
76.3%
Rank
#44 / 69 | 495068 | ||||
| Norview Heights Rehabilitation and Nursing | NH HOS PC RC SNF | Norfolk (Fairmont Park) | 60
Facility
60
VA AVG
96
Rank
#270 / 365 |
92.2%
Facility
92.2%
VA AVG
70.4
Rank
#35 / 297 | +31% | 3.27
Facility
3.27
VA AVG
3.74
Rank
#53 / 70 | -52% | -13% | $0
Facility
$0
VA AVG
$54.3k
Rank
#1 / 74 | 46
Facility
46
VA AVG
38.4
Rank
#52 / 69 | 9.2
Facility
9.2
VA AVG
8.9
Rank
#41 / 69 | 1 | 55 | - |
30
Facility
30
VA AVG
45
Rank
#304 / 435 | Kelli Marshall-Hodges | $6.9MFiscal year ending 03/2024
Facility
$6.9MFiscal year ending 03/2024
VA AVG
$19.9M
Rank
#68 / 69 | $4.2MFiscal year ending 03/2024
Facility
$4.2MFiscal year ending 03/2024
VA AVG
$11.3M
Rank
#68 / 69 | 60.4%Fiscal year ending 03/2024
Facility
60.4%Fiscal year ending 03/2024
VA AVG
76.3%
Rank
#19 / 69 | 495309 | ||||
| Consulate Health Care of Norfolk | NH MC SNF | Norfolk (Colonial Place) | 222
Facility
222
VA AVG
96
Rank
#10 / 365 |
71.2%
Facility
71.2%
VA AVG
70.4
Rank
#154 / 297 | +1% | 3.32
Facility
3.32
VA AVG
3.74
Rank
#53 / 70 | -33% | -11% | $0
Facility
$0
VA AVG
$54.3k
Rank
#1 / 74 | 54
Facility
54
VA AVG
38.4
Rank
#59 / 69 | 10.8
Facility
10.8
VA AVG
8.9
Rank
#47 / 69 | 3 | 158 | - |
77
Facility
77
VA AVG
45
Rank
#55 / 435 | Amir Hajimomenian | $15.5MFiscal year ending 12/2023
Facility
$15.5MFiscal year ending 12/2023
VA AVG
$19.9M
Rank
#40 / 69 | $8.0MFiscal year ending 12/2023
Facility
$8.0MFiscal year ending 12/2023
VA AVG
$11.3M
Rank
#41 / 69 | 51.5%Fiscal year ending 12/2023
Facility
51.5%Fiscal year ending 12/2023
VA AVG
76.3%
Rank
#28 / 69 | 495273 |
Harbor‘s Edge is located in Norfolk, Virginia.
Here are the financial assistance programs available to residents in Virginia.
Harbor‘s Edge is in the Fort Norfolk neighborhood.
Harbor‘s Edge has a walk score of 46. Somewhat walkable. A few nearby services may be reachable on foot, but most trips require transportation.
Harbor‘s Edge's occupancy is 175.0%.
Yes, Harbor‘s Edge allows residents to bring their pets.
Harbor‘s Edge is registered as a non-profit.
Yes — there are 11 photos of Harbor‘s Edge in the photo gallery on this page.
Harbor‘s Edge is located at One Colley Ave, Norfolk, VA 23510.
Care Cost Calculator: See Prices in Your Area
Nursing Home Data Explorer
Don’t Wait Too Long: 7 Red Flag Signs Your Parent Needs Assisted Living Now
The True Cost of Assisted Living in 2025 – And How Families Are Paying For It
Understanding Senior Living Costs: Pricing Models, Discounts & Financial Assistance


