Complete Care at Springbrook
Nursing Home, Hospice Care, Palliative Care & Respite Care · Silver Spring, MD
CMS overall rating Info CMS (the Centers for Medicare & Medicaid Services) is the federal agency that rates nursing home quality. Its Overall Rating runs from 1 to 5 stars, combining health inspections, staffing, and quality measures, with inspections weighted most heavily.

Complete Care at Springbrook

Nursing Home, Hospice Care, Palliative Care & Respite Care · Silver Spring, MD
CMS overall rating Info CMS (the Centers for Medicare & Medicaid Services) is the federal agency that rates nursing home quality. Its Overall Rating runs from 1 to 5 stars, combining health inspections, staffing, and quality measures, with inspections weighted most heavily.
Calculator: See prices in your area
Complete Care at Springbrook accepts Medicare, Medicaid, and private pay.

Overview of Complete Care at Springbrook

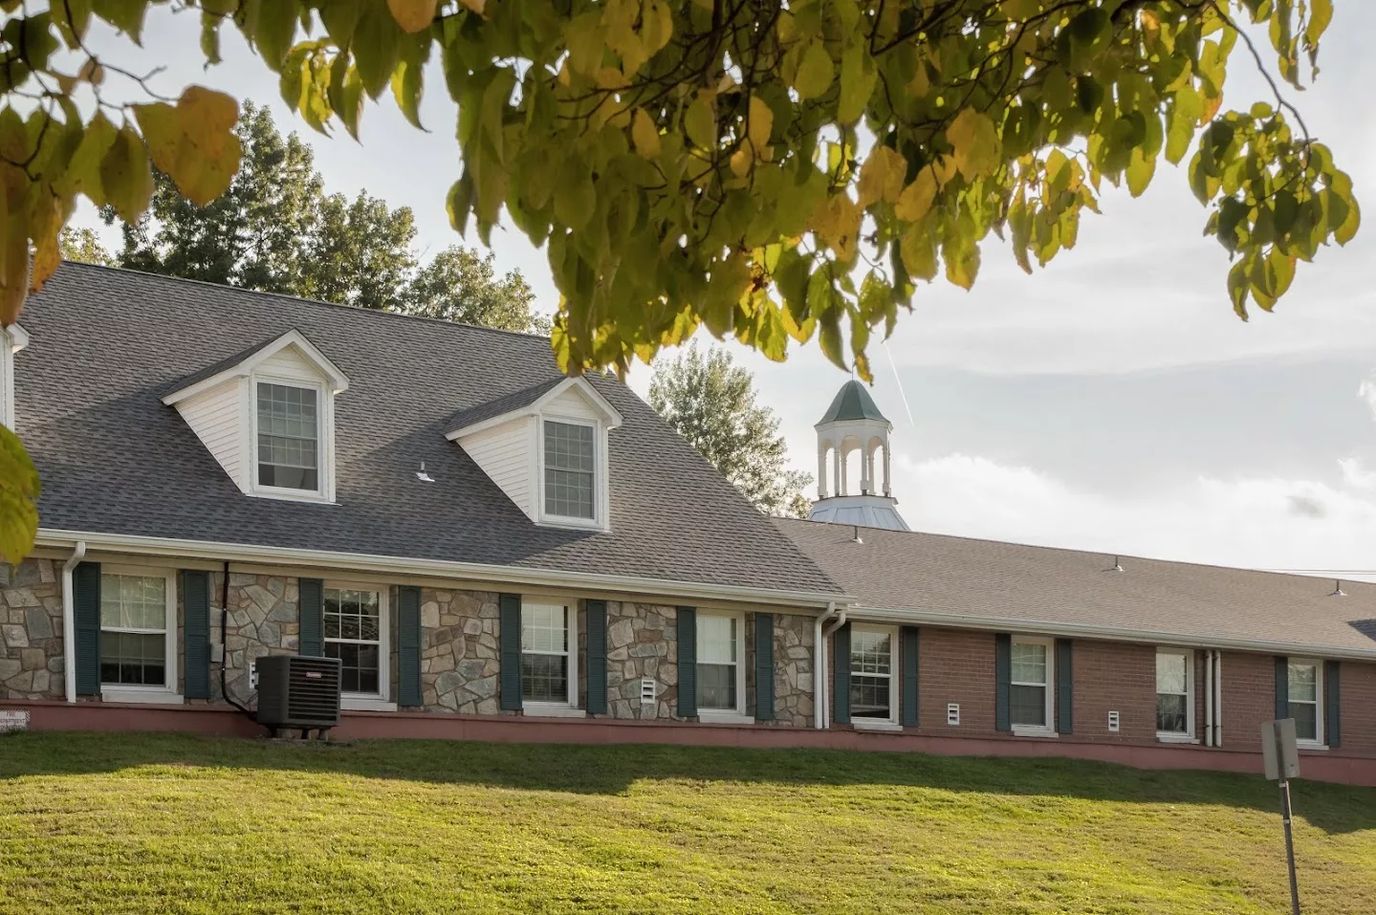
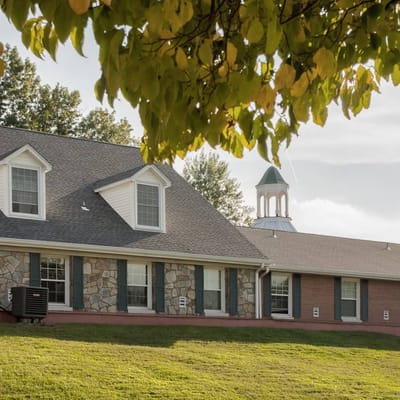
As its name suggests, Complete Care provides a complete list of comprehensive care that enhances the quality of life for its seniors. The nursing home practices the golden standard of exemplary living– a high-end level of medical attention. It’s been one of the most trusted skilled nursing communities in the city because it has the most comfortable and secure environment and lifestyle for the residents. Complete Care at Springbrook strives to improve the lives of its residents by touching their lives and leading them to an extraordinary experience of senior care. 

Complete Care specializes in orthopedic rehabilitation, sub-acute rehabilitation, in-house dialysis, long-term care, and in-house dialysis. 

Quality ratings

Measured by Centers for Medicare & Medicaid Services (CMS)

Overall rating Info The Overall CMS Rating combines results from health inspections, staffing levels and quality measures. Health inspections carry the most weight. Staffing and quality scores can increase or decrease the final rating based on performance compared to state and national standards.
▲ 64.4% Above MD avg. ▲ 64.4% Above MD avg.MD average: 3.0Click the badge to see the full State ranking.Click here to see the full State ranking.
Health Inspection Info Based on the results of the facility's three most recent standard inspections and any complaint investigations. CMS reviews the number, scope, and severity of deficiencies, with more recent findings weighted more heavily.
▲ 42.0% Above MD avg. ▲ 42.0% Above MD avg.MD average: 2.8Click the badge to see the full State ranking.Click here to see the full State ranking.
Staffing Info Measures average nursing staff hours per resident per day, including Registered Nurses (RNs) and total nursing staff. Ratings are adjusted based on the level of care residents require and are compared to state and national benchmarks.
▼ 34.3% Below MD avg. ▼ 34.3% Below MD avg.MD average: 3.0Click the badge to see the full State ranking.Click here to see the full State ranking.
Quality Measures Info Based on clinical and physical health indicators reported to CMS, such as hospital readmissions, falls, pressure ulcers, and improvements in mobility. These measures reflect how well residents' health needs are being managed.
▲ 35.3% Above MD avg. ▲ 35.3% Above MD avg.MD average: 3.7Click the badge to see the full State ranking.Click here to see the full State ranking.

Staffing hours breakdown

Info Daily nursing hours per resident by staff type, reported to CMS. Higher is generally better — compare this facility to state and national averages to see where staffing stands.

Hours per resident per day — compared to Maryland state averages

Total nursing care / resident Info Total adjusted nursing hours per resident per day, combining RN, LPN, and aide time. CMS adjusts this for case-mix so facilities can be fairly compared.
2h 46m per day
This facility Maryland avg (3h 46m per day)
vs Maryland avg
-27%

5 of 6 metrics below state avg

Standout metric LPN / LVN is +4% above state avg
Staff typeHours / Day / Residentvs state avg
Registered Nurse (RN) Info RNs hold the highest nursing license and can assess residents, interpret test results, and direct care plans. More RN hours per day often signals stronger clinical oversight and faster response to health changes. 35m per day ▼ 30% State avg: 50m per day · National avg: 41m per day
LPN / LVN Info Licensed Practical Nurses (LPNs) or Licensed Vocational Nurses (LVNs) deliver routine hands-on care — medication administration, wound dressing, and monitoring vital signs. They work under RN supervision and make up a large share of daily bedside care. 56m per day ▲ 4% State avg: 54m per day · National avg: 52m per day
Nurse Aide Info Certified Nurse Aides (CNAs) provide the most direct day-to-day assistance: bathing, dressing, feeding, and mobility. Nurse aide hours are typically the largest staffing category and directly affect residents' quality of life. 1h 50m per day ▼ 15% State avg: 2h 10m per day · National avg: 2h 21m per day
Weekend Total Nursing Info Combined nursing hours (RN + LPN + Nurse Aide) per resident per day on weekends. Staffing often drops on weekends — this figure reveals whether the facility maintains adequate coverage outside of weekday hours. 3h 0m per day ▼ 14% State avg: 3h 29m per day · National avg: 3h 26m per day
Physical Therapist Info Hours per resident per day provided by licensed Physical Therapists (PTs) or PT Assistants. PT services help residents recover mobility after injury or illness and are especially important for post-acute (short-stay) rehabilitation. 4m per day ▼ 15% State avg: 5m per day · National avg: 4m per day
Weekend RN Info Registered nurse hours specifically on weekends. Facilities sometimes reduce RN presence on Saturdays and Sundays — a low weekend RN figure compared to weekday hours can indicate reduced clinical oversight when most administrative staff are absent. 20m per day ▼ 45% State avg: 37m per day · National avg: 29m per day

Capacity and availability

This home usually has availability

Higher occupancy than the Maryland average: 82.4%
Occupancy rate
83.9%
Avg. Length of Stay
112 days
Bed community size
93-bed community Rank #151 / 697Bed count — State benchmarkedThis home is ranked 151st out of 697 homes in Maryland. Shows this facility's certified or reported bed count compared to other Maryland facilities. Larger communities may offer more amenities, programs, and on-site services for residents and families.Rankings are based only on facilities in Maryland that report data for that category. Facilities without available data are excluded from the ranking.Click the rank badge to see the full State ranking.Click here to see the full State ranking.
A larger shared setting that may offer more common spaces and organized community services.
Years in operation
3 years in operation Rank #201 / 208Years in operation — State benchmarkedThis home is ranked 201st out of 208 homes in Maryland. Shows how long this facility has been in operation compared to other Maryland facilities. Longer operating histories may benefit residents, families, and staff.Rankings are based only on facilities in Maryland that report data for that category. Facilities without available data are excluded from the ranking.Click the rank badge to see the full State ranking.Click here to see the full State ranking.
An established community with some operational experience and growing routines.
Walk Score
Walk Score: 36 / 100 Rank #563 / 985Walk Score — State benchmarkedThis home is ranked 563rd out of 985 homes in Maryland. Shows how walkable this facility's neighborhood is compared to the average Walk Score across Maryland facilities. Higher scores benefit residents, families, and staff.Rankings are based only on facilities in Maryland that report data for that category. Facilities without available data are excluded from the ranking.Click the rank badge to see the full State ranking.Click here to see the full State ranking.
Somewhat walkable. A few nearby services may be reachable on foot, but most trips require transportation.
BBB Rating
BBB Rating: A+ (Not Accredited)
An independent rating from the Better Business Bureau based on factors such as complaint history, transparency, and business practices.
How BBB ratings work

About this community

Awards

CMS Five Star Overall
CMS Five Star Quality
Great Place to Work 2025-2026
Striving for Ten
High 5

License Details

CMS Certification Number215052

Safety & Compliance

Hoyer Lift

Therapy & Rehabilitation

3 services
Rehabilitation Services
Respite Care
Short-Term Rehab

Staffing & Medical

1 service
24-Hour Staffing

Additional Services

1 service
Post-Acute Care

Amenities & Lifestyle

Specific ProgramsRehabilitation Program, Orthopedic & Post-Surgical Care, Cardiac Care, Neuro & Stroke Care, Pulmonary Care, Renal Care, Bariatric Care, Psychology/Psychiatric Care

Contact Complete Care at Springbrook

Inspection History

In Maryland, the Department of Health, Office of Health Care Quality is the state agency that conducts unannounced inspections and issues reports for all assisted living and nursing facilities.

Since 2019 · 7 years of data 39 citations

Inspection Scorecard Info This scorecard compares key inspection, citation, and complaint metrics at this facility against the Maryland state average. Metrics rated ≥15% worse than average are highlighted in red; those ≥15% better are highlighted in green.

Since 2019 vs. Maryland state average
Overall vs. MD average 2 Worse Metrics worse than Maryland average:
• Total citations (875% above)
• Citations per year (833% above)
0 Better No metrics in this bucket.
Latest Inspection December 19, 2025 Complaint Investigation

Citations Info Citations are formal regulatory issues recorded during state inspections.

This FacilityMD Averagevs. MD Avg
Total citations Info Formal regulatory issues recorded by inspectors across all inspection types. 394 This facility has 875% more total citations than a typical Maryland nursing home (39 vs. MD avg 4).↑ 875% worse
Citations per year Info Average citations per year since 2019. 5.60.6 This facility has 833% more citations per year than a typical Maryland nursing home (5.6 vs. MD avg 0.6).↑ 833% worse

Inspection Reports Summary Info An editor-reviewed summary of the themes and findings across this facility's recent inspection reports.

  • December 19, 2025 complaint investigation found six deficiencies including an 11% medication error rate, unlabeled insulin pens, broken call light systems, and unsanitary living conditions.
  • March 14, 2025 annual inspection cited three deficiencies for incomplete care plans, medication administration errors, and failure to honor resident food preferences.
  • No immediate jeopardy or fines were issued in any inspection, and some deficiencies from prior years were not repeated in recent surveys.

Health Inspection History

Inspections since 2019
Total health inspections 5

Maryland average 3.9


Last Health inspection on Mar 2025

Total health citations
33

Maryland average 49.9

Citations per inspection
6.6

Maryland average 12.81


Health citations are formal notices following inspections when they fail to comply with safety and care standards.

25 of 33 citations resulted from standard inspections; and 8 of 33 resulted from complaint investigations.

Breakdown of citation severity (last 7 years)
Critical health citations
1
100% worse than Maryland average

Maryland average: 0.5


Serious health citations
0
100% better than Maryland average

Maryland average: 0.6

1 critical citation Maryland average: 0.5

0 serious citations Maryland average: 0.6

30 moderate citations Maryland average: 47.2

2 minor citations Maryland average: 1.7
Citations history (last 7 years)
Nutrition moderate citation Mar 14, 2025
Corrected

Pharmacy moderate citation Mar 14, 2025
Corrected

Care Planning moderate citation Mar 14, 2025
Corrected

Abuse/Neglect moderate citation Dec 18, 2024
Corrected

Staffing Data

Reporting period: October 1 – December 31, 2025 (Q4 2025). Source: CMS Payroll-Based Journal report.

Total staff 127
Employees 115
Contractors 12
Staff to resident ratio 1.53 : 1
16% fewer staff per resident than Maryland average
Maryland average ratio: 1.81 : 1 Maryland average ratio: 1.81 : 1See full Maryland ranking
Avg staff/day 45
Average shift 7.3 hours
9% worse than Maryland average
Maryland average: 8 hours Maryland average shift: 8 hoursSee full Maryland ranking
Total staff hours (quarter) 30,423

Nursing staff breakdown

Q4 2025 · Oct 1 – Dec 31 More info This data comes from the CMS Payroll-Based Journal report covering October 1 – December 31, 2025.
Registered Nurse

Manages medical care and health needs.

RN Staff Info All 5 RN Staff are full-time employees. No contractors work on this role. 5
Average shift length Info Average shift length. Calculated as total hours divided by days worked and average staff per day. 10.1 hours
Licensed Practical Nurse

Assists with medical care and medications.

LPN Staff Info All 24 LPN Staff are full-time employees. No contractors work on this role. 24
Average shift length Info Average shift length. Calculated as total hours divided by days worked and average staff per day. 7.3 hours
Certified Nursing Assistant

Helps with daily care and mobility.

CNA Staff Info All 51 CNA Staff are full-time employees. No contractors work on this role. 51
Average shift length Info Average shift length. Calculated as total hours divided by days worked and average staff per day. 7 hours

Contractor staffing

Q4 2025 · Oct 1 – Dec 31 More info This data comes from the CMS Payroll-Based Journal report covering October 1 – December 31, 2025.

Total hours from contractors

8.3%

2,514 contractor hours this quarter

Physical Therapy Assistant: 4 Speech Language Pathologist: 3 Respiratory Therapy Technician: 2 Qualified Social Worker: 2 Physical Therapy Aide: 1

Staff by category

Q4 2025 · Oct 1 – Dec 31 More info This data comes from the CMS Payroll-Based Journal report covering October 1 – December 31, 2025.
Certified Nursing Assistant5105114,08992100%7
Licensed Practical Nurse240245,98292100%7.3
Clinical Nurse Specialist150152,8558693%8.1
RN Director of Nursing3031,1898592%8.2
Other Dietary Services Staff4041,0529199%7.7
Registered Nurse5051,0028795%10.1
Speech Language Pathologist0338077480%7.5
Physical Therapy Assistant0447257683%6
Nurse Practitioner1016026975%8.7
Respiratory Therapy Technician0225477379%7.3
Administrator1014966267%8
Mental Health Service Worker1014565762%8
Qualified Social Worker0222575257%5
Physical Therapy Aide0111772527%7.1
Occupational Therapy Aide70713544%8
Dietitian2023044%7.5
Other Social Services Staff1012133%7.1
51 Certified Nursing Assistant
% of Days 100%
24 Licensed Practical Nurse
% of Days 100%
15 Clinical Nurse Specialist
% of Days 93%
3 RN Director of Nursing
% of Days 92%
4 Other Dietary Services Staff
% of Days 99%
5 Registered Nurse
% of Days 95%
3 Speech Language Pathologist
% of Days 80%
4 Physical Therapy Assistant
% of Days 83%
1 Nurse Practitioner
% of Days 75%
2 Respiratory Therapy Technician
% of Days 79%
1 Administrator
% of Days 67%
1 Mental Health Service Worker
% of Days 62%
2 Qualified Social Worker
% of Days 57%
1 Physical Therapy Aide
% of Days 27%
7 Occupational Therapy Aide
% of Days 4%
2 Dietitian
% of Days 4%
1 Other Social Services Staff
% of Days 3%

Penalties and fines

Federal penalties imposed by CMS for regulatory violations, including civil money penalties (fines) and denials of payment for new Medicare/Medicaid admissions.

Source: CMS Penalties Database

No penalties in the past 3 years

No civil money penalties or payment denials were reported in the last 3 years.

Quality of care over time

These measures show how residents usually do over time at this home, based on health outcomes and preventive care.

High-risk clinical events score Info A composite score based on pressure ulcers, falls with injury, weight loss, walking ability decline, and activities of daily living decline. 8.4
35% better than Maryland average

Maryland average: 12.9

Functional decline score Info A composite score based on activities of daily living decline, walking ability decline, and incontinence. 19.8
23% better than Maryland average

Maryland average: 25.7

Long-stay resident measures
Significantly above average Maryland avg: 3.7 Info CMS star rating based on long-stay quality measure performance. 5 stars = significantly above average, 1 star = significantly below average.
Need for Help with Daily Activities Increased Info Percent of long-stay residents whose need for help with daily activities has increased 18.9%
20% better than Maryland average

Maryland average: 23.7%

Walking Ability Worsened Info Percent of long-stay residents whose ability to move independently worsened 14.9%
46% better than Maryland average

Maryland average: 27.7%

Low Risk Residents with Bowel/Bladder Incontinence Info Percent of low risk long-stay residents who lose control of their bowels or bladder 25.5%
In line with Maryland average

Maryland average: 25.9%

Falls with Major Injury Info Percent of long-stay residents experiencing one or more falls with major injury 1.5%
35% better than Maryland average

Maryland average: 2.3%

High Risk Residents with Pressure Ulcers Info Percent of long-stay high risk residents with pressure ulcers 3.2%
51% better than Maryland average

Maryland average: 6.5%

Urinary Tract Infection Info Percent of long-stay residents with a urinary tract infection 0.4%
77% better than Maryland average

Maryland average: 1.6%

Lost Too Much Weight Info Percent of long-stay residents who lose too much weight 3.5%
40% better than Maryland average

Maryland average: 5.8%

Depressive Symptoms Info Percent of long-stay residents who have depressive symptoms 70.2%
247% worse than Maryland average

Maryland average: 20.2%

Antipsychotic Use Info Percent of long-stay residents who received an antipsychotic medication 3.0%
77% better than Maryland average

Maryland average: 12.9%

Pneumococcal Vaccine Info Percent of long-stay residents assessed and appropriately given the pneumococcal vaccine 100.0%
9% better than Maryland average

Maryland average: 92.0%

Influenza Vaccine Info Percent of long-stay residents assessed and appropriately given the seasonal influenza vaccine 100.0%
In line with Maryland average

Maryland average: 96.6%

Hospitalizations per 1,000 days Info Number of hospitalizations per 1,000 long-stay resident days. 1.95
48% worse than Maryland average

Maryland average: 1.32

ED visits per 1,000 days Info Number of outpatient emergency department visits per 1,000 long-stay resident days. 0.94
22% better than Maryland average

Maryland average: 1.21

Short-stay resident measures
Above average Maryland avg: 3.7 Info CMS star rating based on short-stay quality measure performance. 5 stars = much above average, 1 star = much below average.
Pneumococcal Vaccine Info Percent of short-stay residents assessed and appropriately given the pneumococcal vaccine 98.0%
25% better than Maryland average

Maryland average: 78.4%

Antipsychotic medication increase Info Percent of short-stay residents who newly received an antipsychotic medication 0.7%
50% better than Maryland average

Maryland average: 1.4%

Influenza Vaccine Info Percent of short-stay residents assessed and appropriately given the seasonal influenza vaccine 100.0%
24% better than Maryland average

Maryland average: 80.6%

Re-hospitalized after SNF stay Info Percentage of short-stay residents who were re-hospitalized after their nursing home admission. 27.9%
32% worse than Maryland average

Maryland average: 21.2%

Emergency department visits Info Percentage of short-stay residents who had an outpatient emergency department visit. 8.3%
16% better than Maryland average

Maryland average: 9.9%

Falls with major injury Info Percentage of SNF residents who experience falls with major injury during their stay. 0.0%
100% better than Maryland average

Maryland average: 0.8%

Ability to care for self at discharge Info Percentage of residents at or above expected ability to care for themselves at discharge. 65.7%
22% better than Maryland average

Maryland average: 53.7%

Successful return to home or community Info Rate of successful return to home or community from a skilled nursing facility. 54.4%
7% better than Maryland average

Maryland average: 50.6%

Breakdown by payment type

Medicare

51% of new residents, usually for short-term rehab.

Typical stay 1 - 2 months

Private pay

32% of new residents, often for short stays.

Typical stay 1 months

Medicaid

18% of new residents, often for long-term daily care.

Typical stay 1 years

Facility Characteristics

Source: CMS Long-Term Care Facility Characteristics (Data as of Jan 2026)

Total residents 83
Medicare
15
18.1% of residents
Medicaid
53
63.9% of residents
Private pay or other
15
18.1% of residents
Programs & Services
Residents Group

Residents meet regularly to discuss policies, care quality, and activities

Active Resident Council

Organized group of residents that meets regularly to discuss facility policies, quality of life, and activities.

Finances and operations

Based on CMS SNF Cost Report for fiscal year ending in 12/2023.

For-profit
Operated by a single business entity.
Net patient revenue Info Net patient revenue — what the home actually collects for resident care, after contractual allowances, bad debt and discounts are subtracted from its gross charges (CMS cost report, Worksheet G-3). It covers resident care only; money the home earns from other sources is shown separately as "Other income."
$10.6M
Net patient income Info Net patient income: net patient revenue minus the home's total operating expenses. A positive figure means it earns more from resident care than it spends to deliver it; a negative figure means the opposite. It excludes non-operating "other income."
-$1.8M
For-profit Operated by a single business entity.
Net patient revenue Info Net patient revenue — what the home actually collects for resident care, after contractual allowances, bad debt and discounts are subtracted from its gross charges (CMS cost report, Worksheet G-3). It covers resident care only; money the home earns from other sources is shown separately as "Other income."
$10.6M
Net patient income Info Net patient income: net patient revenue minus the home's total operating expenses. A positive figure means it earns more from resident care than it spends to deliver it; a negative figure means the opposite. It excludes non-operating "other income."
-$1.8M
Other income Info Money the home earns outside of resident care — such as investments, grants, rentals and other non-operating sources (CMS cost report, Worksheet G-3). It is tracked separately from net patient revenue: it is not part of that figure, and it is not included in net patient income.
$125.2K
Payroll costs Info Staff salaries plus wage-related costs — benefits such as payroll taxes, health insurance and retirement — from the home's own accounting records (CMS cost report, Worksheet A). Contract or agency labor is counted separately, under other operating costs.
$4.8M 45.1% of net patient revenue Info Payroll as a share of revenue: staff salaries and wage-related benefits divided by net patient revenue. A higher figure means more of each revenue dollar goes to staff pay.
Other operating costs Info Everything it costs to run the home apart from payroll — food, utilities, supplies, maintenance, contract labor and administration. Calculated as total operating expense minus payroll (staff salaries and wage-related benefits).
$7.7M
Total costs Info The home's total operating expense for the year — all the costs of running it, salaries included (CMS cost report, Worksheet G-3).
$12.4M

Who this home usually serves

TYPE OF STAY

Mostly short-term rehab stays

Most residents typically stay for a few weeks or months before returning home or moving on.

Most new residents arrive under Medicare (51% of admissions), and a typical Medicare stay runs around 1 - 2 months.

Admissions
257 total

Coverage residents most often arrive under.

Medicare 51%
Private pay 32%
Medicaid 18%
Discharges
244 total

Coverage residents most often leave under.

Medicare 38%
Private pay 36%
Medicaid 26%

Managed by Lnha Oludapo Raphael Eludoyin

Administrator

Oludapo Raphael Eludoyin, LNHA, serves as the Administrator at Complete Care at Springbrook. He leads the community with a focus on establishing strong relationships with residents and maintaining a dedicated, long-tenured staff committed to excellence in care.

Places of interest near Complete Care at Springbrook

Address 5.9 miles from city center Info Estimated distance in miles from Silver Spring's city center to Complete Care at Springbrook's address, calculated via Google Maps. — 6.22 miles to nearest hospital (UM Laurel Medical Center)

Calculate Travel Distance to Complete Care at Springbrook

Add your location

Address

Compare Nursing Homes around Silver Spring

The information below is reported by the Maryland Department of Health, Office of Health Care Quality.

5 facilities compared · CMS & MD Dept. of Health data

Bedford Court, a CCRC
NH
AL
HC
IL
MC
RC
Silver Spring (International Drive)
76
Facility 76
MD AVG 43
Rank #184 / 697
76.5% -7%4.81 -36%+27%$0237.7-43-
64
Facility 64
MD AVG 43
Rank #261 / 985
Welltower Opco Group LLC$23.1M$10.0M43.1%215246
Complete Care at Springbrook
NH
HC
PC
RC
Silver Spring
93
Facility 93
MD AVG 43
Rank #151 / 697
83.9% +2%2.77 -72%-27%$0336.6184A+
36
Facility 36
MD AVG 43
Rank #563 / 985
-$10.6M$4.8M45.1%215052
Althea Woodland Nursing Home
NH
HC
MC
RC
Silver Spring (Montgomery Knolls)
50
Facility 50
MD AVG 43
Rank #225 / 697
91.7% +11%3.79 -3%0%$0297.3-48-
12
Facility 12
MD AVG 43
Rank #802 / 985
Toni Meyer$6.3M$2.5M40.3%215228
Autumn Lake Healthcare at Silver Spring
NH
NC
PC
RC
Silver Spring
148
Facility 148
MD AVG 43
Rank #47 / 697
93.4% +13%3.51 +10%-7%$0
35
Facility 35
MD AVG 49.9
Rank #56 / 149
7.0-137-
16
Facility 16
MD AVG 43
Rank #772 / 985
2501 Musgrove Road Holdco LLC$10.8M$914.7k8.4%215224
Bel Pre Healthcare Center
NH
HC
MC
RC
Silver Spring (Bel Pre Road)
100
Facility 100
MD AVG 43
Rank #117 / 697
93.7% +14%4.36 +78%+16%$48.5k
55
Facility 55
MD AVG 49.9
Rank #101 / 149
13.8175F
52
Facility 52
MD AVG 43
Rank #402 / 985
Option Holdings II LLC$11.1M$5.4M
48.3%
Facility 48.3%
MD AVG 38.5%
Rank #99 / 148
215065

Financial Assistance for
Nursing Home in Maryland

Complete Care at Springbrook is located in Silver Spring, Maryland.
Here are the financial assistance programs available to residents in Maryland.

Get Financial aid guidance

Community Options Waiver

Maryland Medicaid Community Options Waiver

Age 65+ or disabled
General Maryland resident, Medicaid- eligible, nursing home-level care need.
Income Limits (2025) ~$2,829/month 300% FBR, individual
Asset Limits $2,000 (individual), $3,000 (couple) (excludes home, car).
MD

High urban demand; rural outreach efforts.

Benefits
Personal care (5-7 hours/day, e.g., bathing, dressing) Respite care (up to 240 hours/year) Adult day care ($70/day) Home modifications ($1,500 avg.)

Senior Care Program

Maryland Senior Care

Age 65+
General Maryland resident, at risk of nursing home placement.
Income Limits ~$2,000/month individual, varies by county
Asset Limits $11,000 individual
MD

Limited funding; waitlists common in high-demand areas.

Benefits
In-home care (3-5 hours/week) Respite care (up to 10 days/year) Meals (~$6/meal) Transportation (~5 trips/month) Case management

Maryland Nursing Home Medicaid

Maryland Medical Assistance (Medicaid) Nursing Home Program

Age 65+
General Maryland resident, Medicaid-eligible, requires nursing home-level care.
Income Limits (2025) $943/month (individual); most income applied to care costs.
Asset Limits $2,500 (individual), $3,000 (couple); spousal protections up to $155,356.
MD

Home equity limit $636,000; estate recovery applies post-55.

Benefits
24/7 nursing care Meals Therapy Medications (unlimited per medical need)

Senior Assisted Living Subsidy Program

Maryland Senior Assisted Living Group Home Subsidy

Age 62+
General Maryland resident, in or moving to approved assisted living, low/moderate income.
Income Limits (2025) ~$34,000/year individual, varies by county
Asset Limits Not strict; prioritizes low-income.
MD

Not available statewide; facility must be licensed by MDH.

Benefits
Personal care Meals 24-hour supervision (up to $1,500/month subsidy typical)

Veterans Aid and Attendance (A&A) Benefit

Maryland VA Aid and Attendance

Age
General Wartime veteran/spouse, age 65+ or disabled, needs ADL help, Maryland resident.
Income Limits (2025) Net income minus medical expenses < $1,984/month individual with A&A
Asset Limits $155,356 net worth limit
MD

High veteran population in suburban/rural areas.

Benefits
Cash benefit ($1,478-$2,471/month, varies by status) for care costs

Senior Prescription Drug Assistance Program (SPDAP)

Maryland Senior Prescription Drug Assistance Program

Age 65+
General Maryland resident (6+ months), Medicare Part D enrolled.
Income Limits (2025) $48,560/year individual, 300% FPL
Asset Limits None specified.
MD

Supplements Medicare Part D; annual enrollment required.

Benefits
Up to $40/month premium subsidy Reducing drug costs

Medicare Savings Programs (MSP)

Maryland Medicare Savings Programs

Age 65+
General Maryland resident, Medicare Part A/B enrollee.
Income Limits (2025) $2,014/month (QMB), $2,706/month (SLMB/QI, individual).
Asset Limits $9,090 (individual), $13,630 (couple).
MD

Includes QMB, SLMB, QI categories.

Benefits
Covers premiums (up to $174.70/month Part B) Co-pays Deductibles

Community Personal Assistance Services (CPAS)

Maryland Medicaid Community Personal Assistance Services

Age 65+
General Maryland resident, Medicaid-eligible, needs ADL assistance.
Income Limits (2025) $943/month (individual); spend-down available.
Asset Limits $2,500 (individual), $3,000 (couple).
MD

Consumer-directed option allows hiring family caregivers.

Benefits
Personal care (hours vary, typically 20-30/week) Chores Nurse supervision

Frequently Asked Questions about Complete Care at Springbrook

Is Complete Care at Springbrook in a walkable area?

Complete Care at Springbrook has a walk score of 36. Somewhat walkable. A few nearby services may be reachable on foot, but most trips require transportation.

What is the occupancy rate at Complete Care at Springbrook?

Complete Care at Springbrook's occupancy is 87.6%.

Does Complete Care at Springbrook operate as a for-profit or non-profit?

Complete Care at Springbrook is registered as a for-profit in MD.

Are there photos of Complete Care at Springbrook?

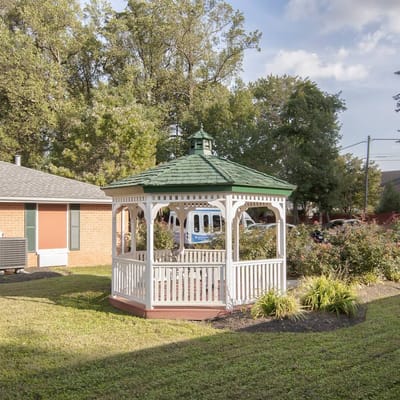
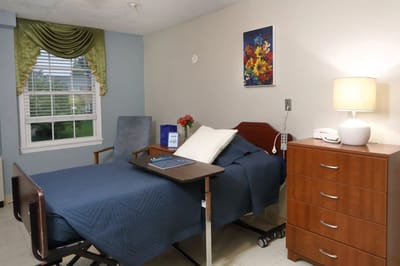
Yes — there are 6 photos of Complete Care at Springbrook in the photo gallery on this page.

What is the address of Complete Care at Springbrook?

Complete Care at Springbrook is located at 12325 New Hampshire Ave, Silver Spring, MD 20904.

What is the phone number of Complete Care at Springbrook?

(301) 622-4600 will put you in contact with the team at Complete Care at Springbrook.

Is Complete Care at Springbrook Medicare or Medicaid certified?

Yes — Complete Care at Springbrook is a CMS-certified provider of Medicare and Medicaid.

Guides for Better Senior Living

Care Cost Calculator: See Prices in Your Area

Nursing Home Data Explorer

Don’t Wait Too Long: 7 Red Flag Signs Your Parent Needs Assisted Living Now

The True Cost of Assisted Living in 2025 – And How Families Are Paying For It

Understanding Senior Living Costs: Pricing Models, Discounts & Financial Assistance