


Total health inspections
4
State average N/A
Last Health inspection on Mar 2025
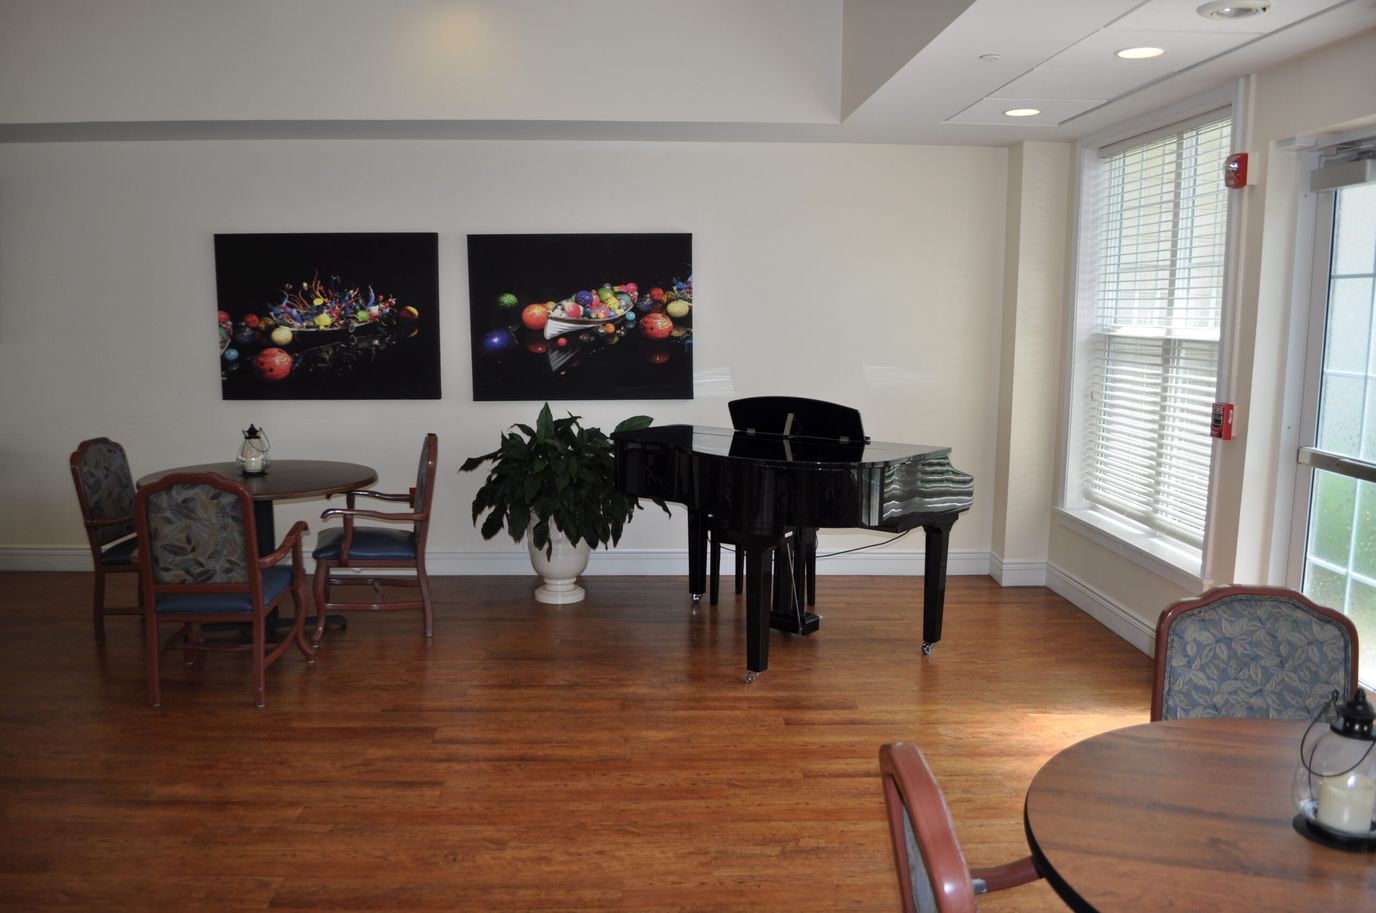
A 68-bed nursing home in Solomons, Maryland, Hermitage at St. John’s Creek is on the western shore of Chesapeake Bay. Operating for 31 years, the community is owned by Hermisol Holdco LLC and welcomes Medicare, Medicaid, and private pay. It’s then accessible to families with different coverage options. The home is geared toward short-term rehabilitation, with on-site therapy services and a doctor on staff. This makes it a practical choice for someone recuperating from surgery, illness, or hospitalization who needs structured clinical support alongside nursing care. The average stay is about 103 days, indicating post-acute rehab residents and those shifting to longer-term placement. With 3 hours and 22 minutes of total nursing care per resident day, attentive support is built into the daily routine.
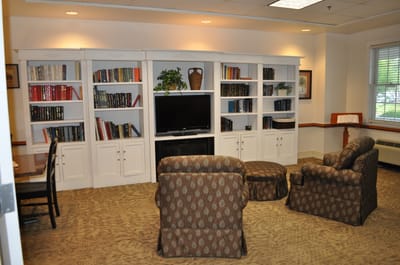
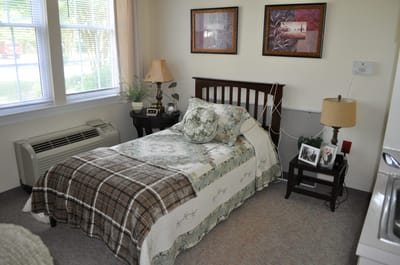
Daily structure centers on the restaurant-style dining room, where residents eat three balanced meals daily, and the activities program, which runs full-time all week with dedicated activity staff. The facility maintains 24-hour staffing and 24-hour visiting hours, so families can visit anytime. Residents can personalize their private rooms with individual climate control and utilize in-room kitchenettes. Common areas include amenities like complimentary Wi-Fi and cable television. Snacks are available all the time, and housekeeping service is daily. Transportation is arranged for residents who need to travel for appointments or other needs. The facility is set in Solomons, which scores 42 out of 100 for walkability. Though most outings require transportation, some nearby services are reachable on foot. The home maintains a secure, locked facility and spotlights its home-like atmosphere throughout. With an on-call maintenance team available 24/7, the everyday environment is designed to feel supported and stable.
| Staff type | Hours / Day / Resident | vs state avg |
|---|---|---|
|
Registered Nurse (RN)
| 39m per day | |
|
LPN / LVN
| 43m per day | |
|
Nurse Aide
| 2h 16m per day | |
|
Weekend Total Nursing
| 3h 11m per day | |
|
Physical Therapist
| 3m per day | |
|
Weekend RN
| 21m per day |
State average N/A
Last Health inspection on Mar 2025
State average N/A
State average N/A
Health citations are formal notices following inspections when they fail to comply with safety and care standards.
17 of 31 citations resulted from standard inspections; 10 of 31 resulted from complaint investigations; and 4 of 31 came from combined inspections (standard and complaint).
State average: N/A
State average: N/A
Reporting period: October 1 – December 31, 2025 (Q4 2025). Source: CMS Payroll-Based Journal report.
State average ratio: 0 : 0
State average: 0 hours
Manages medical care and health needs.
Assists with medical care and medications.
Helps with daily care and mobility.
Total hours from contractors
1,797 contractor hours this quarter
| Certified Nursing Assistant | 58 | 18 | 76 | 18,838 | 92 | 100% | 8.2 |
| Licensed Practical Nurse | 16 | 19 | 35 | 5,952 | 92 | 100% | 8.3 |
| Registered Nurse | 11 | 14 | 25 | 3,593 | 92 | 100% | 8.7 |
| Clinical Nurse Specialist | 4 | 0 | 4 | 1,347 | 73 | 79% | 7.7 |
| Other Dietary Services Staff | 4 | 0 | 4 | 1,315 | 92 | 100% | 7 |
| Physical Therapy Assistant | 5 | 0 | 5 | 1,256 | 73 | 79% | 7.1 |
| Dietitian | 2 | 0 | 2 | 872 | 65 | 71% | 7.3 |
| Speech Language Pathologist | 3 | 0 | 3 | 840 | 67 | 73% | 6.7 |
| Mental Health Service Worker | 3 | 0 | 3 | 552 | 71 | 77% | 4.4 |
| Physical Therapy Aide | 2 | 0 | 2 | 489 | 65 | 71% | 7.3 |
| Respiratory Therapy Technician | 3 | 0 | 3 | 473 | 71 | 77% | 6.7 |
| Administrator | 1 | 0 | 1 | 470 | 64 | 70% | 7.3 |
| Nurse Practitioner | 1 | 0 | 1 | 450 | 62 | 67% | 7.3 |
| Qualified Social Worker | 1 | 0 | 1 | 401 | 63 | 68% | 6.4 |
| Medical Director | 0 | 1 | 1 | 54 | 27 | 29% | 2 |
Includes penalties issued in 2023-2024
Federal penalties imposed by CMS for regulatory violations, including civil money penalties (fines) and denials of payment for new Medicare/Medicaid admissions.
Source: CMS Penalties Database (Data as of Jan 2026)
State average: $61K
State average: 1.5
State average: 0.1
Penalties are imposed by CMS for violations of federal nursing home regulations.
7 penalties in the past 3 years
Multiple penalties were reported in the last 3 years.
Last updated: Jan 2026
These measures show how residents usually do over time at this home, based on health outcomes and preventive care.
State average: 12.9
State average: 25.7
State average: 23.7%
State average: 27.7%
State average: 25.9%
State average: 2.3%
State average: 6.5%
State average: 1.6%
State average: 5.8%
State average: 20.2%
State average: 12.9%
State average: 92.0%
State average: 96.6%
State average: 78.4%
State average: 1.4%
State average: 80.6%
Quality measures are calculated from Minimum Data Set (MDS) assessments. For most measures, lower percentages indicate better care quality.
90% of new residents, usually for short-term rehab.
9% of new residents, often for short stays.
1% of new residents, often for long-term daily care.
Source: CMS Long-Term Care Facility Characteristics (Data as of Jan 2026)
Residents meet regularly to discuss policies, care quality, and activities
Family members meet regularly to discuss policies, care quality, and activities
Organized group of family members that meets regularly to discuss facility policies, resident care, and activities.
Organized group of residents that meets regularly to discuss facility policies, quality of life, and activities.
Data sourced from CMS Long-Term Care Facility Characteristics quarterly report. Payer mix reflects the current resident census by primary payment source.
Historical financial and operational data for Hermitage at St. John’s Creek from 2011–2023, based on CMS SNF Cost Reports.
Key figures below are for fiscal year ending in 12/2023.
Based on CMS SNF Cost Report for fiscal year ending in 12/2023.
Most residents typically stay for a few weeks or months before returning home or moving on.
Most new residents arrive under Medicare (90% of admissions), and a typical Medicare stay runs around 1 - 2 months.
Coverage residents most often arrive under.
Coverage residents most often leave under.
![]() 0.7 miles from city center
0.7 miles from city center
![]() Estimated distance in miles from Solomons's city center to Hermitage at St. John’s Creek's address, calculated via Google Maps.
Estimated distance in miles from Solomons's city center to Hermitage at St. John’s Creek's address, calculated via Google Maps.
Add your location
The information below is reported by the Maryland Department of Health, Office of Health Care Quality.
| Sterling Care Hillhaven Assisted Living and Memory Care | NH AL HOS MC SNF | Adelphi (Knollwood) | - | 66 | - | 25 | Studio / 1 Bed |
| Lutheran Village at Miller’s Grant | NH AL IL SNF | Ellicott City (Lutheran Village At Miller’s Grant) | - | 36 | - | 19 | 1 Bed / 2 Bed |
| Hermitage at St. John’s Creek | NH AL HOS PC RC SNF | Solomons | - | 68 | - | 42 | - |
| HeartLands Senior Living at Ellicott City | NH AL IL | Ellicott City (Plum Tree) | - | 182 | - | 14 | Studio / 1 Bed / 2 Bed |
| Brooke Grove Retirement Village | NH AL IL MC RC SNF | Sandy Spring | - | 190 | A+ | 7 | Private Rooms |
Hermitage at St. John’s Creek has a walk score of 42. Somewhat walkable. A few nearby services may be reachable on foot, but most trips require transportation.
Hermitage at St. John’s Creek's occupancy is 94.1%.
Hermitage at St. John’s Creek is registered as a for-profit in MD.
Hermitage at St. John’s Creek has 68 beds.
Yes — there are 3 photos of Hermitage at St. John’s Creek in the photo gallery on this page.
Hermitage at St. John’s Creek is located at 13325 Dowell Road, Solomons, MD 20688.
(410) 326-0070 will put you in contact with the team at Hermitage at St. John’s Creek.
Care Cost Calculator: See Prices in Your Area
Nursing Home Data Explorer
Don’t Wait Too Long: 7 Red Flag Signs Your Parent Needs Assisted Living Now
The True Cost of Assisted Living in 2025 – And How Families Are Paying For It
Understanding Senior Living Costs: Pricing Models, Discounts & Financial Assistance


