Trinity Community at Beavercreek
Nursing Home · Ohio, OH
CMS overall rating Info The Overall CMS Rating is scored from 1 to 5 stars and combines results from health inspections, staffing levels, and quality measures. Health inspections carry the most weight. Staffing and quality scores can increase or decrease the final rating based on performance compared to state and national standards.

Trinity Community at Beavercreek

Nursing Home · Ohio, OH
CMS overall rating Info The Overall CMS Rating is scored from 1 to 5 stars and combines results from health inspections, staffing levels, and quality measures. Health inspections carry the most weight. Staffing and quality scores can increase or decrease the final rating based on performance compared to state and national standards.
Calculator: See prices in your area
Trinity Community at Beavercreek accepts Medicare, Medicaid, and private pay.

Overview of Trinity Community at Beavercreek

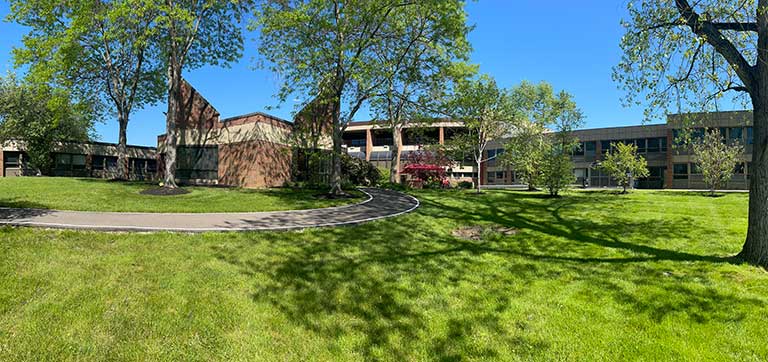
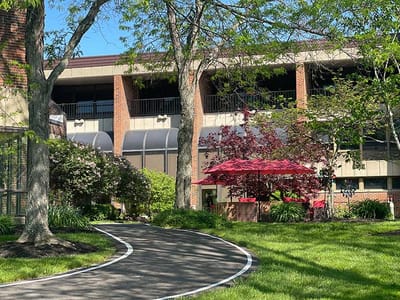
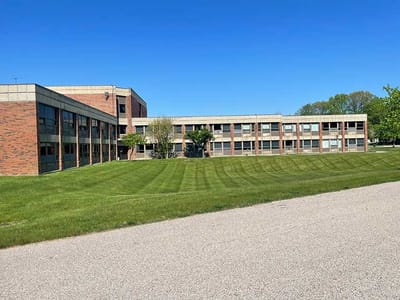
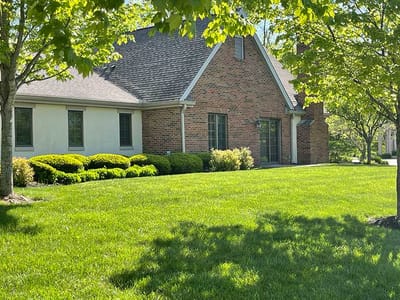
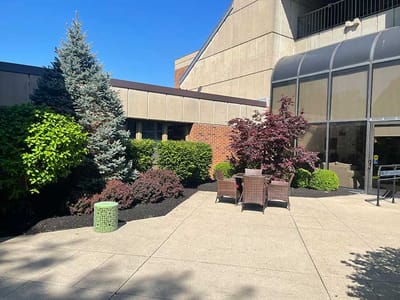
The Trinity Community at Beavercreek is a senior living community in Beavercreek, Ohio. It offers independent living, assisted living, memory care, fast track rehab, and skilled nursing services. The community is known for its vibrant atmosphere and commitment to quality care.
(937) 426-8481

Quality ratings

Measured by Centers for Medicare & Medicaid Services (CMS)

Overall rating Info The Overall CMS Rating combines results from health inspections, staffing levels and quality measures. Health inspections carry the most weight. Staffing and quality scores can increase or decrease the final rating based on performance compared to state and national standards.
▼ 11.8% Below OH avg. ▼ 11.8% Below OH avg.Click the badge to see the full State ranking.Click here to see the full State ranking.
Health Inspection Info Based on the results of the facility's three most recent standard inspections and any complaint investigations. CMS reviews the number, scope, and severity of deficiencies, with more recent findings weighted more heavily.
▼ 30.6% Below OH avg. ▼ 30.6% Below OH avg.Click the badge to see the full State ranking.Click here to see the full State ranking.
Staffing Info Measures average nursing staff hours per resident per day, including Registered Nurses (RNs) and total nursing staff. Ratings are adjusted based on the level of care residents require and are compared to state and national benchmarks.
▲ 5.3% Above OH avg. ▲ 5.3% Above OH avg.Click the badge to see the full State ranking.Click here to see the full State ranking.
Quality Measures Info Based on clinical and physical health indicators reported to CMS, such as hospital readmissions, falls, pressure ulcers, and improvements in mobility. These measures reflect how well residents' health needs are being managed.
▲ 13.1% Above OH avg. ▲ 13.1% Above OH avg.Click the badge to see the full State ranking.Click here to see the full State ranking.

Staffing hours breakdown

Info Daily nursing hours per resident by staff type, reported to CMS. Higher is generally better — compare this facility to state and national averages to see where staffing stands.

Hours per resident per day — compared to Ohio state averages

Total nursing care / resident Info This home is ranked 53rd out of 203 homes in Ohio. Total adjusted nursing hours per resident per day, combining RN, LPN, and aide time. CMS adjusts this for case-mix so facilities can be fairly compared.
3h 51m per day
Rank #53 / 203Nurse hours — State benchmarkedThis home is ranked 53rd out of 203 homes in Ohio. Shows adjusted nurse hours per resident per day benchmarked to the Ohio average, with a ranking across 203 Ohio SNFs. More hours mean more direct care. The national average is about 3.5 hrs; below 3.0 is a red flag.Click the rank badge to see the full State ranking.Click here to see the full State ranking.
This facility Ohio avg (3h 50m per day)
vs Ohio avg
+0%
Staff typeHours / Day / Residentvs state avg
Weekend Total Nursing Info Combined nursing hours (RN + LPN + Nurse Aide) per resident per day on weekends. Staffing often drops on weekends — this figure reveals whether the facility maintains adequate coverage outside of weekday hours. 3h 44m per day

Capacity and availability

Avg. Length of Stay
62 days
Bed community size
83-bed community Rank #143 / 330Bed count — State benchmarkedThis home is ranked 143rd out of 330 homes in Ohio. Shows this facility's certified or reported bed count compared to other Ohio SNFs. Larger communities may offer more amenities, programs, and on-site services for residents and families.Click the rank badge to see the full State ranking.Click here to see the full State ranking.
A larger shared setting that may offer more common spaces and organized community services.
Walk Score
Walk Score: 2 / 100 Rank #669 / 706Walk Score — State benchmarkedThis home is ranked 669th out of 706 homes in Ohio. Shows how walkable this facility's neighborhood is compared to the average Walk Score across Ohio SNFs. Higher scores benefit residents, families, and staff.Click the rank badge to see the full State ranking.Click here to see the full State ranking.
Car-dependent. Most errands require a car, with limited nearby walkable options.

About this community

Occupancy

Occupancy rate
84%
Rank #97 / 204Occupancy rate — State benchmarkedThis home is ranked 97th out of 204 homes in Ohio. Shows this facility's occupancy rate versus the Ohio average, with its Statewide rank out of 204. Higher occupancy signals strong local demand and financial stability.Click the rank badge to see the full State ranking.Click here to see the full State ranking.
Higher than the Ohio average: 78.7%
Occupied beds
69 / 83
Average occupied beds in Ohio homes 72 beds

License Details

Facility TypeResidential Care Facility
StatusActive
CountyGreene
CMS Certification Number365777

Therapy & Rehabilitation

2 services
Rehabilitation Services
Respite Care

Staffing & Medical

1 service
24-Hour Staffing

Contact Information

Fax(937) 426-3043

Amenities & Lifestyle

Beautiful Campus With Plentiful Green Spaces And Walking Trails
Jack Nicklaus Putting Green
Gazebos And Grills
Private Dining Room For Families Of Residents
Transportation Assistance For Medical Appointments
Music & Memory Program
Opening Minds Through Art Program
Small-Pet Friendly
Sagecare Certified To Meet The Needs Of Lgbtq+ Older Adults
Specific ProgramsFast Track Rehab

Contact Trinity Community at Beavercreek

Inspection History

In Ohio, the Department of Health, Bureau of Survey and Certification conducts unannounced onsite inspections to evaluate the quality of care and environment in all licensed facilities.

Inspection Scorecard Info This scorecard compares key inspection, citation, and complaint metrics at this facility against the Ohio state average. Metrics rated ≥15% worse than average are highlighted in red; those ≥15% better are highlighted in green.

Overall vs. OH average 1 Worse Metrics worse than Ohio average:
• Total citations (50% above)
0 Better No metrics in this bucket.
Latest Inspection April 3, 2025

Citations Info Citations are formal regulatory issues recorded during state inspections.

This FacilityOH Averagevs. OH Avg
Total citations Info Formal regulatory issues recorded by inspectors across all inspection types. 32 This facility has 50% more total citations than a typical Ohio nursing home (3 vs. OH avg 2).↑ 50% worse

Health Inspection History

Inspections since 2019
Total health inspections 6

Ohio average 6.7


Last Health inspection on Apr 2025

Total health citations
31 Rank #115 / 203Health citations — State benchmarkedThis home is ranked 115th out of 203 homes in Ohio. Shows this facility's total health deficiency citations benchmarked to the Ohio State average, with a ranking across all 203 OH SNFs. Lower citation counts earn a better rank.Click the rank badge to see the full State ranking.Click here to see the full State ranking.

Ohio average 30.9

Citations per inspection
5.17 Rank #155 / 203Citations per inspection — State benchmarkedThis home is ranked 155th out of 203 homes in Ohio. Shows average deficiency citations per CMS inspection for this facility versus the Ohio mean across 203 SNFs with citation data. Lower is better.Click the rank badge to see the full State ranking.Click here to see the full State ranking.

Ohio average 4.59


Health citations are formal notices following inspections when they fail to comply with safety and care standards.

27 of 31 citations resulted from standard inspections; and 4 of 31 resulted from complaint investigations.

Breakdown of citation severity (last 7 years)
Critical health citations
1
233% worse than Ohio average

Ohio average: 0.3


Serious health citations
1
11% worse than Ohio average

Ohio average: 0.9

1 critical citation Ohio average: 0.3

1 serious citation Ohio average: 0.9

29 moderate citations Ohio average: 29

0 minor citations Ohio average: 0.7
Citations history (last 7 years)
Nutrition moderate citation Apr 03, 2025
Corrected

Nutrition moderate citation Apr 03, 2025
Corrected

Quality of Care moderate citation Apr 03, 2025
Corrected

Care Planning moderate citation Apr 03, 2025
Corrected

Staffing Data

Reporting period: October 1 – December 31, 2025 (Q4 2025). Source: CMS Payroll-Based Journal report.

Total staff 152
Employees 129
Contractors 23
Staff to resident ratio 1.85:1
9% worse than Ohio average
Ohio average ratio: 2.04:1 Ohio average ratio: 2.04:1See full Ohio ranking
Avg staff/day 53
Average shift 7.4 hours
9% worse than Ohio average
Ohio average: 8.1 hours Ohio average shift: 8.1 hoursSee full Ohio ranking
Total staff hours (quarter) 36,151

Nursing staff breakdown

Q4 2025 · Oct 1 – Dec 31 More info This data comes from the CMS Payroll-Based Journal report covering October 1 – December 31, 2025.
Registered Nurse

Manages medical care and health needs.

RN Staff 12
Average shift length Info Average shift length. Calculated as total hours divided by days worked and average staff per day. 9 hours

No contractors work on this role.

Licensed Practical Nurse

Assists with medical care and medications.

LPN Staff 26
Average shift length Info Average shift length. Calculated as total hours divided by days worked and average staff per day. 8.6 hours

No contractors work on this role.

Certified Nursing Assistant

Helps with daily care and mobility.

CNA Staff 67
Average shift length Info Average shift length. Calculated as total hours divided by days worked and average staff per day. 7.2 hours

No contractors work on this role.

Contractor staffing

Q4 2025 · Oct 1 – Dec 31 More info This data comes from the CMS Payroll-Based Journal report covering October 1 – December 31, 2025.

Total hours from contractors

10.3%

3,710 contractor hours this quarter

Physical Therapy Aide: 6 Speech Language Pathologist: 6 Respiratory Therapy Technician: 4 Physical Therapy Assistant: 3 Qualified Social Worker: 2 Occupational Therapy Aide: 1 Medical Director: 1

Staff by category

Q4 2025 · Oct 1 – Dec 31 More info This data comes from the CMS Payroll-Based Journal report covering October 1 – December 31, 2025.
Certified Nursing Assistant6706716,15092100%7.2
Licensed Practical Nurse260266,90592100%8.6
Registered Nurse120122,94992100%9
Other Dietary Services Staff8082,36792100%7.1
Physical Therapy Aide0661,5126773%6.6
Speech Language Pathologist0661,0587278%6
RN Director of Nursing2029286368%8
Medication Aide/Technician3038677177%9.6
Nurse Practitioner2025046065%8
Administrator1014245459%7.9
Dental Services Staff1014235257%8.1
Qualified Social Worker0223606267%5.1
Clinical Nurse Specialist1013554549%7.9
Occupational Therapy Aide1123144043%7.3
Respiratory Therapy Technician0443037582%3.6
Physical Therapy Assistant0332497177%3.5
Medical Director0112082628%8
Qualified Activities Professional1011552022%7.8
Nurse Aide in Training4041211820%6.3
67 Certified Nursing Assistant
% of Days 100%
26 Licensed Practical Nurse
% of Days 100%
12 Registered Nurse
% of Days 100%
8 Other Dietary Services Staff
% of Days 100%
6 Physical Therapy Aide
% of Days 73%
6 Speech Language Pathologist
% of Days 78%
2 RN Director of Nursing
% of Days 68%
3 Medication Aide/Technician
% of Days 77%
2 Nurse Practitioner
% of Days 65%
1 Administrator
% of Days 59%
1 Dental Services Staff
% of Days 57%
2 Qualified Social Worker
% of Days 67%
1 Clinical Nurse Specialist
% of Days 49%
2 Occupational Therapy Aide
% of Days 43%
4 Respiratory Therapy Technician
% of Days 82%
3 Physical Therapy Assistant
% of Days 77%
1 Medical Director
% of Days 28%
1 Qualified Activities Professional
% of Days 22%
4 Nurse Aide in Training
% of Days 20%

Penalties and fines

Includes penalties issued in 2024

Federal penalties imposed by CMS for regulatory violations, including civil money penalties (fines) and denials of payment for new Medicare/Medicaid admissions.

Source: CMS Penalties Database (Data as of Jan 2026)

Total fines amount $24K Rank #156 / 203Federal fines — State benchmarkedThis home is ranked 156th out of 203 homes in Ohio. Shows this facility's cumulative CMS federal fine dollars versus the Ohio average among facilities with fines, and where it ranks among 203 skilled nursing facilities in the pool. Lower total dollars mean a better rank.Click the rank badge to see the full State ranking.Click here to see the full State ranking.
64% lower than Ohio average

Ohio average: $69K

Number of fines 2
8% more fines than Ohio average

Ohio average: 1.9

Payment Denials Info Serious action where Medicare and/or Medicaid temporarily stops payments for new residents until issues are fixed. 0
100% fewer payment denials than Ohio average

Ohio average: 0.5

Fines amount comparison
This facility $24K
Ohio average $69K
Penalty History

Penalties are imposed by CMS for violations of federal nursing home regulations.

1 penalty in the past 3 years

Apr 18, 2024 · $10K

Civil Money Penalty Info Fines imposed for noncompliance, which can be assessed per day or per instance of violation. Apr 18, 2024
$10K

Last updated: Jan 2026

Quality of care over time

These measures show how residents usually do over time at this home, based on health outcomes and preventive care.

High-risk clinical events score Info A composite score based on pressure ulcers, falls with injury, weight loss, walking ability decline, and activities of daily living decline. 7.5
29% worse than Ohio average

Ohio average: 5.8

Functional decline score Info A composite score based on activities of daily living decline, walking ability decline, and incontinence. 11.5
10% better than Ohio average

Ohio average: 12.7

Long-stay resident measures
Need for Help with Daily Activities Increased Info Percent of long-stay residents whose need for help with daily activities has increased 10.5%
53% worse than Ohio average

Ohio average: 6.8%

Walking Ability Worsened Info Percent of long-stay residents whose ability to move independently worsened 11.3%
27% worse than Ohio average

Ohio average: 8.9%

Low Risk Residents with Bowel/Bladder Incontinence Info Percent of low risk long-stay residents who lose control of their bowels or bladder 12.5%
43% better than Ohio average

Ohio average: 22.0%

Falls with Major Injury Info Percent of long-stay residents experiencing one or more falls with major injury 5.0%
47% worse than Ohio average

Ohio average: 3.4%

High Risk Residents with Pressure Ulcers Info Percent of long-stay high risk residents with pressure ulcers 4.1%
6% worse than Ohio average

Ohio average: 3.9%

Urinary Tract Infection Info Percent of long-stay residents with a urinary tract infection 0.8%
43% worse than Ohio average

Ohio average: 0.5%

Lost Too Much Weight Info Percent of long-stay residents who lose too much weight 6.5%
5% worse than Ohio average

Ohio average: 6.2%

Depressive Symptoms Info Percent of long-stay residents who have depressive symptoms 6.5%
73% better than Ohio average

Ohio average: 24.0%

Antipsychotic Use Info Percent of long-stay residents who received an antipsychotic medication 9.6%
13% worse than Ohio average

Ohio average: 8.4%

Pneumococcal Vaccine Info Percent of long-stay residents assessed and appropriately given the pneumococcal vaccine 99.6%
8% better than Ohio average

Ohio average: 92.4%

Influenza Vaccine Info Percent of long-stay residents assessed and appropriately given the seasonal influenza vaccine 100.0%
6% better than Ohio average

Ohio average: 94.5%

Short-stay resident measures
Pneumococcal Vaccine Info Percent of short-stay residents assessed and appropriately given the pneumococcal vaccine 95.9%
23% better than Ohio average

Ohio average: 78.0%

Antipsychotic medication increase Info Percent of short-stay residents who newly received an antipsychotic medication 1.1%
13% better than Ohio average

Ohio average: 1.3%

Influenza Vaccine Info Percent of short-stay residents assessed and appropriately given the seasonal influenza vaccine 94.2%
25% better than Ohio average

Ohio average: 75.6%

Breakdown by payment type

Medicare

29% of new residents, usually for short-term rehab.

Typical stay 26 days

Private pay

67% of new residents, often for short stays.

Typical stay 2 months

Medicaid

4% of new residents, often for long-term daily care.

Typical stay 9 - 10 months

Facility Characteristics

Source: CMS Long-Term Care Facility Characteristics (Data as of Jan 2026)

Total residents 82
Medicare
8
9.8% of residents
Medicaid
44
53.7% of residents
Private pay or other
30
36.6% of residents
Programs & Services
Residents Group

Residents meet regularly to discuss policies, care quality, and activities

CCRC

Part of a Continuing Care Retirement Community offering multiple care levels

Active Resident Council

Organized group of residents that meets regularly to discuss facility policies, quality of life, and activities.

Finances and operations

Voluntary non-profit community
Operated by a church.
Home revenue
$16.8M
Surplus of revenue
$297.5K
Voluntary non-profit community Operated by a church.
Home revenue
$16.8M Rank #31 / 203Revenue — State benchmarkedThis home is ranked 31st out of 203 homes in Ohio. Shows this facility's annual revenue compared to the Ohio SNF average. Higher revenue generally means more resources for staffing and capital — read alongside Payroll %.Click the rank badge to see the full State ranking.Click here to see the full State ranking.
Surplus of revenue
$297.5K
Payroll costs Info The portion of the home's budget spent on staff, including nurses, caregivers, and other employees who support care and operations. Rank #50 / 203Payroll — State benchmarkedThis home is ranked 50th out of 203 homes in Ohio. Shows total annual staff payroll benchmarked to the Ohio average. Higher payroll investment relative to peers often signals better staffing and less reliance on cheaper contract labor.Click the rank badge to see the full State ranking.Click here to see the full State ranking.
$7.2M
43% of revenue Rank #171 / 203Payroll % — State benchmarkedThis home is ranked 171st out of 203 homes in Ohio. Shows payroll as a percentage of revenue versus the Ohio average. Well-run Ohio SNFs typically land around 54–64% — the top third Statewide. Below 25% may signal understaffing or heavy agency use — read with Staffing ratings.Click the rank badge to see the full State ranking.Click here to see the full State ranking.
Other operating costs Info All remaining costs needed to run the home, such as food, utilities, building maintenance, supplies and administrative expenses.
$9.3M
Total costs $16.5M

Who this home usually serves

TYPE OF STAY

Primarily short stays

Residents typically stay for brief periods, with frequent admissions and discharges throughout the year.

Living Spaces & Floor Plans for Trinity Community at Beavercreek

Beavercreek Floor Plan
Download PDF

Places of interest near Trinity Community at Beavercreek

Address 3.1 miles from city center Info Estimated distance in miles from Beavercreek's city center to Trinity Community at Beavercreek's address, calculated via Google Maps.

Calculate Travel Distance to Trinity Community at Beavercreek

Add your location

Address

Financial Assistance for
Nursing Home in Ohio

Trinity Community at Beavercreek is located in BEAVERCREEK, Ohio.
Here are the financial assistance programs available to residents in Ohio.

Get Financial aid guidance

PASSPORT Waiver

Ohio Medicaid PASSPORT

Age 60+
General Ohio resident, Medicaid-eligible, nursing home-level care need.
Income Limits (2025) ~$2,829/month 300% FBR, individual
Asset Limits $2,000 (individual), $3,000 (couple).
OH

Administered through regional agencies; waitlists possible.

Benefits
Personal care (5-7 hours/day) Respite (240 hours/year) Adult day care ($65/day) Home modifications ($1,500 avg.)

Ohio Home Care Program (non-Medicaid)

OH HCP

Age 60+
General Ohio resident, at risk of decline.
Income Limits ~$2,000/month individual, varies
Asset Limits $5,000 individual
OH

Limited funding; regional variation.

Benefits
In-home care (3-5 hours/week) Respite (up to 10 days/year) Transportation (~5 trips/month)

Assisted Living Waiver (ALW)

Ohio Assisted Living Waiver

Age 21+ (65+ prioritized)
General OH resident, Medicaid-eligible, NFLOC.
Income Limits (2025) ~$2,829/month (individual); QIT required.
Asset Limits $2,000 (individual), $3,000 (couple).
OH

Covers ~300 facilities; room/board not included (separate cost).

Benefits
Personal care Meals Medication management Transportation (~$3,000-$4,000/month value)

Program of All-Inclusive Care for the Elderly (PACE)

Ohio PACE (e.g., McGregor PACE)

Age 55+
General OH resident (specific counties), NFLOC, safe with PACE support.
Income Limits (2025) ~$2,829/month (Medicaid-eligible); private pay option available.
Asset Limits $2,000 (individual), $3,000 (couple) for Medicaid enrollees.
OH

Available in 9 counties (e.g., Cuyahoga, Franklin); expanding via Healthy Aging Grants.

Benefits
Personal care (5-7 hours/day) Medical care Meals Transportation Respite Therapies

Medicare Savings Program (MSP)

Ohio Medicare Savings Program

Age 65+ or disabled
General OH resident, Medicare Part A/B.
Income Limits (2025) ~$2,510/month (QMB), ~$3,380/month (SLMB), ~$3,598/month (QI)—individual.
Asset Limits $9,430 (individual), $14,130 (couple).
OH

Three tiers; includes Extra Help for Part D; no waitlist.

Benefits
Covers Part B premiums ($174.70/month) Deductibles ($240/year) Copays (~20%)

Home Energy Assistance Program (HEAP)

Ohio HEAP

Age 60+ prioritized
General OH resident, low-income household.
Income Limits (2025) ~$3,970/month individual, 185% FPL
Asset Limits Not assessed; income-focused.
OH

Covers gas, electric, oil; emergency aid via Winter/Summer Crisis Programs.

Benefits
Heating/cooling aid ($300-$1,000/season) Emergency aid ($500 max)

Family Caregiver Support Program (FCSP)

Ohio Family Caregiver Support Program

Age
General Caregivers of 60+ needing care or 55+ caregivers of others; OH resident; functional needs (2+ ADLs).
Income Limits (2025) Prioritizes ~$24,980/year (individual); no strict cap.
Asset Limits Not assessed; need-based.
OH

12 AAAs; rural/low-income priority; volunteer respite option.

Benefits
Respite (4-6 hours/week or 5 days/year) Adult day care ($60/day) Training Supplies (~$500/year)

VA Aid and Attendance (A&A) and Housebound Benefits

Ohio VA Aid and Attendance/Housebound

Age 65+ or disabled veteran/spouse
General OH resident, wartime service, need for ADL help (A&A) or homebound.
Income Limits (2025) Net income < ~$1,984/month (veteran with dependent, A&A); pension offsets income.
Asset Limits ~$155,356 net worth limit
OH

High veteran demand; supports care in multiple settings.

Benefits
Cash (~$1,433-$2,642/month veteran, ~$951-$1,318 spouse) for care costs (e.g., in-home, assisted living)

Homestead Exemption

Ohio Homestead Exemption

Age 65+ (or disabled)
General OH resident, homeowner, low-income.
Income Limits (2025) ~$38,500/year individual, adjusted annually
Asset Limits Not assessed; home ownership required.
OH

Reduces taxable value by $25,000; applies to primary residence.

Benefits
Tax reduction (~$400-$800/year avg., varies by county)

Save the Dream Ohio (Homeowner Assistance Fund)

Ohio Save the Dream

Age 60+ prioritized
General OH resident, homeowner, hardship post-Jan 21, 2020.
Income Limits (2025) ~$147,600/year family of 4, 150% AMI; varies by county
Asset Limits Not assessed; hardship-focused.
OH

Covers delinquent mortgages, utilities, taxes; max $25,000 mortgage aid.

Benefits
Mortgage aid ($25,000 max) Utility/property tax aid ($5,000 avg.)

Compare Nursing Home around Ohio

The information below is reported by the Ohio Department of Health, Bureau of Survey and Certification.

5 facilities compared · CMS & OH Dept. of Health data

Filter by care type
Brookdale Westlake Village
NH

Nursing Home Licensed facility providing 24/7 skilled nursing care for residents with complex, ongoing medical needs. Staffed by RNs, LPNs, and CNAs. Inspected and star-rated annually by CMS. Accepts Medicare (short-term rehab) and Medicaid (long-term care).

AL

Assisted Living A licensed, long-term care setting for seniors or individuals with disabilities who need help with daily activities — like bathing, dressing, and medication management — but not 24-hour skilled nursing. Offers housing, meals, and around-the-clock support while aiming to maximize resident independence.

IL

Independent Living Lifestyle-focused communities for older adults offering dining, activities, and transportation with minimal personal care. Best for active, independent seniors who want community without medical support.

MC

Memory Care Secured, specialized care for people living with Alzheimer's or dementia. Staff trained in cognitive impairment, with higher staff-to-resident ratios and an environment designed to reduce confusion and wandering risk.

Westlake357 79.6% +1%4.38 +18%+24%$051.3-53A+ 25 Labeed Diab$13.1M$10.2M78.4%366373
Meadow Grove Transitional Care
NH

Nursing Home Licensed facility providing 24/7 skilled nursing care for residents with complex, ongoing medical needs. Staffed by RNs, LPNs, and CNAs. Inspected and star-rated annually by CMS. Accepts Medicare (short-term rehab) and Medicaid (long-term care).

AL

Assisted Living A licensed, long-term care setting for seniors or individuals with disabilities who need help with daily activities — like bathing, dressing, and medication management — but not 24-hour skilled nursing. Offers housing, meals, and around-the-clock support while aiming to maximize resident independence.

IL

Independent Living Lifestyle-focused communities for older adults offering dining, activities, and transportation with minimal personal care. Best for active, independent seniors who want community without medical support.

MC

Memory Care Secured, specialized care for people living with Alzheimer's or dementia. Staff trained in cognitive impairment, with higher staff-to-resident ratios and an environment designed to reduce confusion and wandering risk.

Grove City (Blue Star Drive)99 96.0% +22%2.98 +4%-16%$0204.0-92A+ 1 Valerie Kettell$13.4M$6.1M45.2%366446
Trinity Community at Beavercreek
NH

Nursing Home Licensed facility providing 24/7 skilled nursing care for residents with complex, ongoing medical needs. Staffed by RNs, LPNs, and CNAs. Inspected and star-rated annually by CMS. Accepts Medicare (short-term rehab) and Medicaid (long-term care).

AL

Assisted Living A licensed, long-term care setting for seniors or individuals with disabilities who need help with daily activities — like bathing, dressing, and medication management — but not 24-hour skilled nursing. Offers housing, meals, and around-the-clock support while aiming to maximize resident independence.

Beavercreek83 83.5% +6%3.85 -14%+9%$24.5k315.2282- 2 Richard Dible$16.8M$7.2M43%365777
Laurels of Norworth
NH

Nursing Home Licensed facility providing 24/7 skilled nursing care for residents with complex, ongoing medical needs. Staffed by RNs, LPNs, and CNAs. Inspected and star-rated annually by CMS. Accepts Medicare (short-term rehab) and Medicaid (long-term care).

AL

Assisted Living A licensed, long-term care setting for seniors or individuals with disabilities who need help with daily activities — like bathing, dressing, and medication management — but not 24-hour skilled nursing. Offers housing, meals, and around-the-clock support while aiming to maximize resident independence.

HC

Home Care Professional care delivered in the person's own home — from companionship and errands to skilled nursing and therapy. Allows seniors to age in place. Medicare covers skilled home health when medically necessary.

MC

Memory Care Secured, specialized care for people living with Alzheimer's or dementia. Staff trained in cognitive impairment, with higher staff-to-resident ratios and an environment designed to reduce confusion and wandering risk.

Worthington (Worthington Estates East)126 91.2% +16%3.62 +18%+2%$51.9k454.53111A+ 50 Thomas Widney$16.1M$8.4M52.1%365222
Hudson Springs Nursing & Rehab
NH

Nursing Home Licensed facility providing 24/7 skilled nursing care for residents with complex, ongoing medical needs. Staffed by RNs, LPNs, and CNAs. Inspected and star-rated annually by CMS. Accepts Medicare (short-term rehab) and Medicaid (long-term care).

AL

Assisted Living A licensed, long-term care setting for seniors or individuals with disabilities who need help with daily activities — like bathing, dressing, and medication management — but not 24-hour skilled nursing. Offers housing, meals, and around-the-clock support while aiming to maximize resident independence.

IL

Independent Living Lifestyle-focused communities for older adults offering dining, activities, and transportation with minimal personal care. Best for active, independent seniors who want community without medical support.

MC

Memory Care Secured, specialized care for people living with Alzheimer's or dementia. Staff trained in cognitive impairment, with higher staff-to-resident ratios and an environment designed to reduce confusion and wandering risk.

Stow (Colony Park)80 86.3% +10%3.65 -12%+3%$0404.0169A 47 -$8.7M$5.0M57.2%366434

Frequently Asked Questions about Trinity Community at Beavercreek

Is Trinity Community at Beavercreek in a walkable area?

Trinity Community at Beavercreek has a walk score of 2. Car-dependent. Most errands require a car, with limited nearby walkable options.

What is the occupancy rate at Trinity Community at Beavercreek?

Trinity Community at Beavercreek's occupancy is 84%.

Does Trinity Community at Beavercreek have different floorplan options?

Yes — see the floorplan options available at Trinity Community at Beavercreek on this page.

What is the best email address for Trinity Community at Beavercreek?

The team at Trinity Community at Beavercreek can be reached at [email protected].

How many beds does Trinity Community at Beavercreek have?

Trinity Community at Beavercreek has 83 beds.

Has Trinity Community at Beavercreek had any recent deficiencies or citations?

Trinity Community at Beavercreek has had 3 recently reported deficiencies.

Are there photos of Trinity Community at Beavercreek?

Yes — there are 11 photos of Trinity Community at Beavercreek in the photo gallery on this page.

Guides for Better Senior Living

Care Cost Calculator: See Prices in Your Area

Nursing Home Data Explorer

Don’t Wait Too Long: 7 Red Flag Signs Your Parent Needs Assisted Living Now

The True Cost of Assisted Living in 2025 – And How Families Are Paying For It

Understanding Senior Living Costs: Pricing Models, Discounts & Financial Assistance

Explore Open Rooms
1 Contact details
2 What type of senior care service are you looking for?
3 What budget do you have in mind for senior care?
4 How soon do you need to find care?
5 Additional details

Thank you for your interest!

Our team will be in touch shortly to help with next steps.