Emerson on Harvest Hill
Nursing Home & Independent Living · Dallas, TX
CMS overall rating Info CMS (the Centers for Medicare & Medicaid Services) is the federal agency that rates nursing home quality. Its Overall Rating runs from 1 to 5 stars, combining health inspections, staffing, and quality measures, with inspections weighted most heavily.

Emerson on Harvest Hill

Nursing Home & Independent Living · Dallas, TX
CMS overall rating Info CMS (the Centers for Medicare & Medicaid Services) is the federal agency that rates nursing home quality. Its Overall Rating runs from 1 to 5 stars, combining health inspections, staffing, and quality measures, with inspections weighted most heavily.
Calculator: See prices in your area
Emerson on Harvest Hill accepts Medicare, Medicaid, and private pay.

Overview of Emerson on Harvest Hill

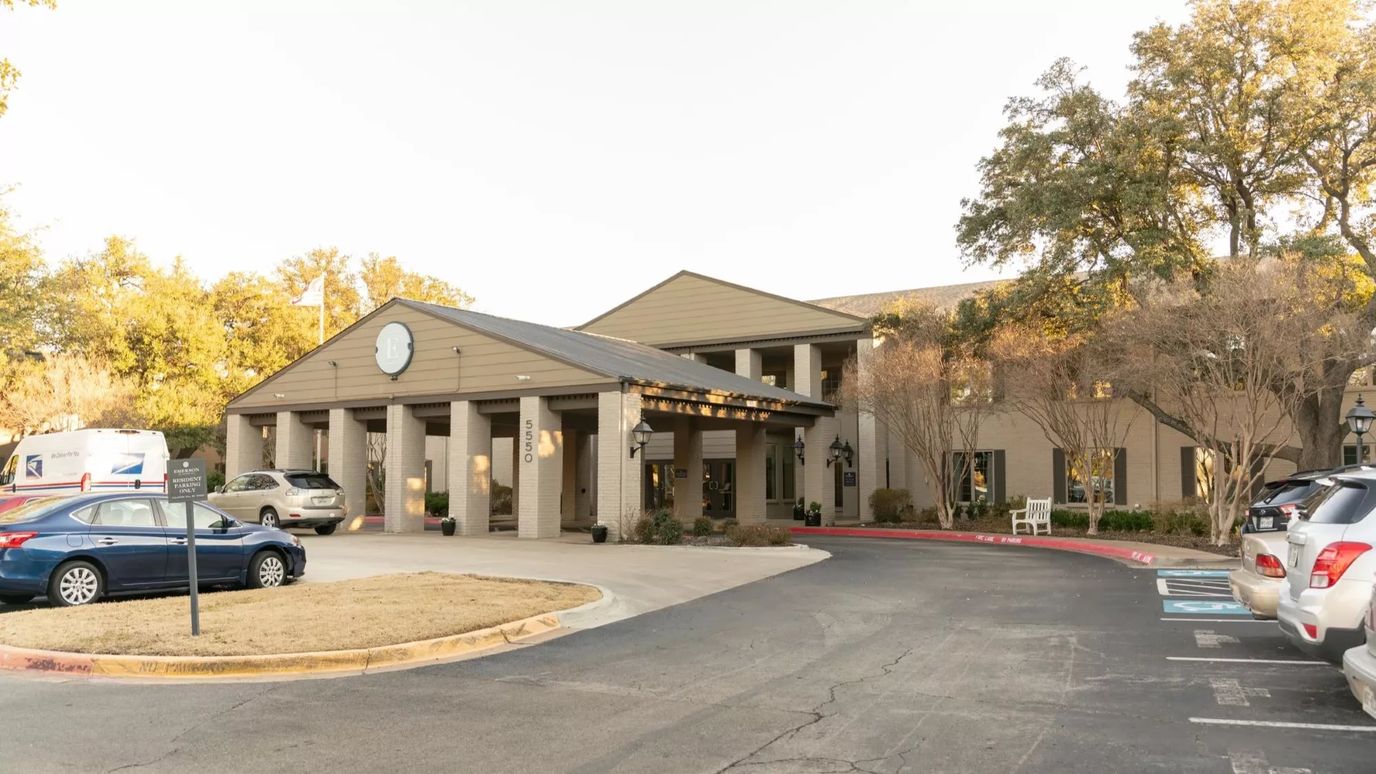
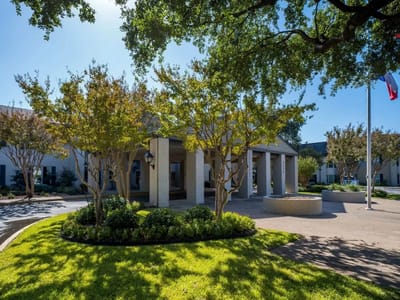
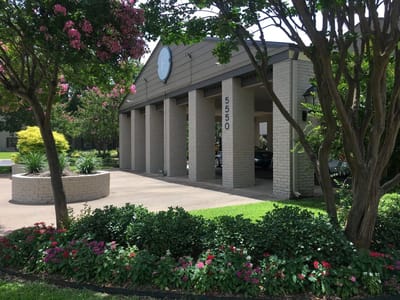
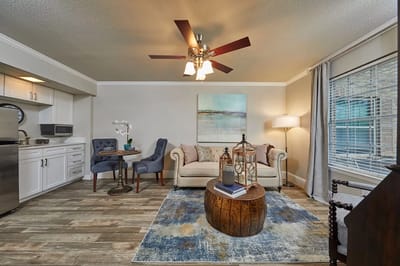
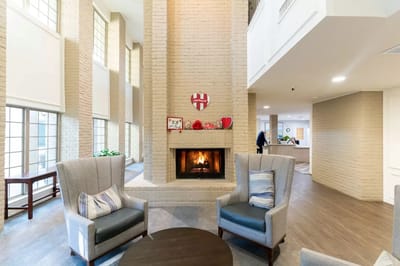
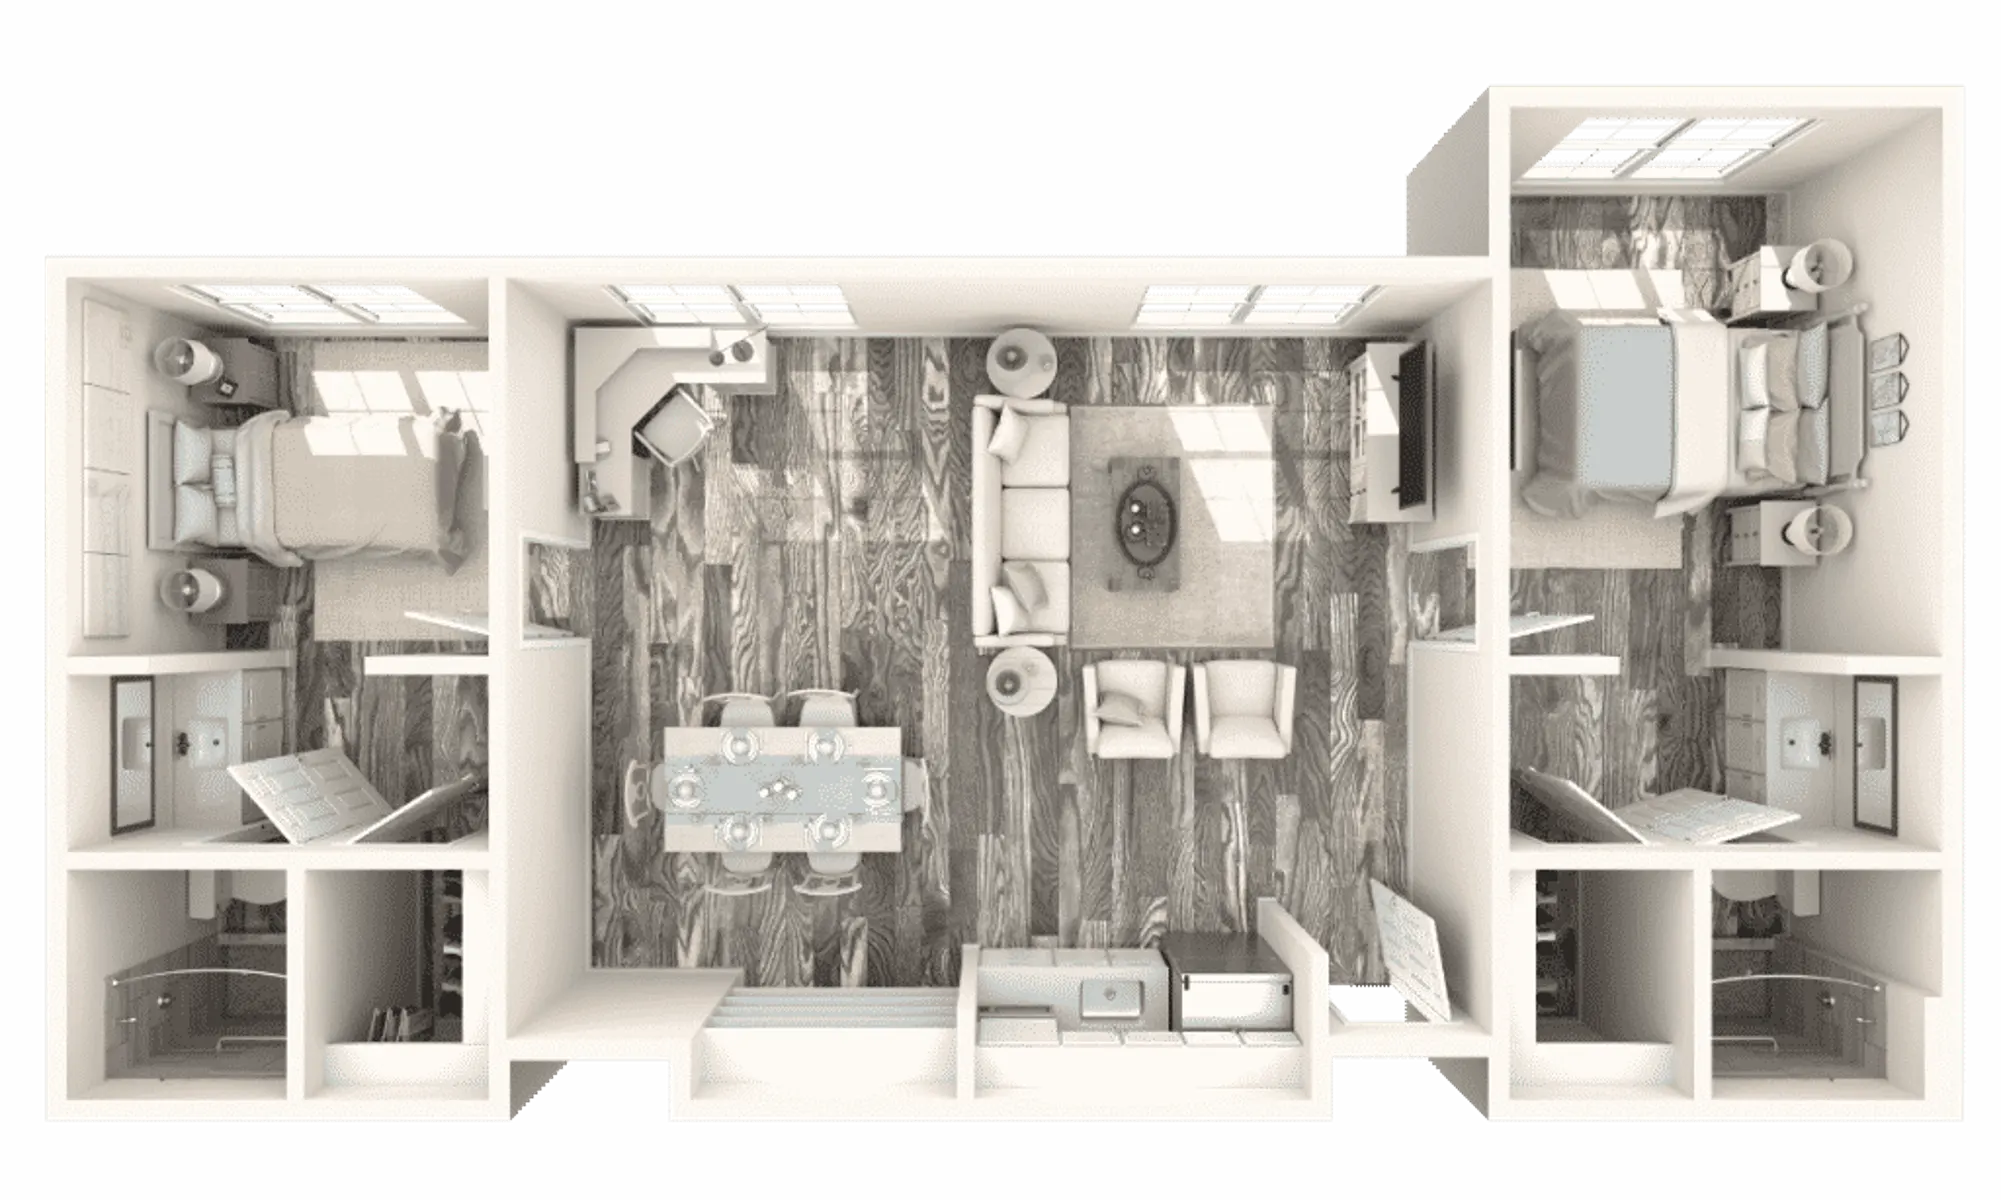
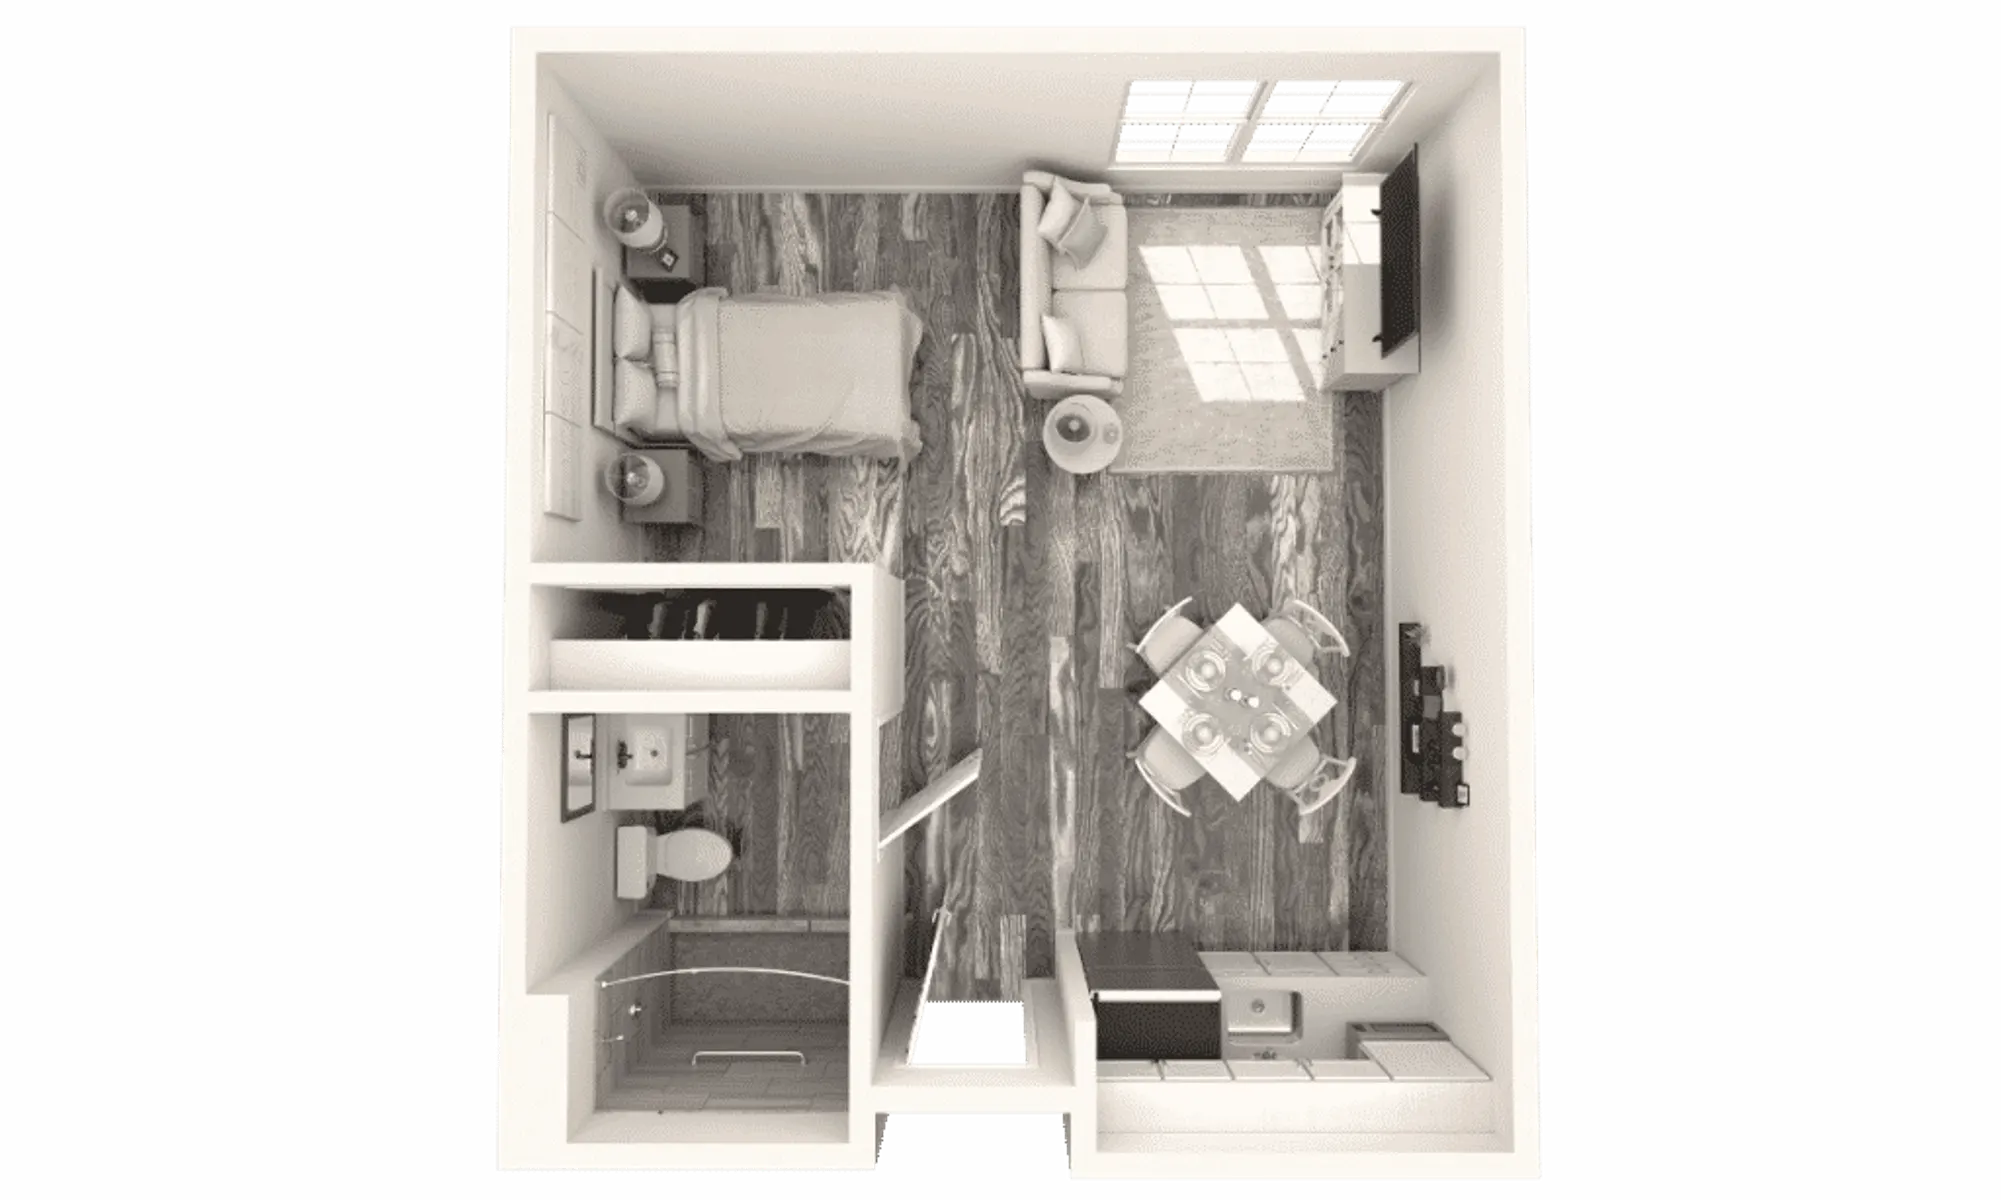
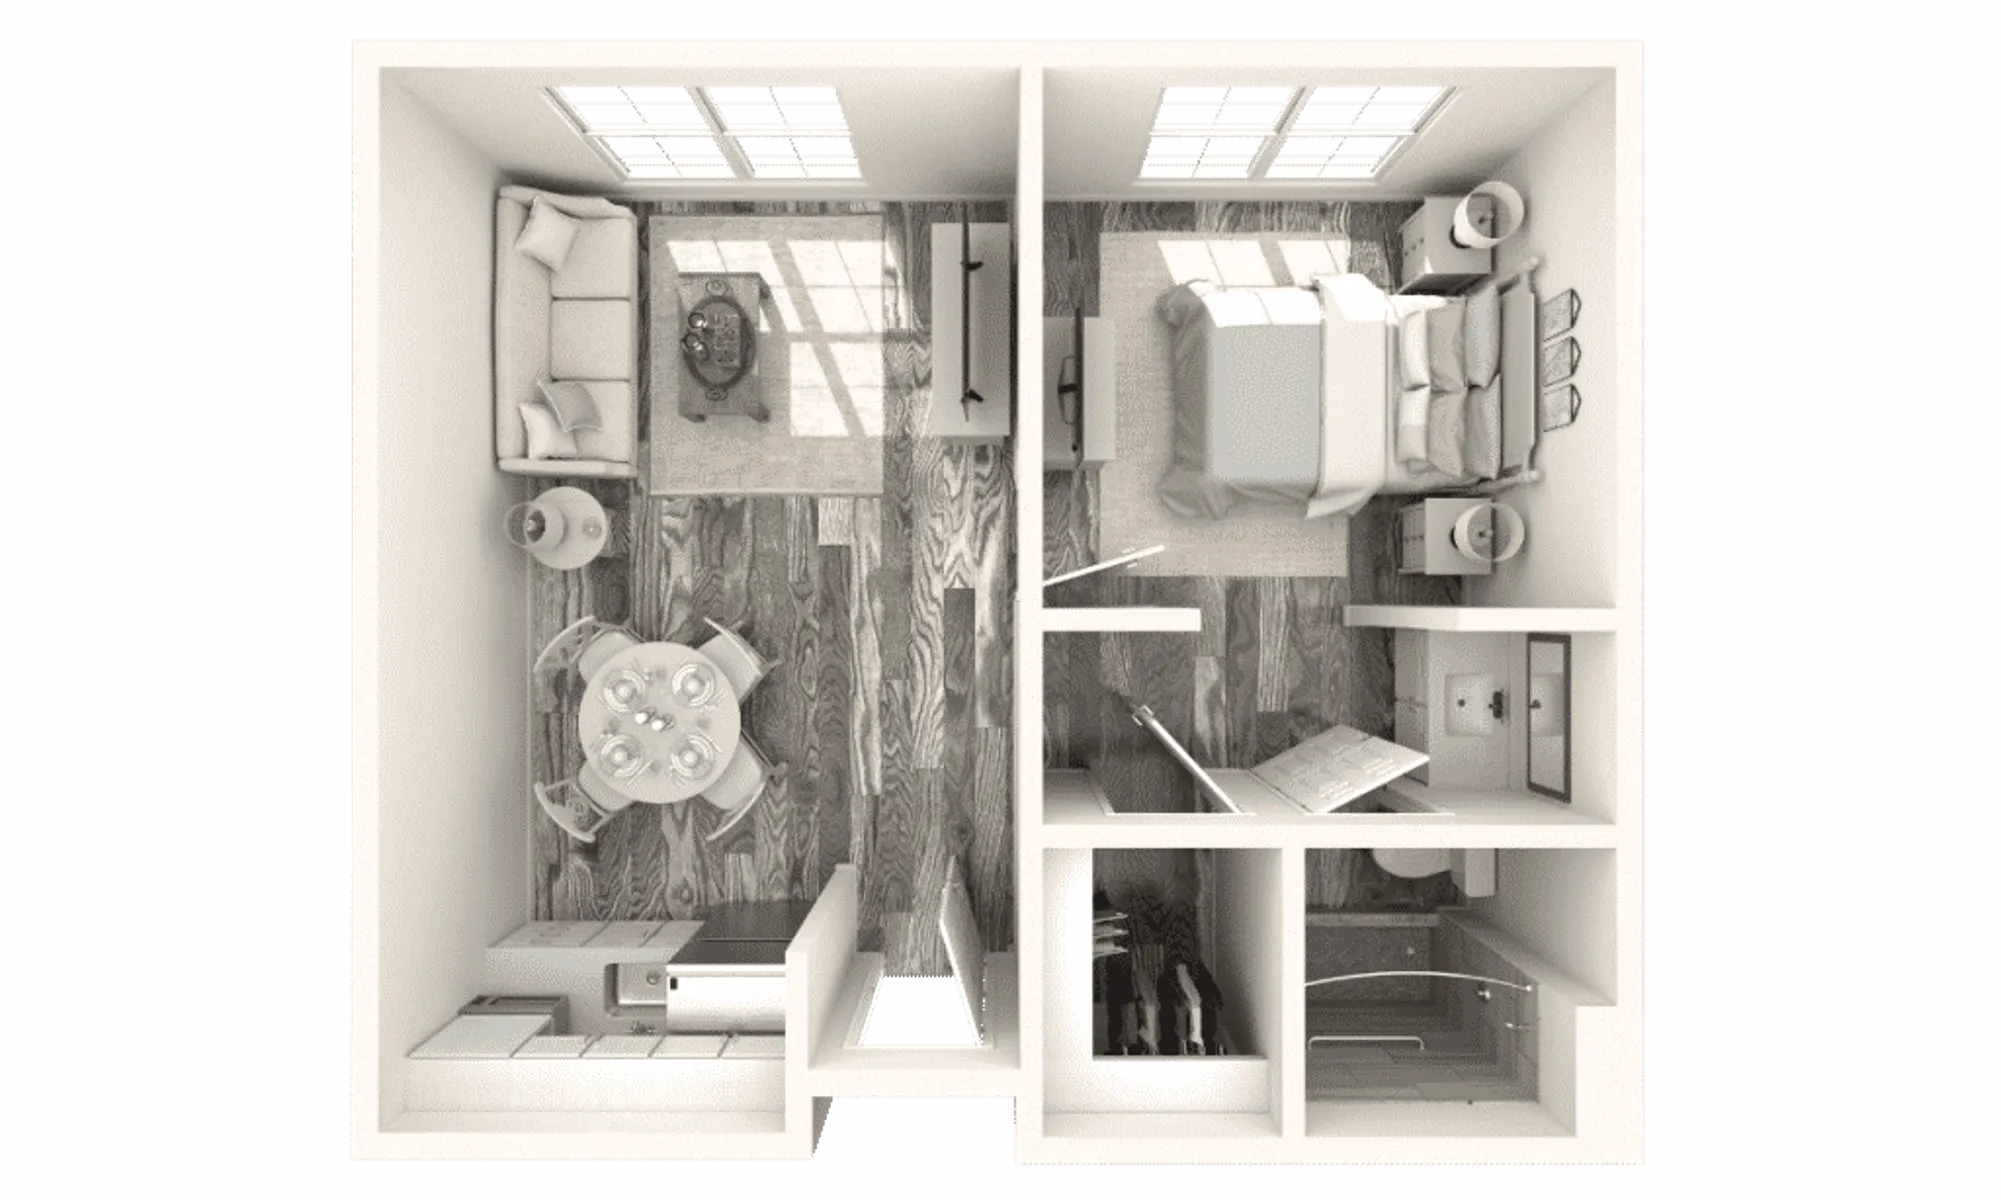
Emerson on Harvest Hill offers a one-of-a-kind lifestyle in their senior apartments, providing the perfect setting for independent living. This community is dedicated to ensuring residents have the utmost comfort and enjoyment during their retirement years. With a prime location, luxurious amenities, and top-notch services, the home exceeds expectations. The community offers a variety of independent living floor plans, allowing residents to choose the layout that best suits their needs and preferences. From spacious studios to one and two-bedroom apartments, there’s a perfect home waiting for everyone.
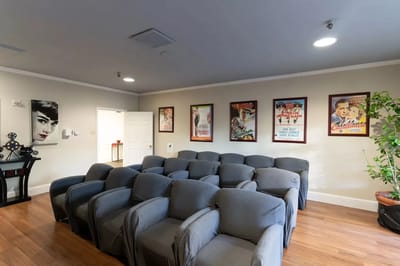
Residents can also enjoy a wealth of amenities and services. The community boasts 24-hour service staff, providing round-the-clock assistance whenever needed. Stay connected with Wi-Fi access in the common areas and experience peace of mind with the state-of-the-art fire and security system. Say goodbye to maintenance concerns as interior and exterior upkeep, as well as housekeeping, are taken care of by the dedicated staff. The community also features an on-site hair salon, a fully equipped fitness center, a theater, a well-stocked library and more. For those who love the outdoors, the putting green offers a delightful spot to practice their golf skills.

(214) 351-3151

Quality ratings

Measured by Centers for Medicare & Medicaid Services (CMS)

Overall rating Info The Overall CMS Rating combines results from health inspections, staffing levels and quality measures. Health inspections carry the most weight. Staffing and quality scores can increase or decrease the final rating based on performance compared to state and national standards.
▼ 64.2% Below TX avg. ▼ 64.2% Below TX avg.TX average: 2.8Click the badge to see the full State ranking.Click here to see the full State ranking.
Health Inspection Info Based on the results of the facility's three most recent standard inspections and any complaint investigations. CMS reviews the number, scope, and severity of deficiencies, with more recent findings weighted more heavily.
▼ 63.8% Below TX avg. ▼ 63.8% Below TX avg.TX average: 2.8Click the badge to see the full State ranking.Click here to see the full State ranking.
Staffing Info Measures average nursing staff hours per resident per day, including Registered Nurses (RNs) and total nursing staff. Ratings are adjusted based on the level of care residents require and are compared to state and national benchmarks.
▼ 52.9% Below TX avg. ▼ 52.9% Below TX avg.TX average: 2.1Click the badge to see the full State ranking.Click here to see the full State ranking.
Quality Measures Info Based on clinical and physical health indicators reported to CMS, such as hospital readmissions, falls, pressure ulcers, and improvements in mobility. These measures reflect how well residents' health needs are being managed.
▼ 20.1% Below TX avg. ▼ 20.1% Below TX avg.TX average: 3.8Click the badge to see the full State ranking.Click here to see the full State ranking.

Staffing hours breakdown

Info Daily nursing hours per resident by staff type, reported to CMS. Higher is generally better — compare this facility to state and national averages to see where staffing stands.

Hours per resident per day — compared to Texas state averages

Total nursing care / resident Info This home is ranked 146th out of 296 homes in Texas for nurse hours. Total adjusted nursing hours per resident per day, combining RN, LPN, and aide time. CMS adjusts this for case-mix so facilities can be fairly compared.
3h 33m per day
Rank #146 / 296Nurse hours — State benchmarkedThis home is ranked 146th out of 296 homes in Texas. Shows adjusted nurse hours per resident per day benchmarked to the Texas average, with a ranking across 296 Texas facilities. More hours mean more direct care. The national average is about 3.5 hrs; below 3.0 is a red flag.Ranking totals vary by category as each rank only includes facilities that report data for that metric. Homes missing that data point aren't included in the ranking.Click the rank badge to see the full State ranking.Click here to see the full State ranking.
This facility Texas avg (3h 38m per day)
vs Texas avg
-2%

1 of 1 metrics below state avg

Staff typeHours / Day / Residentvs state avg
Weekend Total Nursing Info Combined nursing hours (RN + LPN + Nurse Aide) per resident per day on weekends. Staffing often drops on weekends — this figure reveals whether the facility maintains adequate coverage outside of weekday hours. 2h 55m per day ▼ 3% State avg: 3h 0m per day · National avg: 3h 27m per day

Capacity and availability

This home usually has availability

Higher occupancy than the Texas average: 63.5%
Occupancy rate
67.5% Rank #152 / 304Occupancy rate — State benchmarkedThis home is ranked 152nd out of 304 homes in Texas. Shows this facility's occupancy rate versus the Texas average, with its Statewide rank out of 304. Higher occupancy signals strong local demand and financial stability.Ranking totals vary by category as each rank only includes facilities that report data for that metric. Homes missing that data point aren't included in the ranking.Click the rank badge to see the full State ranking.Click here to see the full State ranking.
Avg. Length of Stay
231 days
Bed community size
130-bed community Rank #136 / 988Bed count — State benchmarkedThis home is ranked 136th out of 988 homes in Texas. Shows this facility's certified or reported bed count compared to other Texas facilities. Larger communities may offer more amenities, programs, and on-site services for residents and families.Ranking totals vary by category as each rank only includes facilities that report data for that metric. Homes missing that data point aren't included in the ranking.Click the rank badge to see the full State ranking.Click here to see the full State ranking.
A larger shared setting that may offer more common spaces and organized community services.
Walk Score
Walk Score: 59 / 100 Rank #311 / 1391Walk Score — State benchmarkedThis home is ranked 311th out of 1391 homes in Texas. Shows how walkable this facility's neighborhood is compared to the average Walk Score across Texas facilities. Higher scores benefit residents, families, and staff.Ranking totals vary by category as each rank only includes facilities that report data for that metric. Homes missing that data point aren't included in the ranking.Click the rank badge to see the full State ranking.Click here to see the full State ranking.
Moderately walkable. Some errands can be accomplished on foot, with a mix of nearby amenities.

About this community

Contact Emerson on Harvest Hill

Staffing Data

Reporting period: October 1 – December 31, 2025 (Q4 2025). Source: CMS Payroll-Based Journal report.

Total staff 73
Employees 71
Contractors 2
Staff to resident ratio 0.55 : 1
63% fewer staff per resident than Texas average
Texas average ratio: 1.48 : 1 Texas average ratio: 1.48 : 1See full Texas ranking
Avg staff/day 34
Average shift 8.4 hours
0% compared with Texas average
Texas average: 8.1 hours Texas average shift: 8.1 hoursSee full Texas ranking
Total staff hours (quarter) 26,425

Nursing staff breakdown

Q4 2025 · Oct 1 – Dec 31 More info This data comes from the CMS Payroll-Based Journal report covering October 1 – December 31, 2025.
Registered Nurse

Manages medical care and health needs.

RN Staff Info All 8 RN Staff are full-time employees. No contractors work on this role. 8
Average shift length Info Average shift length. Calculated as total hours divided by days worked and average staff per day. 9.8 hours
Licensed Practical Nurse

Assists with medical care and medications.

LPN Staff Info All 12 LPN Staff are full-time employees. No contractors work on this role. 12
Average shift length Info Average shift length. Calculated as total hours divided by days worked and average staff per day. 8.8 hours
Certified Nursing Assistant

Helps with daily care and mobility.

CNA Staff Info All 27 CNA Staff are full-time employees. No contractors work on this role. 27
Average shift length Info Average shift length. Calculated as total hours divided by days worked and average staff per day. 7.6 hours

Contractor staffing

Q4 2025 · Oct 1 – Dec 31 More info This data comes from the CMS Payroll-Based Journal report covering October 1 – December 31, 2025.

Total hours from contractors

0.2%

42 contractor hours this quarter

Medical Director: 1 Occupational Therapy Aide: 1

Staff by category

Q4 2025 · Oct 1 – Dec 31 More info This data comes from the CMS Payroll-Based Journal report covering October 1 – December 31, 2025.
Certified Nursing Assistant270278,89892100%7.6
Licensed Practical Nurse120124,42892100%8.8
Registered Nurse8083,57492100%9.8
Medication Aide/Technician8083,43092100%11
RN Director of Nursing5052,1138491%8.4
Physical Therapy Assistant2026087480%7.9
Dietitian1015416874%8
Nurse Practitioner1015206571%8
Speech Language Pathologist1015206571%8
Mental Health Service Worker1015206571%8
Respiratory Therapy Technician2024615762%7.6
Administrator1014085155%8
Qualified Social Worker2023626065%6
Occupational Therapy Aide0113667%6
Medical Director011633%2
27 Certified Nursing Assistant
% of Days 100%
12 Licensed Practical Nurse
% of Days 100%
8 Registered Nurse
% of Days 100%
8 Medication Aide/Technician
% of Days 100%
5 RN Director of Nursing
% of Days 91%
2 Physical Therapy Assistant
% of Days 80%
1 Dietitian
% of Days 74%
1 Nurse Practitioner
% of Days 71%
1 Speech Language Pathologist
% of Days 71%
1 Mental Health Service Worker
% of Days 71%
2 Respiratory Therapy Technician
% of Days 62%
1 Administrator
% of Days 55%
2 Qualified Social Worker
% of Days 65%
1 Occupational Therapy Aide
% of Days 7%
1 Medical Director
% of Days 3%

Penalties and fines

Includes penalties issued in 2023-2025

Federal penalties imposed by CMS for regulatory violations, including civil money penalties (fines) and denials of payment for new Medicare/Medicaid admissions.

Source: CMS Penalties Database (Data as of Jan 2026)

Total fines amount $155K Rank #231 / 301Federal fines — State benchmarkedThis home is ranked 231st out of 301 homes in Texas. Shows this facility's cumulative CMS federal fine dollars versus the Texas average among facilities with fines, and where it ranks among 301 facilities in the pool. Lower total dollars mean a better rank.Ranking totals vary by category as each rank only includes facilities that report data for that metric. Homes missing that data point aren't included in the ranking.Click the rank badge to see the full State ranking.Click here to see the full State ranking.
92% higher than Texas average

Texas average: $80K

Number of fines 6
141% more fines than Texas average

Texas average: 2.5

Payment Denials Info Serious action where Medicare and/or Medicaid temporarily stops payments for new residents until issues are fixed. 0
100% fewer payment denials than Texas average

Texas average: 0.2

Fines amount comparison
This facility $155K
Texas average $80K
Penalty History

Penalties are imposed by CMS for violations of federal nursing home regulations.

3 penalties in the past 3 years

Multiple penalties were reported in the last 3 years.

Civil Money Penalty Info Fines imposed for noncompliance, which can be assessed per day or per instance of violation. Oct 29, 2025
$19K
Civil Money Penalty Info Fines imposed for noncompliance, which can be assessed per day or per instance of violation. Sep 13, 2023
$16K
Civil Money Penalty Info Fines imposed for noncompliance, which can be assessed per day or per instance of violation. Sep 13, 2023
$16K

Last updated: Jan 2026

Quality of care over time

These measures show how residents usually do over time at this home, based on health outcomes and preventive care.

High-risk clinical events score Info A composite score based on pressure ulcers, falls with injury, weight loss, walking ability decline, and activities of daily living decline. 10.3
19% worse than Texas average

Texas average: 8.6

Functional decline score Info A composite score based on activities of daily living decline, walking ability decline, and incontinence. 19.4
21% worse than Texas average

Texas average: 16.0

Long-stay resident measures
Need for Help with Daily Activities Increased Info Percent of long-stay residents whose need for help with daily activities has increased 22.3%
38% worse than Texas average

Texas average: 16.2%

Walking Ability Worsened Info Percent of long-stay residents whose ability to move independently worsened 17.1%
5% worse than Texas average

Texas average: 16.2%

Low Risk Residents with Bowel/Bladder Incontinence Info Percent of low risk long-stay residents who lose control of their bowels or bladder 18.9%
21% worse than Texas average

Texas average: 15.7%

Falls with Major Injury Info Percent of long-stay residents experiencing one or more falls with major injury 1.8%
45% better than Texas average

Texas average: 3.2%

High Risk Residents with Pressure Ulcers Info Percent of long-stay high risk residents with pressure ulcers 6.6%
48% worse than Texas average

Texas average: 4.4%

Urinary Tract Infection Info Percent of long-stay residents with a urinary tract infection 0.4%
55% better than Texas average

Texas average: 0.8%

Lost Too Much Weight Info Percent of long-stay residents who lose too much weight 3.7%
7% worse than Texas average

Texas average: 3.5%

Depressive Symptoms Info Percent of long-stay residents who have depressive symptoms 0.0%
100% better than Texas average

Texas average: 2.9%

Antipsychotic Use Info Percent of long-stay residents who received an antipsychotic medication 3.1%
61% better than Texas average

Texas average: 7.9%

Pneumococcal Vaccine Info Percent of long-stay residents assessed and appropriately given the pneumococcal vaccine 100.0%
In line with Texas average

Texas average: 97.3%

Influenza Vaccine Info Percent of long-stay residents assessed and appropriately given the seasonal influenza vaccine 100.0%
In line with Texas average

Texas average: 97.9%

Short-stay resident measures
Pneumococcal Vaccine Info Percent of short-stay residents assessed and appropriately given the pneumococcal vaccine 99.0%
10% better than Texas average

Texas average: 90.4%

Antipsychotic medication increase Info Percent of short-stay residents who newly received an antipsychotic medication 3.2%
117% worse than Texas average

Texas average: 1.4%

Influenza Vaccine Info Percent of short-stay residents assessed and appropriately given the seasonal influenza vaccine 100.0%
14% better than Texas average

Texas average: 88.0%

Breakdown by payment type

Medicare

19% of new residents, usually for short-term rehab.

Typical stay 1 - 2 months

Private pay

38% of new residents, often for short stays.

Typical stay 3 - 4 months

Medicaid

43% of new residents, often for long-term daily care.

Typical stay 1 years

Facility Characteristics

Source: CMS Long-Term Care Facility Characteristics (Data as of Jan 2026)

Total residents 132
Medicare
3
2.3% of residents
Medicaid
51
38.6% of residents
Private pay or other
78
59.1% of residents
Programs & Services
Residents Group

Residents meet regularly to discuss policies, care quality, and activities

Family Member Group

Family members meet regularly to discuss policies, care quality, and activities

Active Family Council

Organized group of family members that meets regularly to discuss facility policies, resident care, and activities.

Active Resident Council

Organized group of residents that meets regularly to discuss facility policies, quality of life, and activities.

Finances and operations

Based on CMS SNF Cost Report for fiscal year ending in 03/2024.

Privately-owned community
Operated by a single business entity.
Net patient revenue Info Net patient revenue — what the home actually collects for resident care, after contractual allowances, bad debt and discounts are subtracted from its gross charges (CMS cost report, Worksheet G-3). It covers resident care only; money the home earns from other sources is shown separately as "Other income."
$6.7M
Net patient income Info Net patient income: net patient revenue minus the home's total operating expenses. A positive figure means it earns more from resident care than it spends to deliver it; a negative figure means the opposite. It excludes non-operating "other income."
-$1.5M
Privately-owned community Operated by a single business entity.
Net patient revenue Info Net patient revenue — what the home actually collects for resident care, after contractual allowances, bad debt and discounts are subtracted from its gross charges (CMS cost report, Worksheet G-3). It covers resident care only; money the home earns from other sources is shown separately as "Other income."
$6.7M Rank #214 / 304Revenue — State benchmarkedThis home is ranked 214th out of 304 homes in Texas. Shows this facility's annual revenue compared to the Texas average. Higher revenue generally means more resources for staffing and capital — read alongside Payroll %.Ranking totals vary by category as each rank only includes facilities that report data for that metric. Homes missing that data point aren't included in the ranking.Click the rank badge to see the full State ranking.Click here to see the full State ranking.
Net patient income Info Net patient income: net patient revenue minus the home's total operating expenses. A positive figure means it earns more from resident care than it spends to deliver it; a negative figure means the opposite. It excludes non-operating "other income."
-$1.5M
Other income Info Money the home earns outside of resident care — such as investments, grants, rentals and other non-operating sources (CMS cost report, Worksheet G-3). It is tracked separately from net patient revenue: it is not part of that figure, and it is not included in net patient income.
$1.1M
Payroll costs Info Staff salaries plus wage-related costs — benefits such as payroll taxes, health insurance and retirement — from the home's own accounting records (CMS cost report, Worksheet A). Contract or agency labor is counted separately, under other operating costs. Rank #141 / 304Payroll — State benchmarkedThis home is ranked 141st out of 304 homes in Texas. Shows total annual staff payroll benchmarked to the Texas average. Higher payroll investment relative to peers often signals better staffing and less reliance on cheaper contract labor.Ranking totals vary by category as each rank only includes facilities that report data for that metric. Homes missing that data point aren't included in the ranking.Click the rank badge to see the full State ranking.Click here to see the full State ranking.
$5.2M 77.8% of net patient revenue Info Payroll as a share of revenue: staff salaries and wage-related benefits divided by net patient revenue. A higher figure means more of each revenue dollar goes to staff pay. Rank #41 / 304Payroll % — State benchmarkedThis home is ranked 41st out of 304 homes in Texas. Shows payroll as a percentage of revenue versus the Texas average. Well-run Texas facilities typically land around 51–63% — the top third Statewide. Below 25% may signal understaffing or heavy agency use — read with Staffing ratings.Ranking totals vary by category as each rank only includes facilities that report data for that metric. Homes missing that data point aren't included in the ranking.Click the rank badge to see the full State ranking.Click here to see the full State ranking.
Other operating costs Info Everything it costs to run the home apart from payroll — food, utilities, supplies, maintenance, contract labor and administration. Calculated as total operating expense minus payroll (staff salaries and wage-related benefits).
$3.0M
Total costs Info The home's total operating expense for the year — all the costs of running it, salaries included (CMS cost report, Worksheet G-3).
$8.2M

What does this home offer?

Pets allowed icon
Pets allowed icon

Pets Allowed

Room sizes icon
Room sizes icon

Room Sizes: 237 - 500 / 454 - 685 / 685 - 977 sq. ft.

Housing options icon

Housing Options: Studio / 1 Bed / 2 Bed

Building type icon
Building type icon

Building Type: 2-story

Fitness and recreation icon

Fitness and Recreation

Who this home usually serves

TYPE OF STAY

Mostly long-term care residents

Most residents stay for extended periods and receive ongoing daily care.

New residents most often arrive under Medicaid (43% of admissions), and a typical Medicaid stay runs around 1 years.

Admissions
145 total

Coverage residents most often arrive under.

Medicare 19%
Private pay 38%
Medicaid 43%
Discharges
139 total

Coverage residents most often leave under.

Medicare 16%
Private pay 33%
Medicaid 51%

Living Spaces & Floor Plans for Emerson on Harvest Hill

Emerson P3
Emerson P1
Emerson P2

Places of interest near Emerson on Harvest Hill

Address 11.3 miles from city center Info Estimated distance in miles from Dallas's city center to Emerson on Harvest Hill's address, calculated via Google Maps. — 2.52 miles to nearest hospital (Texas Oncology-Medical City Dallas Blood and Marrow Transplant)

Calculate Travel Distance to Emerson on Harvest Hill

Add your location

Address

Compare Independent Living around Dallas

Emerson on Harvest Hill
IL
NH
Dallas (North Dallas) -
130
Facility 130
TX AVG 80
Rank #136 / 988
-
59
Facility 59
TX AVG 41
Rank #311 / 1391
Studio / 1 Bed / 2 Bed
The Legacy Midtown Park
IL
AL
HC
MC
NH
Dallas (Vickery Meadow) -
98
Facility 98
TX AVG 80
Rank #376 / 988
-
45
Facility 45
TX AVG 41
Rank #628 / 1391
Studio / 1 Bed / 2 Bed
Christian Care Communities and Services – Mesquite
IL
AL
MC
NH
RC
Mesquite -
180
Facility 180
TX AVG 80
Rank #26 / 988
-
31
Facility 31
TX AVG 41
Rank #914 / 1391
Studio / 1 Bed / 2 Bed
Presbyterian Village North
IL
AL
MC
NH
RC
Dallas (Lake Highlands) -
88
Facility 88
TX AVG 80
Rank #441 / 988
-
61
Facility 61
TX AVG 41
Rank #269 / 1391
Studio / 1 Bed / 2 Bed
Signature Pointe
IL
HC
MC
NH
PC
RC
Dallas (Far North Dallas) -
195
Facility 195
TX AVG 80
Rank #14 / 988
A+
81
Facility 81
TX AVG 41
Rank #30 / 1391
Studio / 1 Bed / 2 Bed

Financial Assistance for
Independent Living in Texas

Emerson on Harvest Hill is located in Dallas, Texas.
Here are the financial assistance programs available to residents in Texas.

Get Financial aid guidance

Community Care for the Aged and Disabled (CCAD)

TX Medicaid CCAD

Age 65+ or disabled
General Texas resident, Medicaid-eligible, care need (not always nursing home level).
Income Limits (2025) ~$2,829/month 300% FBR, individual
Asset Limits $2,000 (individual), $3,000 (couple).
TX

Large state; rural access challenges.

Benefits
Personal care (5-7 hours/day) Respite (240 hours/year) Adult day care (~$60/day) Home aides

Texas Community Care Services

TX CCS

Age 60+
General Texas resident, at risk of decline.
Income Limits ~$2,000/month individual, varies
Asset Limits $5,000 individual
TX

Limited funding; high demand in urban areas.

Benefits
In-home care (3-5 hours/week) Respite (up to 10 days/year) Transportation (~5 trips/month)

Area Agency on Aging (AAA) Services

Texas AAA Services

Age 60+
General TX resident; no income/asset limits.
Income Limits (2025) None; donations encouraged.
Asset Limits Not assessed.
TX

28 AAAs; includes Meals on Wheels in some areas.

Benefits
Meals (~$5-$7/meal) Transportation Homemaker services (~4 hours/week) Respite (~5 days/year) Legal aid

Medicare Savings Program (MSP)

Texas Medicare Savings Program

Age 65+ or disabled
General TX resident, Medicare Part A/B.
Income Limits (2025) ~$2,510/month (QMB), ~$3,380/month (SLMB), ~$3,598/month (QI)—individual.
Asset Limits $9,430 (individual), $14,130 (couple).
TX

Includes Extra Help for Part D; no waitlist.

Benefits
Covers Part B premiums ($174.70/month) Deductibles ($240/year) Copays (~20%)

Family Caregiver Support Program (FCSP)

Texas Family Caregiver Support Program

Age
General Caregivers of 60+ needing care or 55+ caregivers of others; TX resident; 2+ ADLs.
Income Limits (2025) No strict cap; prioritizes low-income ~$24,980/year
Asset Limits Not assessed.
TX

High rural demand; includes grandparent caregivers.

Benefits
Respite (4-6 hours/week or 5 days/year) Adult day care ($60/day) Training Supplies (~$500/year)

VA Aid and Attendance (A&A) and Housebound Benefits

Texas VA Aid and Attendance/Housebound

Age 65+ or disabled veteran/spouse
General TX resident, wartime service, ADL help (A&A) or homebound.
Income Limits (2025) Net income < ~$1,984/month (veteran with dependent, A&A); pension offsets income.
Asset Limits ~$155,356 net worth
TX

High veteran population; supports rural/urban needs.

Benefits
Cash (~$1,433-$2,642/month veteran, ~$951-$1,318 spouse) for care costs

Property Tax Exemption for Seniors

Texas Senior Property Tax Exemption

Age 65+
General TX resident, homeowner (homestead).
Income Limits (2025) None; tax-based eligibility.
Asset Limits Not assessed.
TX

$25,000+ exemption; optional freeze in some counties; saves ~$500-$1,000/year.

Benefits
Tax exemption or freeze (~$500-$1,000/year savings)

Senior Farmers’ Market Nutrition Program (SFMNP)

Texas SFMNP

Age 60+
General TX resident, low-income.
Income Limits (2025) ~$2,322/month 185% FPL
Asset Limits Not assessed.
TX

Vouchers (~$50/season); serves ~20,000 via 28 AAAs.

Benefits
Vouchers (~$50/season) for produce at farmers’ markets

Frequently Asked Questions about Emerson on Harvest Hill

What neighborhood is Emerson on Harvest Hill in?

Emerson on Harvest Hill is in the North Dallas neighborhood.

Is Emerson on Harvest Hill in a walkable area?

Emerson on Harvest Hill has a walk score of 59. Moderately walkable. Some errands can be accomplished on foot, with a mix of nearby amenities.

What is the occupancy rate at Emerson on Harvest Hill?

Emerson on Harvest Hill's occupancy is 67.5%.

Are there photos of Emerson on Harvest Hill?

Yes — there are 8 photos of Emerson on Harvest Hill in the photo gallery on this page.

What is the phone number of Emerson on Harvest Hill?

(214) 351-3151 will put you in contact with the team at Emerson on Harvest Hill.

Is Emerson on Harvest Hill Medicare or Medicaid certified?

Yes — Emerson on Harvest Hill is a CMS-certified provider of Medicare and Medicaid.

Guides for Better Senior Living

Care Cost Calculator: See Prices in Your Area

Nursing Home Data Explorer

Don’t Wait Too Long: 7 Red Flag Signs Your Parent Needs Assisted Living Now

The True Cost of Assisted Living in 2025 – And How Families Are Paying For It

Understanding Senior Living Costs: Pricing Models, Discounts & Financial Assistance