Orrvilla Maple Terrace
CMS overall rating Info CMS (the Centers for Medicare & Medicaid Services) is the federal agency that rates nursing home quality. Its Overall Rating runs from 1 to 5 stars, combining health inspections, staffing, and quality measures, with inspections weighted most heavily.

Orrvilla Maple Terrace

CMS overall rating Info CMS (the Centers for Medicare & Medicaid Services) is the federal agency that rates nursing home quality. Its Overall Rating runs from 1 to 5 stars, combining health inspections, staffing, and quality measures, with inspections weighted most heavily.
Calculator: See prices in your area
Orrvilla Maple Terrace accepts Medicaid, Medicare, and private pay.

Overview of Orrvilla Maple Terrace
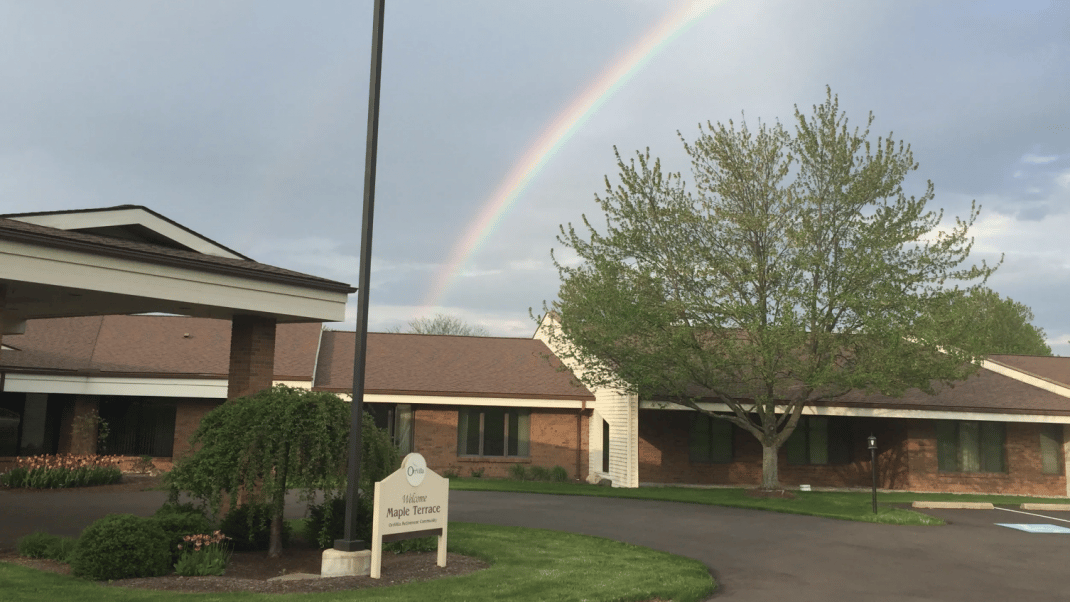
Orrvilla Maple Terrace is a 45-bed licensed Residential Care Facility at 333 East Sassafras Street in Orrville, Ohio, in Wayne County. The facility operates as the assisted living component of OrrVilla Retirement Community, a nonprofit campus established in 1981 with Mennonite heritage. The campus comprises three residential tracks: Maple Terrace for assisted living, Locust Court for independent villa living with attached garages, and Evergreen Place, government-subsidized HUD housing for income-eligible residents with an approximate 18-to-24-month waiting list. Aultman Orrville Hospital is directly adjacent to the campus.

Admission requires minimum age 62. Medicaid is accepted. The campus is non-smoking.

Staffing operates 24 hours. The confirmed care program is assisted living. Ten amenities are confirmed: meals, housekeeping, emergency call system, medication administration, social events, exercise equipment, Wi-Fi, salon services, podiatry services, and therapy services. Housekeeping, linen service, and utilities are included in residency.

Religious services are available. Special dietary accommodations are offered. The activity program includes concerts, exercise classes, Bible studies, and planned social events. Apartments are unfurnished.

The Ohio Department of Health, Bureau of Survey and Certification conducted its most recent inspection on July 17, 2025, and identified zero citations, below the Ohio statewide average of 2 citations per inspection. Zero severe citations are on record.

Families should ask about occupancy and availability, transition protocols between care levels, amenities and services covered under residency fees, and staffing qualifications before placement.

(330) 683-4455

Quality ratings

Measured by Centers for Medicare & Medicaid Services (CMS)

Overall rating Info The Overall CMS Rating combines results from health inspections, staffing levels and quality measures. Health inspections carry the most weight. Staffing and quality scores can increase or decrease the final rating based on performance compared to state and national standards.
▼ 70.6% Below OH avg. ▼ 70.6% Below OH avg.Click the badge to see the full State ranking.Click here to see the full State ranking.
Health Inspection Info Based on the results of the facility's three most recent standard inspections and any complaint investigations. CMS reviews the number, scope, and severity of deficiencies, with more recent findings weighted more heavily.
▼ 65.3% Below OH avg. ▼ 65.3% Below OH avg.Click the badge to see the full State ranking.Click here to see the full State ranking.
Staffing Info Measures average nursing staff hours per resident per day, including Registered Nurses (RNs) and total nursing staff. Ratings are adjusted based on the level of care residents require and are compared to state and national benchmarks.
▼ 29.8% Below OH avg. ▼ 29.8% Below OH avg.Click the badge to see the full State ranking.Click here to see the full State ranking.
Quality Measures Info Based on clinical and physical health indicators reported to CMS, such as hospital readmissions, falls, pressure ulcers, and improvements in mobility. These measures reflect how well residents' health needs are being managed.
▼ 9.5% Below OH avg. ▼ 9.5% Below OH avg.Click the badge to see the full State ranking.Click here to see the full State ranking.

Staffing hours breakdown

Info Daily nursing hours per resident by staff type, reported to CMS. Higher is generally better — compare this facility to state and national averages to see where staffing stands.

Hours per resident per day — compared to Ohio state averages

Total nursing care / resident Info This home is ranked 85th out of 203 homes in Ohio for nurse hours. Total adjusted nursing hours per resident per day, combining RN, LPN, and aide time. CMS adjusts this for case-mix so facilities can be fairly compared.
3h 34m per day
Rank #85 / 203Nurse hours — State benchmarkedThis home is ranked 85th out of 203 homes in Ohio for nurse hours. Shows adjusted nurse hours per resident per day benchmarked to the Ohio average, with a ranking across 203 Ohio SNFs. More hours mean more direct care. The national average is about 3.5 hrs; below 3.0 is a red flag.Click the rank badge to see the full State ranking.Click here to see the full State ranking.
This facility Ohio avg (3h 50m per day)
vs Ohio avg
-7%

1 of 1 metrics below state avg

Staff typeHours / Day / Residentvs state avg
Weekend Total Nursing Info Combined nursing hours (RN + LPN + Nurse Aide) per resident per day on weekends. Staffing often drops on weekends — this figure reveals whether the facility maintains adequate coverage outside of weekday hours. 3h 9m per day ▼ 4% State avg: 3h 17m per day · National avg: 3h 25m per day

Capacity and availability

This home usually has availability

Lower occupancy than the Ohio average: 78.7%
Occupancy rate
58.3% Rank #180 / 204Occupancy rate — State benchmarkedThis home is ranked 180th out of 204 homes in Ohio for occupancy rate. Shows this facility's occupancy rate versus the Ohio average, with its Statewide rank out of 204. Higher occupancy signals strong local demand and financial stability.Click the rank badge to see the full State ranking.Click here to see the full State ranking.
Avg. Length of Stay
154 days
Bed community size
45-bed community Rank #249 / 323Bed count — State benchmarkedThis home is ranked 249th out of 323 homes in Ohio for bed count. Shows this facility's certified or reported bed count compared to other Ohio SNFs. Larger communities may offer more amenities, programs, and on-site services for residents and families.Click the rank badge to see the full State ranking.Click here to see the full State ranking.
A moderately sized community that may balance personal attention with shared amenities and social activities.
Walk Score
Walk Score: 61 / 100 Rank #140 / 705Walk Score — State benchmarkedThis home is ranked 140th out of 705 homes in Ohio for walk score. Shows how walkable this facility's neighborhood is compared to the average Walk Score across Ohio SNFs. Higher scores benefit residents, families, and staff.Click the rank badge to see the full State ranking.Click here to see the full State ranking.
Moderately walkable. Some errands can be accomplished on foot, with a mix of nearby amenities.

About this community

License Details

Facility TypeResidential Care Facility
StatusActive
CountyWayne

Safety & Compliance

Wheelchair Accessible
Emergency SystemsYes
Safety FeaturesEmergency call system available.

Payment & Insurance

1 service
Accept Medicaid

Staffing & Medical

1 service
24-Hour Staffing

Contact Information

Fax(330) 930-0261

Additional Policies & Features

Admission CriteriaResidents must be 62 years or older.
Minimum Age62
HousekeepingYes
Linen ServiceYes
Utilities IncludedYes

Amenities & Lifestyle

Meals
Housekeeping
Medication Administration
Social Events
Exercise Equipment
Salon Services
Podiatry Services
Therapy Services
ActivitiesPlanned social events and activities are offered.
Specific ProgramsIndependent HUD Housing
Religious ServicesYes
Touring HoursMonday - Friday 9:00 AM - 5:00 PM

Dining & Nutrition

Food DescriptionMeals are provided as part of the services.

Contact Orrvilla Maple Terrace

Inspection History

In Ohio, the Department of Health, Bureau of Survey and Certification conducts unannounced onsite inspections to evaluate the quality of care and environment in all licensed facilities.

Inspection Scorecard Info This scorecard compares key inspection, citation, and complaint metrics at this facility against the Ohio state average. Metrics rated ≥15% worse than average are highlighted in red; those ≥15% better are highlighted in green.

Overall vs. OH average 0 Worse No metrics in this bucket. 1 Better Metrics better than Ohio average:
• Total citations (100% below)
Latest Inspection July 17, 2025

Citations Info Citations are formal regulatory issues recorded during state inspections.

This FacilityOH Averagevs. OH Avg
Total citations Info Formal regulatory issues recorded by inspectors across all inspection types. 02 This facility has 100% fewer total citations than a typical Ohio nursing home (0 vs. OH avg 2).↓ 100% better

Health Inspection History

Inspections since 2019
Total health inspections 10

Ohio average 6.7


Last Health inspection on Sep 2025

Total health citations
36 Rank #135 / 203Health citations — State benchmarkedThis home is ranked 135th out of 203 homes in Ohio for health citations. Shows this facility's total health deficiency citations benchmarked to the Ohio State average, with a ranking across all 203 OH SNFs. Lower citation counts earn a better rank.Click the rank badge to see the full State ranking.Click here to see the full State ranking.

Ohio average 30.9

Citations per inspection
3.6 Rank #72 / 203Citations per inspection — State benchmarkedThis home is ranked 72nd out of 203 homes in Ohio for citations per inspection. Shows average deficiency citations per CMS inspection for this facility versus the Ohio mean across 203 SNFs with citation data. Lower is better.Click the rank badge to see the full State ranking.Click here to see the full State ranking.

Ohio average 4.59


Health citations are formal notices following inspections when they fail to comply with safety and care standards.

14 of 36 citations resulted from standard inspections; and 22 of 36 resulted from complaint investigations.

Breakdown of citation severity (last 7 years)
Critical health citations
2
567% worse than Ohio average

Ohio average: 0.3


Serious health citations
3
233% worse than Ohio average

Ohio average: 0.9

2 critical citations Ohio average: 0.3

3 serious citations Ohio average: 0.9

30 moderate citations Ohio average: 29

1 minor citation Ohio average: 0.7
Citations history (last 7 years)
Quality of Care serious citation Sep 25, 2025
Corrected

Care Planning moderate citation Sep 25, 2025
Corrected

Resident Rights moderate citation Sep 25, 2025
Corrected

Abuse/Neglect moderate citation Jun 03, 2025
Corrected

Staffing Data

Reporting period: October 1 – December 31, 2025 (Q4 2025). Source: CMS Payroll-Based Journal report.

Total staff 106
Employees 67
Contractors 39
Staff to resident ratio 3.66 : 1
79% more staff per resident than Ohio average
Ohio average ratio: 2.04 : 1 Ohio average ratio: 2.04 : 1See full Ohio ranking
Avg staff/day 24
Average shift 7.2 hours
11% worse than Ohio average
Ohio average: 8.1 hours Ohio average shift: 8.1 hoursSee full Ohio ranking
Total staff hours (quarter) 15,835

Nursing staff breakdown

Q4 2025 · Oct 1 – Dec 31 More info This data comes from the CMS Payroll-Based Journal report covering October 1 – December 31, 2025.
Registered Nurse

Manages medical care and health needs.

RN Staff Info 15 total: 2 full-time employees and 13 contractors. 15
Average shift length Info Average shift length. Calculated as total hours divided by days worked and average staff per day. 10.1 hours
Licensed Practical Nurse

Assists with medical care and medications.

LPN Staff Info 23 total: 11 full-time employees and 12 contractors. 23
Average shift length Info Average shift length. Calculated as total hours divided by days worked and average staff per day. 9.1 hours
Certified Nursing Assistant

Helps with daily care and mobility.

CNA Staff Info 25 total: 24 full-time employees and 1 contractor. 25
Average shift length Info Average shift length. Calculated as total hours divided by days worked and average staff per day. 7.2 hours

Contractor staffing

Q4 2025 · Oct 1 – Dec 31 More info This data comes from the CMS Payroll-Based Journal report covering October 1 – December 31, 2025.

Total hours from contractors

16.1%

2,557 contractor hours this quarter

Registered Nurse: 13 Licensed Practical Nurse: 12 Occupational Therapy Aide: 7 Clinical Nurse Specialist: 2 Nurse Practitioner: 2 Certified Nursing Assistant: 1 Medical Director: 1 Occupational Therapy Assistant: 1

Staff by category

Q4 2025 · Oct 1 – Dec 31 More info This data comes from the CMS Payroll-Based Journal report covering October 1 – December 31, 2025.
Certified Nursing Assistant241256,36792100%7.2
Licensed Practical Nurse1112233,18892100%9.1
Registered Nurse213151,4708896%10.1
Other Dietary Services Staff6061,2688795%6
Speech Language Pathologist4046056975%5.6
RN Director of Nursing2026006975%7.1
Clinical Nurse Specialist1235896571%8.9
Nurse Practitioner0225196773%7.7
Physical Therapy Aide3034026571%6.2
Administrator1013544246%8.4
Dental Services Staff2021872628%7.2
Occupational Therapy Aide077741820%3.9
Respiratory Therapy Technician303692628%2.7
Medical Director011501314%3.8
Qualified Social Worker202393336%1.2
Physical Therapy Assistant505383336%1.1
Occupational Therapy Assistant0111633%5.3
Nurse Aide in Training101211%2
25 Certified Nursing Assistant
% of Days 100%
23 Licensed Practical Nurse
% of Days 100%
15 Registered Nurse
% of Days 96%
6 Other Dietary Services Staff
% of Days 95%
4 Speech Language Pathologist
% of Days 75%
2 RN Director of Nursing
% of Days 75%
3 Clinical Nurse Specialist
% of Days 71%
2 Nurse Practitioner
% of Days 73%
3 Physical Therapy Aide
% of Days 71%
1 Administrator
% of Days 46%
2 Dental Services Staff
% of Days 28%
7 Occupational Therapy Aide
% of Days 20%
3 Respiratory Therapy Technician
% of Days 28%
1 Medical Director
% of Days 14%
2 Qualified Social Worker
% of Days 36%
5 Physical Therapy Assistant
% of Days 36%
1 Occupational Therapy Assistant
% of Days 3%
1 Nurse Aide in Training
% of Days 1%

Penalties and fines

Includes penalties issued in 2024-2025

Federal penalties imposed by CMS for regulatory violations, including civil money penalties (fines) and denials of payment for new Medicare/Medicaid admissions.

Source: CMS Penalties Database (Data as of Jan 2026)

Total fines amount $95K Rank #185 / 203Federal fines — State benchmarkedThis home is ranked 185th out of 203 homes in Ohio for federal fines. Shows this facility's cumulative CMS federal fine dollars versus the Ohio average among facilities with fines, and where it ranks among 203 skilled nursing facilities in the pool. Lower total dollars mean a better rank.Click the rank badge to see the full State ranking.Click here to see the full State ranking.
38% higher than Ohio average

Ohio average: $69K

Number of fines 2
8% more fines than Ohio average

Ohio average: 1.9

Payment Denials Info Serious action where Medicare and/or Medicaid temporarily stops payments for new residents until issues are fixed. 0
100% fewer payment denials than Ohio average

Ohio average: 0.5

Fines amount comparison
This facility $95K
Ohio average $69K
Penalty History

Penalties are imposed by CMS for violations of federal nursing home regulations.

2 penalties in the past 3 years

Multiple penalties were reported in the last 3 years.

Civil Money Penalty Info Fines imposed for noncompliance, which can be assessed per day or per instance of violation. May 20, 2025
$27K
Civil Money Penalty Info Fines imposed for noncompliance, which can be assessed per day or per instance of violation. Jun 13, 2024
$69K

Last updated: Jan 2026

Quality of care over time

These measures show how residents usually do over time at this home, based on health outcomes and preventive care.

High-risk clinical events score Info A composite score based on pressure ulcers, falls with injury, weight loss, walking ability decline, and activities of daily living decline. 6.7
14% worse than Ohio average

Ohio average: 5.8

Functional decline score Info A composite score based on activities of daily living decline, walking ability decline, and incontinence. 15.0
19% worse than Ohio average

Ohio average: 12.7

Long-stay resident measures
Need for Help with Daily Activities Increased Info Percent of long-stay residents whose need for help with daily activities has increased 5.7%
17% better than Ohio average

Ohio average: 6.8%

Walking Ability Worsened Info Percent of long-stay residents whose ability to move independently worsened 10.9%
22% worse than Ohio average

Ohio average: 8.9%

Low Risk Residents with Bowel/Bladder Incontinence Info Percent of low risk long-stay residents who lose control of their bowels or bladder 28.5%
30% worse than Ohio average

Ohio average: 22.0%

Falls with Major Injury Info Percent of long-stay residents experiencing one or more falls with major injury 0.9%
75% better than Ohio average

Ohio average: 3.4%

High Risk Residents with Pressure Ulcers Info Percent of long-stay high risk residents with pressure ulcers 6.4%
64% worse than Ohio average

Ohio average: 3.9%

Urinary Tract Infection Info Percent of long-stay residents with a urinary tract infection 0.0%
100% better than Ohio average

Ohio average: 0.5%

Lost Too Much Weight Info Percent of long-stay residents who lose too much weight 9.4%
52% worse than Ohio average

Ohio average: 6.2%

Depressive Symptoms Info Percent of long-stay residents who have depressive symptoms 12.9%
46% better than Ohio average

Ohio average: 24.0%

Antipsychotic Use Info Percent of long-stay residents who received an antipsychotic medication 8.3%
In line with Ohio average

Ohio average: 8.4%

Pneumococcal Vaccine Info Percent of long-stay residents assessed and appropriately given the pneumococcal vaccine 86.3%
7% worse than Ohio average

Ohio average: 92.4%

Influenza Vaccine Info Percent of long-stay residents assessed and appropriately given the seasonal influenza vaccine 94.1%
In line with Ohio average

Ohio average: 94.5%

Short-stay resident measures
Pneumococcal Vaccine Info Percent of short-stay residents assessed and appropriately given the pneumococcal vaccine 76.1%
In line with Ohio average

Ohio average: 78.0%

Antipsychotic medication increase Info Percent of short-stay residents who newly received an antipsychotic medication 4.0%
210% worse than Ohio average

Ohio average: 1.3%

Influenza Vaccine Info Percent of short-stay residents assessed and appropriately given the seasonal influenza vaccine 78.9%
In line with Ohio average

Ohio average: 75.6%

Breakdown by payment type

Medicare

22% of new residents, usually for short-term rehab.

Typical stay 1 - 2 months

Private pay

39% of new residents, often for short stays.

Typical stay 4 months

Medicaid

39% of new residents, often for long-term daily care.

Typical stay 8 - 9 months

Facility Characteristics

Source: CMS Long-Term Care Facility Characteristics (Data as of Jan 2026)

Total residents 29
Medicare
2
6.9% of residents
Medicaid
23
79.3% of residents
Private pay or other
4
13.8% of residents
Programs & Services
Residents Group

Residents meet regularly to discuss policies, care quality, and activities

Active Resident Council

Organized group of residents that meets regularly to discuss facility policies, quality of life, and activities.

Finances and operations

Privately-owned community
Operated by a partnership between two or more business owners.
Home revenue
$4.5M
Operating loss
-$66.6K
Privately-owned community Operated by a partnership between two or more business owners.
Home revenue
$4.5M Rank #190 / 203Revenue — State benchmarkedThis home is ranked 190th out of 203 homes in Ohio for revenue. Shows this facility's annual revenue compared to the Ohio SNF average. Higher revenue generally means more resources for staffing and capital — read alongside Payroll %.Click the rank badge to see the full State ranking.Click here to see the full State ranking.
Operating loss
-$66.6K
Payroll costs Info The portion of the home's budget spent on staff, including nurses, caregivers, and other employees who support care and operations. Rank #198 / 203Payroll — State benchmarkedThis home is ranked 198th out of 203 homes in Ohio for payroll. Shows total annual staff payroll benchmarked to the Ohio average. Higher payroll investment relative to peers often signals better staffing and less reliance on cheaper contract labor.Click the rank badge to see the full State ranking.Click here to see the full State ranking.
$2.2M
49.7% of revenue Rank #105 / 203Payroll % — State benchmarkedThis home is ranked 105th out of 203 homes in Ohio for payroll %. Shows payroll as a percentage of revenue versus the Ohio average. Well-run Ohio SNFs typically land around 54–64% — the top third Statewide. Below 25% may signal understaffing or heavy agency use — read with Staffing ratings.Click the rank badge to see the full State ranking.Click here to see the full State ranking.
Other operating costs Info All remaining costs needed to run the home, such as food, utilities, building maintenance, supplies and administrative expenses.
$2.3M
Total costs $4.6M

Who this home usually serves

TYPE OF STAY

Mostly long-term care residents

Most residents stay for extended periods and receive ongoing daily care.

Places of interest near Orrvilla Maple Terrace

Address 0.0 miles from city center Info Estimated distance in miles from Orrville's city center to Orrvilla Maple Terrace's address, calculated via Google Maps.

Calculate Travel Distance to Orrvilla Maple Terrace

Add your location

Address

Financial Assistance for
Nursing Home in Ohio

Orrvilla Maple Terrace is located in ORRVILLE, Ohio.
Here are the financial assistance programs available to residents in Ohio.

Get Financial aid guidance

PASSPORT Waiver

Ohio Medicaid PASSPORT

Age 60+
General Ohio resident, Medicaid-eligible, nursing home-level care need.
Income Limits (2025) ~$2,829/month 300% FBR, individual
Asset Limits $2,000 (individual), $3,000 (couple).
OH

Administered through regional agencies; waitlists possible.

Benefits
Personal care (5-7 hours/day) Respite (240 hours/year) Adult day care ($65/day) Home modifications ($1,500 avg.)

Ohio Home Care Program (non-Medicaid)

OH HCP

Age 60+
General Ohio resident, at risk of decline.
Income Limits ~$2,000/month individual, varies
Asset Limits $5,000 individual
OH

Limited funding; regional variation.

Benefits
In-home care (3-5 hours/week) Respite (up to 10 days/year) Transportation (~5 trips/month)

Assisted Living Waiver (ALW)

Ohio Assisted Living Waiver

Age 21+ (65+ prioritized)
General OH resident, Medicaid-eligible, NFLOC.
Income Limits (2025) ~$2,829/month (individual); QIT required.
Asset Limits $2,000 (individual), $3,000 (couple).
OH

Covers ~300 facilities; room/board not included (separate cost).

Benefits
Personal care Meals Medication management Transportation (~$3,000-$4,000/month value)

Program of All-Inclusive Care for the Elderly (PACE)

Ohio PACE (e.g., McGregor PACE)

Age 55+
General OH resident (specific counties), NFLOC, safe with PACE support.
Income Limits (2025) ~$2,829/month (Medicaid-eligible); private pay option available.
Asset Limits $2,000 (individual), $3,000 (couple) for Medicaid enrollees.
OH

Available in 9 counties (e.g., Cuyahoga, Franklin); expanding via Healthy Aging Grants.

Benefits
Personal care (5-7 hours/day) Medical care Meals Transportation Respite Therapies

Medicare Savings Program (MSP)

Ohio Medicare Savings Program

Age 65+ or disabled
General OH resident, Medicare Part A/B.
Income Limits (2025) ~$2,510/month (QMB), ~$3,380/month (SLMB), ~$3,598/month (QI)—individual.
Asset Limits $9,430 (individual), $14,130 (couple).
OH

Three tiers; includes Extra Help for Part D; no waitlist.

Benefits
Covers Part B premiums ($174.70/month) Deductibles ($240/year) Copays (~20%)

Home Energy Assistance Program (HEAP)

Ohio HEAP

Age 60+ prioritized
General OH resident, low-income household.
Income Limits (2025) ~$3,970/month individual, 185% FPL
Asset Limits Not assessed; income-focused.
OH

Covers gas, electric, oil; emergency aid via Winter/Summer Crisis Programs.

Benefits
Heating/cooling aid ($300-$1,000/season) Emergency aid ($500 max)

Family Caregiver Support Program (FCSP)

Ohio Family Caregiver Support Program

Age
General Caregivers of 60+ needing care or 55+ caregivers of others; OH resident; functional needs (2+ ADLs).
Income Limits (2025) Prioritizes ~$24,980/year (individual); no strict cap.
Asset Limits Not assessed; need-based.
OH

12 AAAs; rural/low-income priority; volunteer respite option.

Benefits
Respite (4-6 hours/week or 5 days/year) Adult day care ($60/day) Training Supplies (~$500/year)

VA Aid and Attendance (A&A) and Housebound Benefits

Ohio VA Aid and Attendance/Housebound

Age 65+ or disabled veteran/spouse
General OH resident, wartime service, need for ADL help (A&A) or homebound.
Income Limits (2025) Net income < ~$1,984/month (veteran with dependent, A&A); pension offsets income.
Asset Limits ~$155,356 net worth limit
OH

High veteran demand; supports care in multiple settings.

Benefits
Cash (~$1,433-$2,642/month veteran, ~$951-$1,318 spouse) for care costs (e.g., in-home, assisted living)

Homestead Exemption

Ohio Homestead Exemption

Age 65+ (or disabled)
General OH resident, homeowner, low-income.
Income Limits (2025) ~$38,500/year individual, adjusted annually
Asset Limits Not assessed; home ownership required.
OH

Reduces taxable value by $25,000; applies to primary residence.

Benefits
Tax reduction (~$400-$800/year avg., varies by county)

Save the Dream Ohio (Homeowner Assistance Fund)

Ohio Save the Dream

Age 60+ prioritized
General OH resident, homeowner, hardship post-Jan 21, 2020.
Income Limits (2025) ~$147,600/year family of 4, 150% AMI; varies by county
Asset Limits Not assessed; hardship-focused.
OH

Covers delinquent mortgages, utilities, taxes; max $25,000 mortgage aid.

Benefits
Mortgage aid ($25,000 max) Utility/property tax aid ($5,000 avg.)

Compare Nursing Home around Ohio

The information below is reported by the Ohio Department of Health, Bureau of Survey and Certification.

5 facilities compared · CMS & OH Dept. of Health data

Filter by care type
Brookdale Westlake Village
NH

Nursing Home Licensed facility providing 24/7 skilled nursing care for residents with complex, ongoing medical needs. Staffed by RNs, LPNs, and CNAs. Inspected and star-rated annually by CMS. Accepts Medicare (short-term rehab) and Medicaid (long-term care).

AL

Assisted Living A licensed, long-term care setting for seniors or individuals with disabilities who need help with daily activities — like bathing, dressing, and medication management — but not 24-hour skilled nursing. Offers housing, meals, and around-the-clock support while aiming to maximize resident independence.

IL

Independent Living Lifestyle-focused communities for older adults offering dining, activities, and transportation with minimal personal care. Best for active, independent seniors who want community without medical support.

MC

Memory Care Secured, specialized care for people living with Alzheimer's or dementia. Staff trained in cognitive impairment, with higher staff-to-resident ratios and an environment designed to reduce confusion and wandering risk.

Westlake
357
Facility 357
OH AVG 80
Rank #1 / 323
--4.38 +18%+24%$051.3-58A+
25
Facility 25
OH AVG 40
Rank #501 / 705
Labeed Diab$13.1M$10.2M78.4%366373
Meadow Grove Transitional Care
NH

Nursing Home Licensed facility providing 24/7 skilled nursing care for residents with complex, ongoing medical needs. Staffed by RNs, LPNs, and CNAs. Inspected and star-rated annually by CMS. Accepts Medicare (short-term rehab) and Medicaid (long-term care).

AL

Assisted Living A licensed, long-term care setting for seniors or individuals with disabilities who need help with daily activities — like bathing, dressing, and medication management — but not 24-hour skilled nursing. Offers housing, meals, and around-the-clock support while aiming to maximize resident independence.

IL

Independent Living Lifestyle-focused communities for older adults offering dining, activities, and transportation with minimal personal care. Best for active, independent seniors who want community without medical support.

MC

Memory Care Secured, specialized care for people living with Alzheimer's or dementia. Staff trained in cognitive impairment, with higher staff-to-resident ratios and an environment designed to reduce confusion and wandering risk.

Grove City (Blue Star Drive)
99
Facility 99
OH AVG 80
Rank #81 / 323
96.0% +22%2.98 +4%-16%$0204.0-92A+
1
Facility 1
OH AVG 40
Rank #674 / 705
Valerie Kettell$13.4M$6.1M45.2%366446
Cottingham Retirement Community
NH

Nursing Home Licensed facility providing 24/7 skilled nursing care for residents with complex, ongoing medical needs. Staffed by RNs, LPNs, and CNAs. Inspected and star-rated annually by CMS. Accepts Medicare (short-term rehab) and Medicaid (long-term care).

AL

Assisted Living A licensed, long-term care setting for seniors or individuals with disabilities who need help with daily activities — like bathing, dressing, and medication management — but not 24-hour skilled nursing. Offers housing, meals, and around-the-clock support while aiming to maximize resident independence.

IL

Independent Living Lifestyle-focused communities for older adults offering dining, activities, and transportation with minimal personal care. Best for active, independent seniors who want community without medical support.

MC

Memory Care Secured, specialized care for people living with Alzheimer's or dementia. Staff trained in cognitive impairment, with higher staff-to-resident ratios and an environment designed to reduce confusion and wandering risk.

Cincinnati (Sharonville)
128
Facility 128
OH AVG 80
Rank #40 / 323
45.3% -42%2.78 -48%-21%$20.8k223.7258A+
53
Facility 53
OH AVG 40
Rank #223 / 705
-$9.0M$4.2M46%365652
Laurels of Norworth
NH

Nursing Home Licensed facility providing 24/7 skilled nursing care for residents with complex, ongoing medical needs. Staffed by RNs, LPNs, and CNAs. Inspected and star-rated annually by CMS. Accepts Medicare (short-term rehab) and Medicaid (long-term care).

AL

Assisted Living A licensed, long-term care setting for seniors or individuals with disabilities who need help with daily activities — like bathing, dressing, and medication management — but not 24-hour skilled nursing. Offers housing, meals, and around-the-clock support while aiming to maximize resident independence.

HC

Home Care Professional care delivered in the person's own home — from companionship and errands to skilled nursing and therapy. Allows seniors to age in place. Medicare covers skilled home health when medically necessary.

MC

Memory Care Secured, specialized care for people living with Alzheimer's or dementia. Staff trained in cognitive impairment, with higher staff-to-resident ratios and an environment designed to reduce confusion and wandering risk.

Worthington (Worthington Estates East)
126
Facility 126
OH AVG 80
Rank #42 / 323
84.1% +7%3.62 +18%+2%$51.9k454.53111A+
50
Facility 50
OH AVG 40
Rank #254 / 705
Thomas Widney$16.1M$8.4M52.1%365222
Orrvilla Maple Terrace
NH

Nursing Home Licensed facility providing 24/7 skilled nursing care for residents with complex, ongoing medical needs. Staffed by RNs, LPNs, and CNAs. Inspected and star-rated annually by CMS. Accepts Medicare (short-term rehab) and Medicaid (long-term care).

AL

Assisted Living A licensed, long-term care setting for seniors or individuals with disabilities who need help with daily activities — like bathing, dressing, and medication management — but not 24-hour skilled nursing. Offers housing, meals, and around-the-clock support while aiming to maximize resident independence.

Orrville
45
Facility 45
OH AVG 80
Rank #249 / 323
--3.56 +54%+1%$95.3k363.6539-
61
Facility 61
OH AVG 40
Rank #140 / 705
-$4.5M$2.2M49.7%366171

Frequently Asked Questions about Orrvilla Maple Terrace

Is Orrvilla Maple Terrace in a walkable area?

Orrvilla Maple Terrace has a walk score of 61. Moderately walkable. Some errands can be accomplished on foot, with a mix of nearby amenities.

What is the best email address for Orrvilla Maple Terrace?

The team at Orrvilla Maple Terrace can be reached at [email protected].

How many beds does Orrvilla Maple Terrace have?

Orrvilla Maple Terrace has 45 beds.

Has Orrvilla Maple Terrace had any recent deficiencies or citations?

Orrvilla Maple Terrace has no recently reported deficiencies or citations.

Are there photos of Orrvilla Maple Terrace?

Yes — there are 2 photos of Orrvilla Maple Terrace in the photo gallery on this page.

What is the address of Orrvilla Maple Terrace?

Orrvilla Maple Terrace is located at 333 EAST SASSAFRAS STREET.

What is the phone number of Orrvilla Maple Terrace?

(330) 683-4455 will put you in contact with the team at Orrvilla Maple Terrace.

Guides for Better Senior Living

Care Cost Calculator: See Prices in Your Area

Nursing Home Data Explorer

Don’t Wait Too Long: 7 Red Flag Signs Your Parent Needs Assisted Living Now

The True Cost of Assisted Living in 2025 – And How Families Are Paying For It

Understanding Senior Living Costs: Pricing Models, Discounts & Financial Assistance

Explore Open Rooms
1 Contact details
2 What type of senior care service are you looking for?
3 What budget do you have in mind for senior care?
4 How soon do you need to find care?
5 Additional details

Thank you for your interest!

Our team will be in touch shortly to help with next steps.