


Total staff
156
Employees
151
Contractors
5
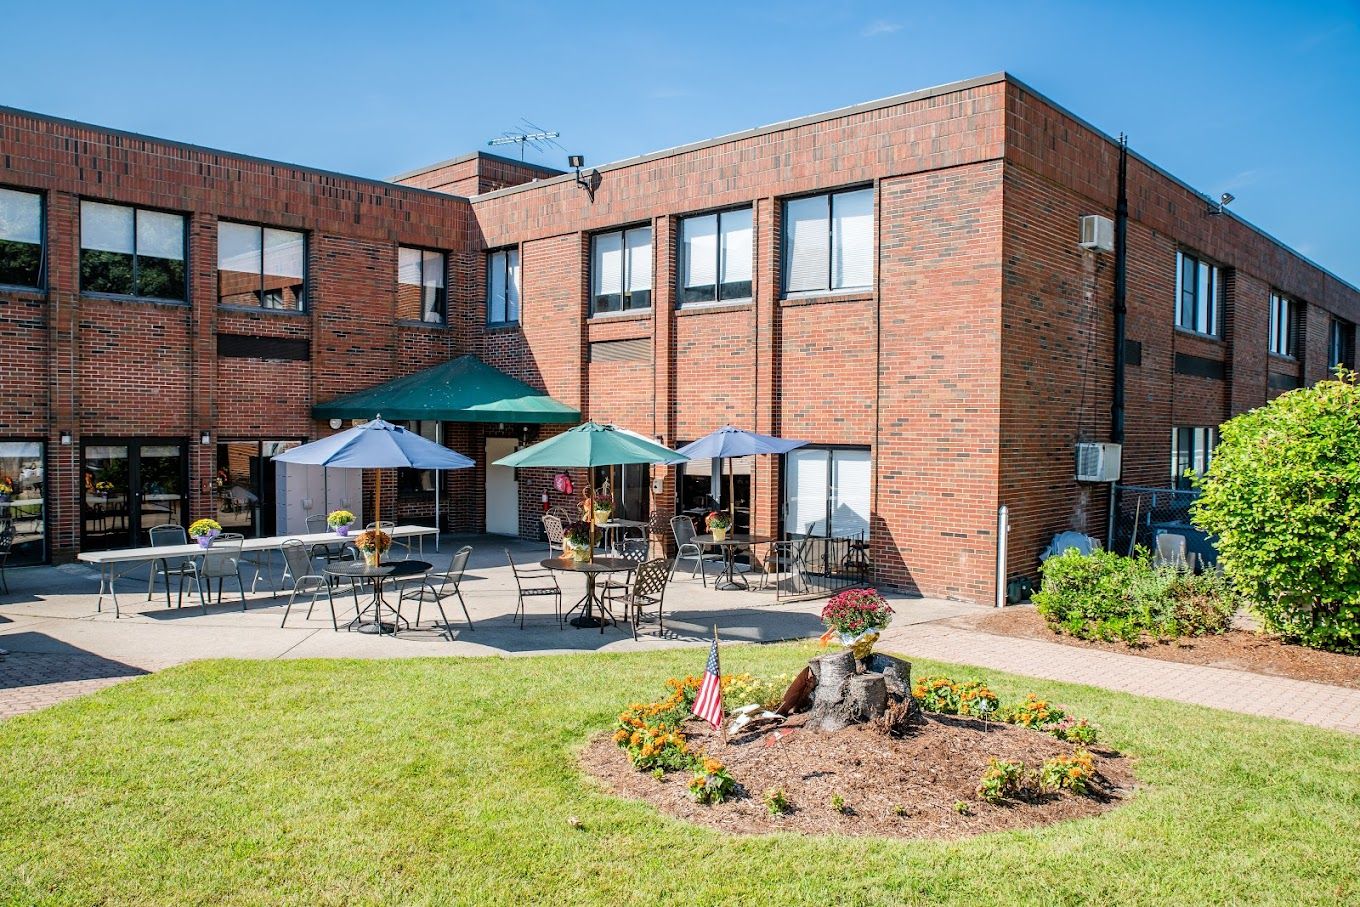
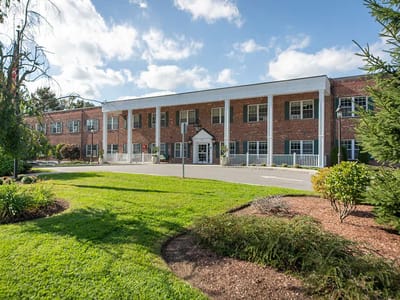

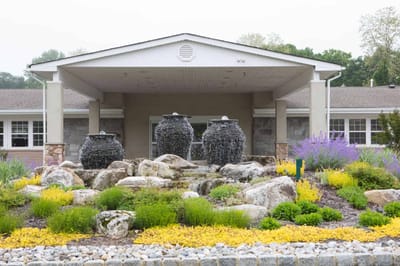

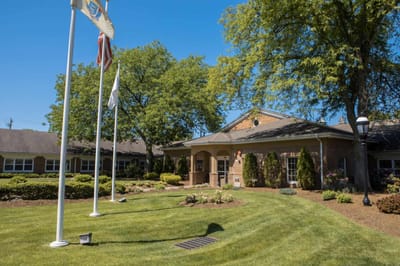
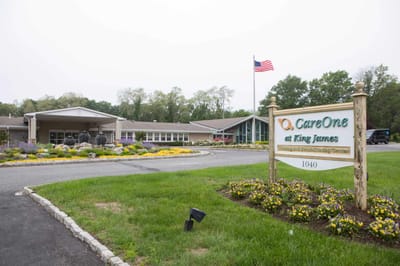
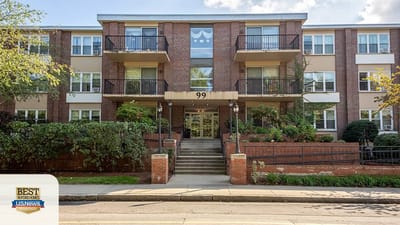
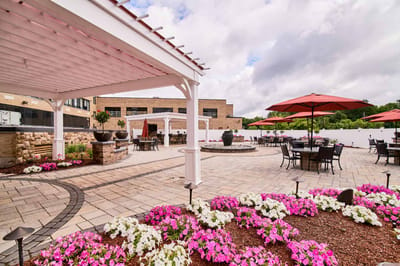
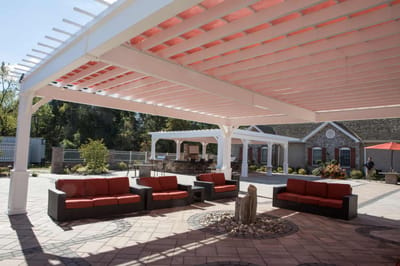

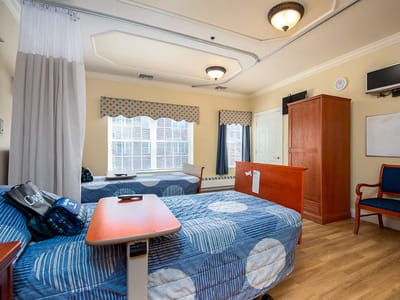
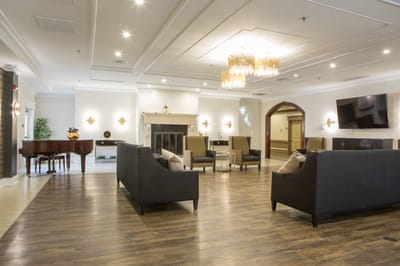
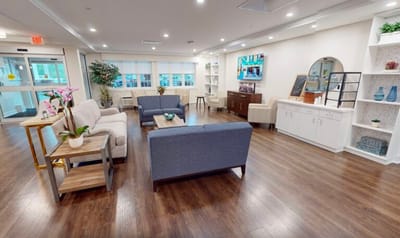


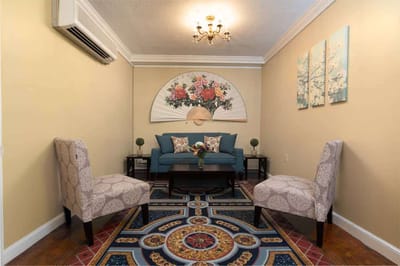
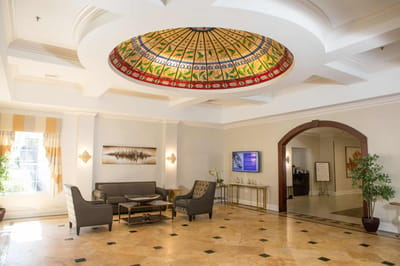
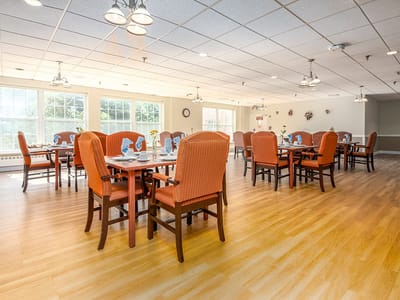
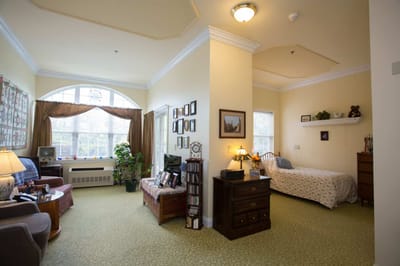
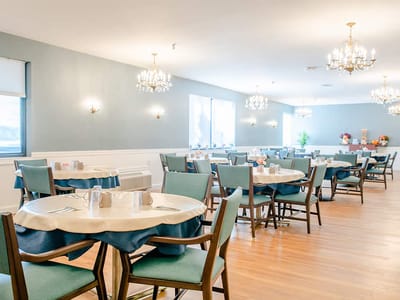
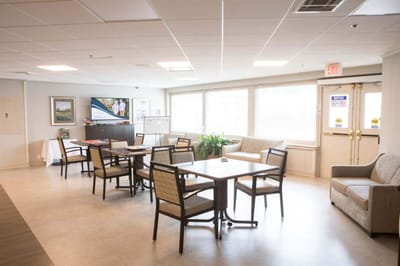

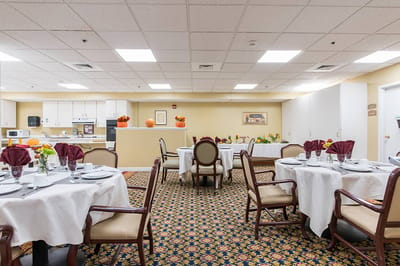
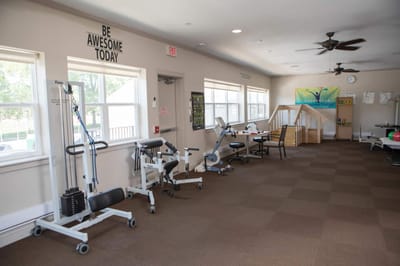
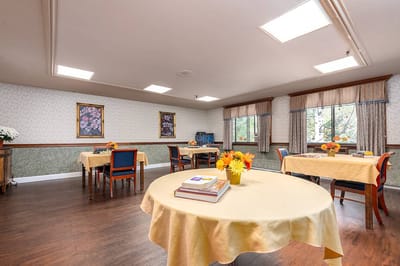
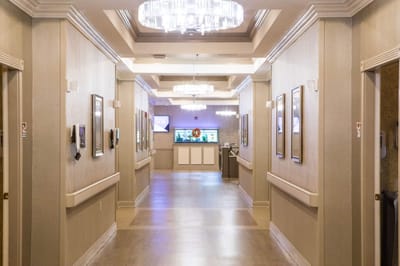
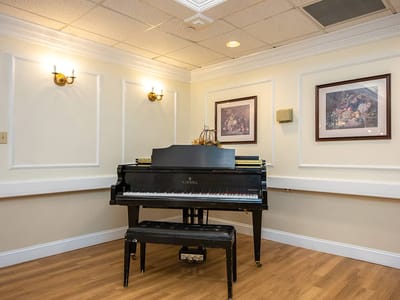
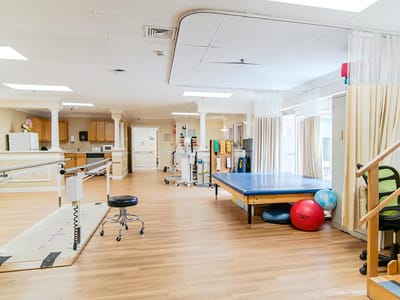
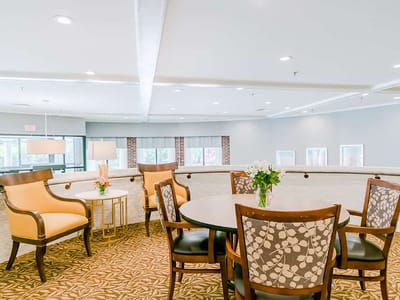
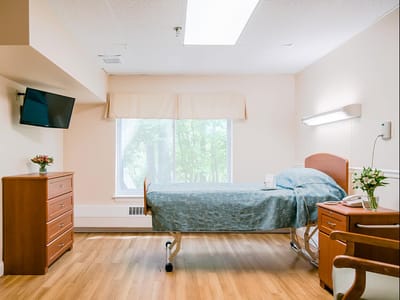
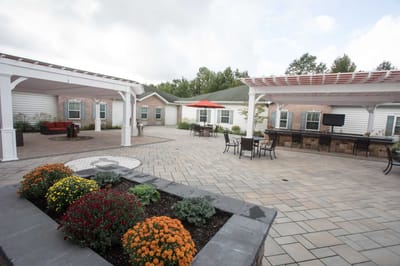
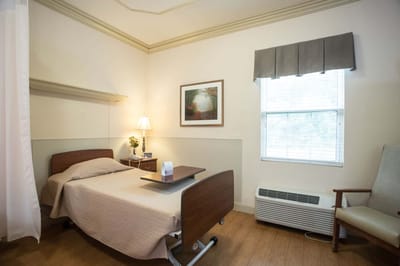

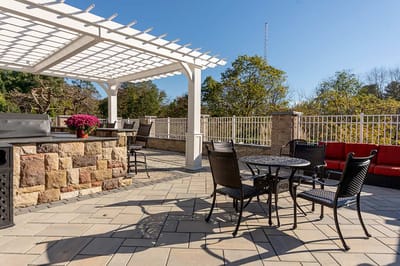

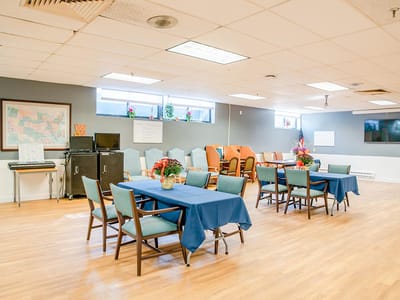


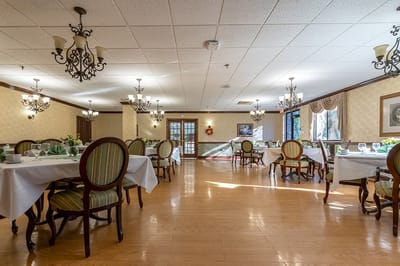


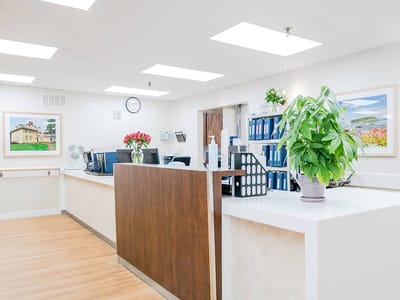
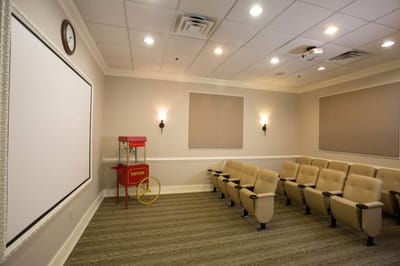
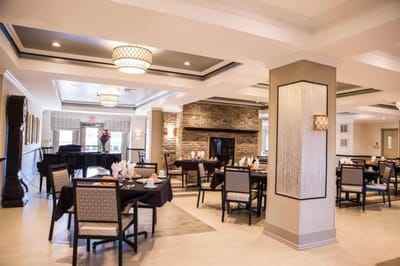
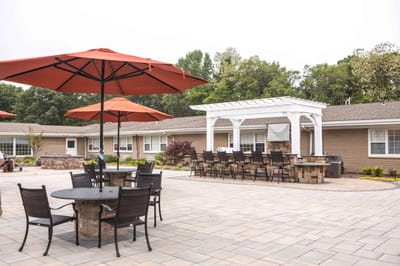
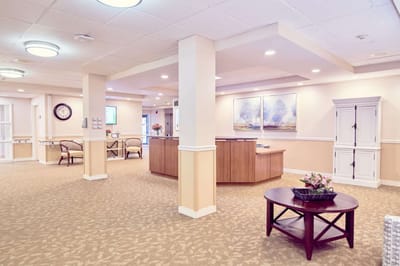
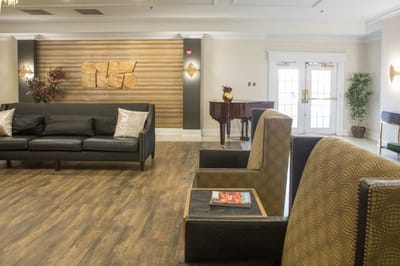
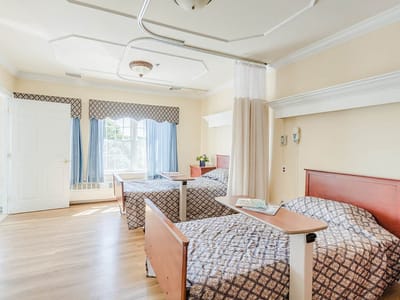
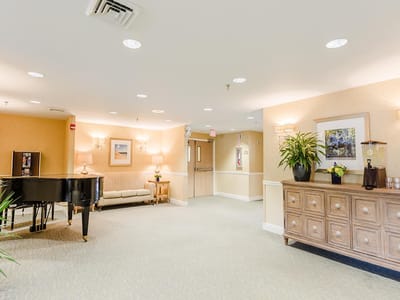
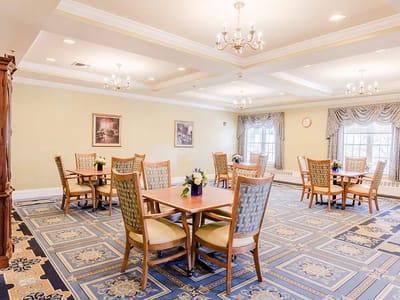
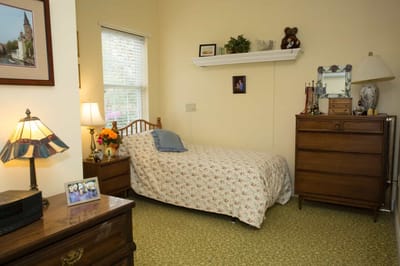

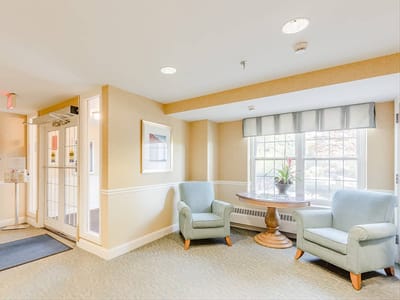

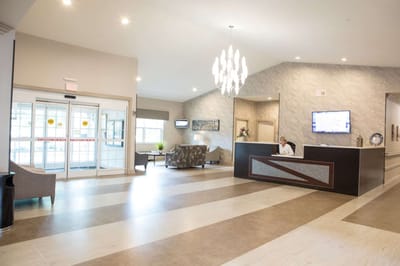
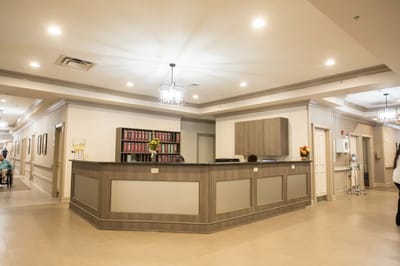

CareOne at Lowell prides itself on achieving a safe and secure community for residents to experience rejuvenation and recovery in a nurturing home. Residents from different living options offer personalized care that allows them to receive the necessary care while promoting an active lifestyle. The results-driven community ensures only the best approach to senior recovery; they have been one of the city’s trusted and affordable nursing homes with independent living, assisted living, and memory care homes.
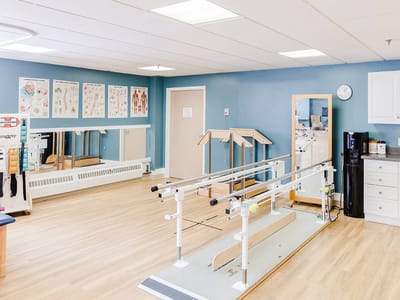
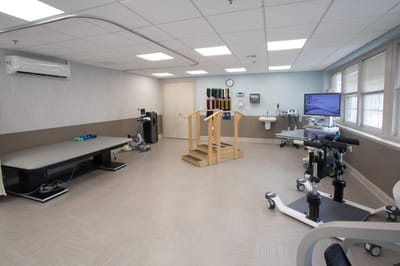
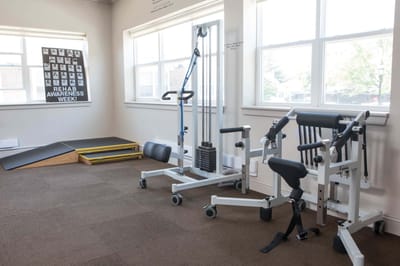
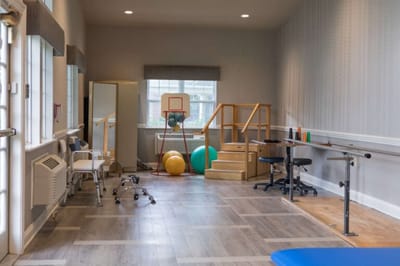
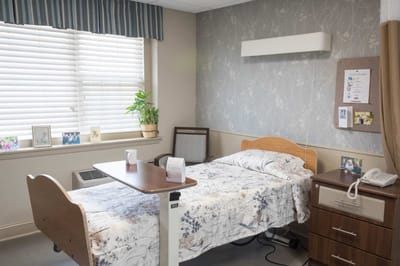
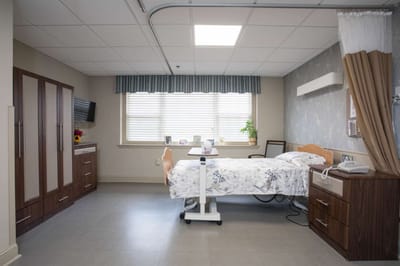
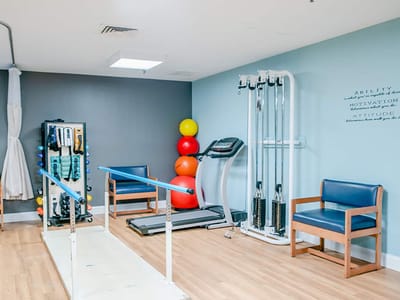
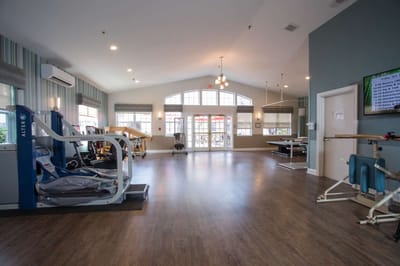
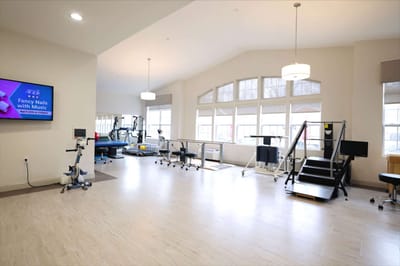
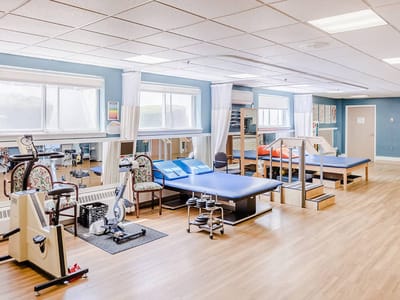
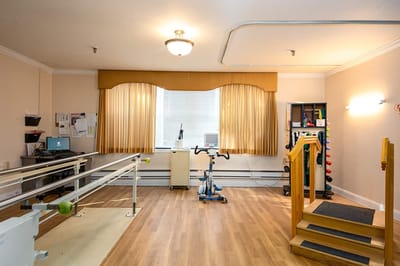
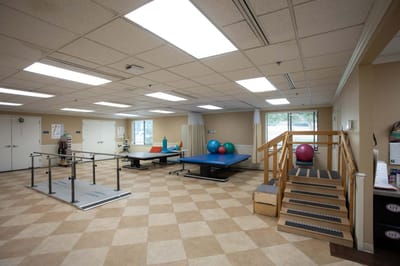
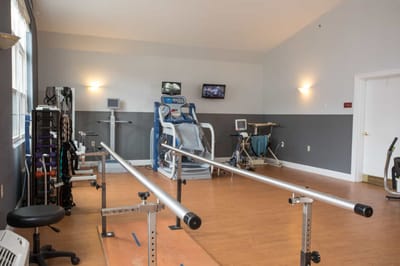
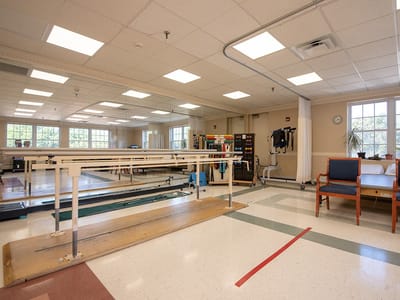
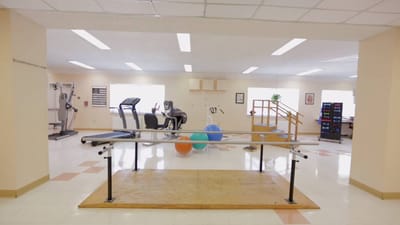
CareOne specializes in post-hospital rehabilitation, other services include therapy (speech, occupational, physical), blood transfusions, respiratory care, post-stroke rehabilitation, diabetes management, and advanced wound care.
| Staff type | Hours / Day / Resident | vs state avg |
|---|---|---|
|
Registered Nurse (RN)
| 16m per day | ▼ 58% State avg: 39m per day · National avg: 41m per day |
|
LPN / LVN
| 1h 13m per day | ▲ 26% State avg: 58m per day · National avg: 52m per day |
|
Nurse Aide
| 2h 19m per day | ■ Avg State avg: 2h 16m per day · National avg: 2h 21m per day |
|
Weekend Total Nursing
| 3h 26m per day | ■ Avg State avg: 3h 27m per day · National avg: 3h 26m per day |
|
Physical Therapist
| 2m per day | ▼ 46% State avg: 4m per day · National avg: 4m per day |
|
Weekend RN
| 10m per day | ▼ 66% State avg: 28m per day · National avg: 29m per day |
Reporting period: October 1 – December 31, 2025 (Q4 2025). Source: CMS Payroll-Based Journal report.
Manages medical care and health needs.
Assists with medical care and medications.
Helps with daily care and mobility.
Total hours from contractors
332 contractor hours this quarter
| Certified Nursing Assistant | 72 | 0 | 72 | 32,048 | 92 | 100% | 8.3 |
| Licensed Practical Nurse | 33 | 0 | 33 | 13,258 | 92 | 100% | 8.4 |
| Other Dietary Services Staff | 14 | 0 | 14 | 4,146 | 92 | 100% | 7.5 |
| RN Director of Nursing | 9 | 0 | 9 | 3,532 | 90 | 98% | 9.4 |
| Registered Nurse | 5 | 0 | 5 | 2,115 | 91 | 99% | 9.9 |
| Clinical Nurse Specialist | 5 | 0 | 5 | 1,130 | 77 | 84% | 8.1 |
| Physical Therapy Assistant | 3 | 0 | 3 | 685 | 64 | 70% | 6.3 |
| Speech Language Pathologist | 2 | 0 | 2 | 536 | 62 | 67% | 7 |
| Respiratory Therapy Technician | 1 | 0 | 1 | 494 | 65 | 71% | 7.6 |
| Nurse Practitioner | 1 | 0 | 1 | 480 | 61 | 66% | 7.9 |
| Qualified Social Worker | 1 | 0 | 1 | 466 | 59 | 64% | 7.9 |
| Administrator | 1 | 0 | 1 | 465 | 60 | 65% | 7.8 |
| Dietitian | 1 | 0 | 1 | 452 | 64 | 70% | 7.1 |
| Dental Services Staff | 1 | 4 | 5 | 370 | 51 | 55% | 6.7 |
| Occupational Therapy Aide | 1 | 0 | 1 | 255 | 35 | 38% | 7.3 |
| Mental Health Service Worker | 1 | 0 | 1 | 158 | 33 | 36% | 4.8 |
| Medical Director | 0 | 1 | 1 | 48 | 3 | 3% | 16 |
Federal penalties imposed by CMS for regulatory violations, including civil money penalties (fines) and denials of payment for new Medicare/Medicaid admissions.
Source: CMS Penalties Database (Data as of Jan 2026)
Massachusetts average: $72K
Massachusetts average: 1.7
Massachusetts average: 0.1
No penalties in the past 3 years
No civil money penalties or payment denials were reported in the last 3 years.
These measures show how residents usually do over time at this home, based on health outcomes and preventive care.
Massachusetts average: 10.2
Massachusetts average: 20.0
Massachusetts average: 18.7%
Massachusetts average: 19.3%
Massachusetts average: 22.1%
Massachusetts average: 3.6%
Massachusetts average: 4.7%
Massachusetts average: 2.1%
Massachusetts average: 5.2%
Massachusetts average: 10.7%
Massachusetts average: 20.3%
Massachusetts average: 91.9%
Massachusetts average: 94.8%
Massachusetts average: 1.86
Massachusetts average: 1.54
Massachusetts average: 76.7%
Massachusetts average: 25.8%
Massachusetts average: 11.8%
Quality measures are calculated from Minimum Data Set (MDS) assessments. For most measures, lower percentages indicate better care quality.
25% of new residents, usually for short-term rehab.
3% of new residents, often for short stays.
73% of new residents, often for long-term daily care.
Source: CMS Long-Term Care Facility Characteristics (Data as of Jan 2026)
Residents meet regularly to discuss policies, care quality, and activities
Organized group of residents that meets regularly to discuss facility policies, quality of life, and activities.
Data sourced from CMS Long-Term Care Facility Characteristics quarterly report. Payer mix reflects the current resident census by primary payment source.
Historical financial and operational data for CareOne at Lowell from 2011–2023, based on CMS SNF Cost Reports.
Key figures below are for fiscal year ending in 12/2023.
Based on CMS SNF Cost Report for fiscal year ending in 12/2023.
Most residents stay for extended periods and receive ongoing daily care.
Most new residents arrive under Medicaid (73% of admissions), and a typical Medicaid stay runs around 1 - 2 years.
Coverage residents most often arrive under.
Coverage residents most often leave under.
![]() 1.8 miles from city center
1.8 miles from city center
![]() Estimated distance in miles from Lowell's city center to CareOne at Lowell's address, calculated via Google Maps.
— 8.5 miles to nearest hospital (Merrimack Health Lawrence Hospital)
Estimated distance in miles from Lowell's city center to CareOne at Lowell's address, calculated via Google Maps.
— 8.5 miles to nearest hospital (Merrimack Health Lawrence Hospital)
Add your location
Info below is compiled from CMS reports & the MA Executive Office of Elder Affairs, senior community websites & trusted data sources such as Walk Score & BBB.
Communities are listed from highest to lowest based on our ranking methodology.
| CareOne at Lowell | NH SNF | Lowell (Centralville) | 160
Facility
160
MA AVG
94
Rank
#22 / 276 |
93.7%
Facility
93.7%
MA AVG
78.3
Rank
#14 / 81 | +20% | 5.04
Facility
5.04
MA AVG
3.93
Rank
#9 / 86 | -75% | +28% | $0
Facility
$0
MA AVG
$76.6k
Rank
#1 / 87 | 27
Facility
27
MA AVG
32.7
Rank
#40 / 86 | 6.8
Facility
6.8
MA AVG
7.2
Rank
#48 / 86 | 1 | 150 | - |
77
Facility
77
MA AVG
53
Rank
#141 / 498 | Thci Of Massachusetts, LLC | $25.0MFiscal year ending 12/2023
Facility
$25.0MFiscal year ending 12/2023
MA AVG
$17.4M
Rank
#10 / 89 | $14.3MFiscal year ending 12/2023
Facility
$14.3MFiscal year ending 12/2023
MA AVG
$6.5M
Rank
#10 / 89 | 57.3%Fiscal year ending 12/2023
Facility
57.3%Fiscal year ending 12/2023
MA AVG
43.6%
Rank
#57 / 89 | 225224 | ||||
| D‘Youville Life and Wellness Community | NH AL HOS IL MC SNF | Lowell (Pawtucketville) | 208
Facility
208
MA AVG
94
Rank
#6 / 276 |
95.0%
Facility
95.0%
MA AVG
78.3
Rank
#6 / 81 | +21% | 3.68
Facility
3.68
MA AVG
3.93
Rank
#52 / 86 | -44% | -6% | $0
Facility
$0
MA AVG
$76.6k
Rank
#1 / 87 | 29
Facility
29
MA AVG
32.7
Rank
#45 / 86 | 5.8
Facility
5.8
MA AVG
7.2
Rank
#40 / 86 | 1 | 198 | - |
19
Facility
19
MA AVG
53
Rank
#425 / 498 | D'youville Leadership Solutions, Inc | $24.2MFiscal year ending 12/2023
Facility
$24.2MFiscal year ending 12/2023
MA AVG
$17.4M
Rank
#9 / 89 | $15.5MFiscal year ending 12/2023
Facility
$15.5MFiscal year ending 12/2023
MA AVG
$6.5M
Rank
#6 / 89 | 64.2%Fiscal year ending 12/2023
Facility
64.2%Fiscal year ending 12/2023
MA AVG
43.6%
Rank
#19 / 89 | 225515 | ||||
| Palm Center | NH HOS PC RC SNF | Chelmsford (North Chelmsford) | 124
Facility
124
MA AVG
94
Rank
#50 / 276 |
88.1%
Facility
88.1%
MA AVG
78.3
Rank
#35 / 81 | +13% | 4.27
Facility
4.27
MA AVG
3.93
Rank
#18 / 86 | +44% | +9% | $8.6k
Facility
$8.6k
MA AVG
$76.6k
Rank
#51 / 87 | 21
Facility
21
MA AVG
32.7
Rank
#28 / 86 | 4.2
Facility
4.2
MA AVG
7.2
Rank
#19 / 86 | 1 | 109 | - |
78
Facility
78
MA AVG
53
Rank
#133 / 498 | Dimitre Sirakov | $13.5M*Fiscal year ending 11/2022These figures are from this home's most recent complete cost report — an older period than most facilities report. Compare with that in mind.
Facility
$13.5M*Fiscal year ending 11/2022These figures are from this home's most recent complete cost report — an older period than most facilities report. Compare with that in mind.
MA AVG
$17.4M
Rank
#39 / 89 | $8.5M*Fiscal year ending 11/2022These figures are from this home's most recent complete cost report — an older period than most facilities report. Compare with that in mind.
Facility
$8.5M*Fiscal year ending 11/2022These figures are from this home's most recent complete cost report — an older period than most facilities report. Compare with that in mind.
MA AVG
$6.5M
Rank
#43 / 89 | 63.1%*Fiscal year ending 11/2022These figures are from this home's most recent complete cost report — an older period than most facilities report. Compare with that in mind.
Facility
63.1%*Fiscal year ending 11/2022These figures are from this home's most recent complete cost report — an older period than most facilities report. Compare with that in mind.
MA AVG
43.6%
Rank
#55 / 89 | 225508 | ||||
| Fairhaven Healthcare Center for Rehabilitation and Nursing | NH HOS MC RC SNF | Lowell (Pawtucketville) | 169
Facility
169
MA AVG
94
Rank
#14 / 276 |
74.0%
Facility
74.0%
MA AVG
78.3
Rank
#56 / 81 | -5% | 4.23
Facility
4.23
MA AVG
3.93
Rank
#22 / 86 | -42% | +8% | $15.0k
Facility
$15.0k
MA AVG
$76.6k
Rank
#62 / 87 | 41
Facility
41
MA AVG
32.7
Rank
#64 / 86 | 6.8
Facility
6.8
MA AVG
7.2
Rank
#48 / 86 | 1 | 125 | A+ |
40
Facility
40
MA AVG
53
Rank
#313 / 498 | Michael Takesian | $12.6MFiscal year ending 12/2023
Facility
$12.6MFiscal year ending 12/2023
MA AVG
$17.4M
Rank
#68 / 89 | $6.7MFiscal year ending 12/2023
Facility
$6.7MFiscal year ending 12/2023
MA AVG
$6.5M
Rank
#67 / 89 | 53.6%Fiscal year ending 12/2023
Facility
53.6%Fiscal year ending 12/2023
MA AVG
43.6%
Rank
#22 / 89 | 225458 | ||||
| RegalCare at Lowell | NH SNF | Lowell (Highlands) | 90
Facility
90
MA AVG
94
Rank
#125 / 276 |
67.4%
Facility
67.4%
MA AVG
78.3
Rank
#65 / 81 | -14% | 3.53
Facility
3.53
MA AVG
3.93
Rank
#65 / 86 | -15% | -10% | $30.5k
Facility
$30.5k
MA AVG
$76.6k
Rank
#70 / 87 | 44
Facility
44
MA AVG
32.7
Rank
#70 / 86 | 8.8
Facility
8.8
MA AVG
7.2
Rank
#64 / 86 | 3 | 61 | - |
69
Facility
69
MA AVG
53
Rank
#177 / 498 | - | $6.7MFiscal year ending 12/2023
Facility
$6.7MFiscal year ending 12/2023
MA AVG
$17.4M
Rank
#88 / 89 | $4.1MFiscal year ending 12/2023
Facility
$4.1MFiscal year ending 12/2023
MA AVG
$6.5M
Rank
#83 / 89 | 60.5%Fiscal year ending 12/2023
Facility
60.5%Fiscal year ending 12/2023
MA AVG
43.6%
Rank
#4 / 89 | 225511 |
CareOne at Lowell is located in Lowell, Massachusetts.
Here are the financial assistance programs available to residents in Massachusetts.
CareOne at Lowell is in the Centralville neighborhood.
CareOne at Lowell has a walk score of 77. Very walkable. Most errands can be accomplished on foot, and many essentials are within a short walk.
CareOne at Lowell's occupancy is 95.1%.
No, CareOne at Lowell has a no-pet policy.
CareOne at Lowell is registered as a for-profit.
Yes — there are 154 photos of CareOne at Lowell in the photo gallery on this page.
CareOne at Lowell is located at 19 Varnum St, Lowell, MA 01850.
Care Cost Calculator: See Prices in Your Area
Nursing Home Data Explorer
Don’t Wait Too Long: 7 Red Flag Signs Your Parent Needs Assisted Living Now
The True Cost of Assisted Living in 2025 – And How Families Are Paying For It
Understanding Senior Living Costs: Pricing Models, Discounts & Financial Assistance


