


Total staff
74
Employees
70
Contractors
4
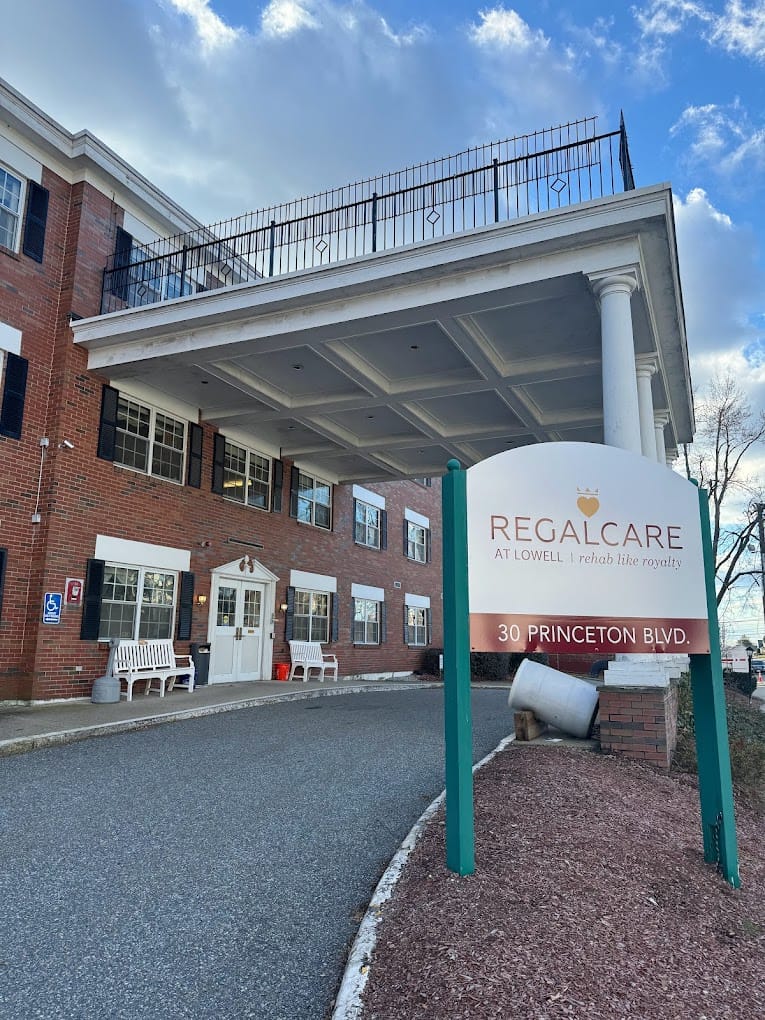

RegalCare at Lowell, a 90-bed nursing home at 30 Princeton Boulevard in Lowell (Middlesex County), Massachusetts, earned a 1-star overall CMS rating. The driving factor is a 1-star health inspection score, placing the facility well below state performance levels. Quality measures run 5.6% below the Massachusetts average.
While reported nursing hours exceed the state average by 33%, the actual staff-to-resident ratio is 1.21:1 and falls 27% short of the state benchmark. This discrepancy reflects an imbalanced staffing model. Critically, certified nursing aide hours, which provide most direct resident assistance, run 22% below the state average of 2 hours 16 minutes per resident per day. CNA shifts average just 6.9 hours, among the shortest in the state.
In March 2025, the facility incurred a $71,000 federal civil money penalty.
Long-stay quality metrics reveal vulnerabilities. Pressure ulcer rates in high-risk residents reach 7.3%, nearly 60% above the state average. Functional decline in activities of daily living affects 24.4% of residents, 31% worse than state norms. Hospital readmission and emergency department utilization both run above state averages, signaling either care management challenges or acuity-driven clinical needs.
Short-stay rehabilitation outcomes perform better than average, with strong discharge self-care outcomes and minimal antipsychotic medication initiation. Urinary tract infection and depression rates are favorable. Occupancy stands at 70.7%, below the Massachusetts average. The facility admits 41% Medicare (short-stay rehab) and 33% Medicaid (long-term), though current resident census is 77% Medicaid.
RegalCare serves a shifting population: historically mixed short-term and long-term, now predominantly long-term Medicaid-supported residents requiring extended skilled care.
| Staff type | Hours / Day / Resident | vs state avg |
|---|---|---|
|
Registered Nurse (RN)
| 32m per day | ▼ 18% State avg: 39m per day · National avg: 41m per day |
|
LPN / LVN
| 1h 7m per day | ▲ 16% State avg: 58m per day · National avg: 52m per day |
|
Nurse Aide
| 1h 44m per day | ▼ 24% State avg: 2h 16m per day · National avg: 2h 21m per day |
|
Weekend Total Nursing
| 3h 5m per day | ▼ 11% State avg: 3h 27m per day · National avg: 3h 26m per day |
|
Physical Therapist
| 6m per day | ▲ 53% State avg: 4m per day · National avg: 4m per day |
|
Weekend RN
| 24m per day | ▼ 14% State avg: 28m per day · National avg: 29m per day |
Reporting period: October 1 – December 31, 2025 (Q4 2025). Source: CMS Payroll-Based Journal report.
Manages medical care and health needs.
Assists with medical care and medications.
Helps with daily care and mobility.
Total hours from contractors
1,068 contractor hours this quarter
| Certified Nursing Assistant | 37 | 0 | 37 | 9,674 | 92 | 100% | 6.9 |
| Licensed Practical Nurse | 17 | 0 | 17 | 6,266 | 92 | 100% | 8 |
| Registered Nurse | 8 | 0 | 8 | 2,227 | 92 | 100% | 8.4 |
| Other Dietary Services Staff | 2 | 0 | 2 | 781 | 85 | 92% | 6.6 |
| Respiratory Therapy Technician | 0 | 2 | 2 | 571 | 76 | 83% | 7.3 |
| Physical Therapy Assistant | 0 | 1 | 1 | 472 | 65 | 71% | 7.3 |
| Administrator | 1 | 0 | 1 | 464 | 58 | 63% | 8 |
| Clinical Nurse Specialist | 1 | 0 | 1 | 383 | 51 | 55% | 7.5 |
| Nurse Practitioner | 1 | 0 | 1 | 353 | 45 | 49% | 7.8 |
| Dietitian | 1 | 0 | 1 | 260 | 34 | 37% | 7.7 |
| Occupational Therapy Aide | 1 | 0 | 1 | 192 | 36 | 39% | 5.3 |
| Qualified Social Worker | 0 | 1 | 1 | 25 | 11 | 12% | 2.3 |
| RN Director of Nursing | 1 | 0 | 1 | 2 | 1 | 1% | 1.5 |
Includes penalties issued in 2025
Federal penalties imposed by CMS for regulatory violations, including civil money penalties (fines) and denials of payment for new Medicare/Medicaid admissions.
Source: CMS Penalties Database (Data as of Jan 2026)
Massachusetts average: $72K
Massachusetts average: 1.7
Massachusetts average: 0.1
Penalties are imposed by CMS for violations of federal nursing home regulations.
1 penalty in the past 3 years
Mar 31, 2025 · $71K
Last updated: Jan 2026
These measures show how residents usually do over time at this home, based on health outcomes and preventive care.
Massachusetts average: 10.2
Massachusetts average: 20.0
Massachusetts average: 18.7%
Massachusetts average: 19.3%
Massachusetts average: 22.1%
Massachusetts average: 3.6%
Massachusetts average: 4.7%
Massachusetts average: 2.1%
Massachusetts average: 5.2%
Massachusetts average: 10.7%
Massachusetts average: 20.3%
Massachusetts average: 91.9%
Massachusetts average: 94.8%
Massachusetts average: 1.86
Massachusetts average: 1.54
Massachusetts average: 76.7%
Massachusetts average: 1.3%
Massachusetts average: 77.7%
Massachusetts average: 25.8%
Massachusetts average: 11.8%
Massachusetts average: 0.8%
Massachusetts average: 53.7%
Massachusetts average: 50.6%
Quality measures are calculated from Minimum Data Set (MDS) assessments. For most measures, lower percentages indicate better care quality.
41% of new residents, usually for short-term rehab.
26% of new residents, often for short stays.
33% of new residents, often for long-term daily care.
Source: CMS Long-Term Care Facility Characteristics (Data as of Jan 2026)
Residents meet regularly to discuss policies, care quality, and activities
Organized group of residents that meets regularly to discuss facility policies, quality of life, and activities.
Data sourced from CMS Long-Term Care Facility Characteristics quarterly report. Payer mix reflects the current resident census by primary payment source.
Historical financial and operational data for RegalCare at Lowell from 2012–2023, based on CMS SNF Cost Reports.
Key figures below are for fiscal year ending in 12/2023.
Based on CMS SNF Cost Report for fiscal year ending in 12/2023.
Most residents typically stay for a few weeks or months before returning home or moving on.
New residents most often arrive under Medicare (41% of admissions), and a typical Medicare stay runs around 26 days.
Coverage residents most often arrive under.
Coverage residents most often leave under.
![]() 1.1 miles from city center
1.1 miles from city center
![]() Estimated distance in miles from Lowell's city center to RegalCare at Lowell's address, calculated via Google Maps.
— 10.53 miles to nearest hospital (Merrimack Health Lawrence Hospital)
Estimated distance in miles from Lowell's city center to RegalCare at Lowell's address, calculated via Google Maps.
— 10.53 miles to nearest hospital (Merrimack Health Lawrence Hospital)
Add your location
Info below is compiled from CMS reports & the MA Executive Office of Elder Affairs, senior community websites & trusted data sources such as Walk Score & BBB.
Communities are listed from highest to lowest based on our ranking methodology.
| CareOne at Lowell | NH SNF | Lowell (Centralville) | 160
Facility
160
MA AVG
94
Rank
#22 / 276 |
93.7%
Facility
93.7%
MA AVG
78.3
Rank
#14 / 81 | +20% | 5.04
Facility
5.04
MA AVG
3.93
Rank
#9 / 86 | -75% | +28% | $0
Facility
$0
MA AVG
$76.6k
Rank
#1 / 87 | 27
Facility
27
MA AVG
32.7
Rank
#40 / 86 | 6.8
Facility
6.8
MA AVG
7.2
Rank
#48 / 86 | 1 | 150 | - |
77
Facility
77
MA AVG
53
Rank
#141 / 498 | Thci Of Massachusetts, LLC | $25.0MFiscal year ending 12/2023
Facility
$25.0MFiscal year ending 12/2023
MA AVG
$17.4M
Rank
#10 / 89 | $14.3MFiscal year ending 12/2023
Facility
$14.3MFiscal year ending 12/2023
MA AVG
$6.5M
Rank
#10 / 89 | 57.3%Fiscal year ending 12/2023
Facility
57.3%Fiscal year ending 12/2023
MA AVG
43.6%
Rank
#57 / 89 | 225224 | ||||
| D‘Youville Life and Wellness Community | NH AL HOS IL MC SNF | Lowell (Pawtucketville) | 208
Facility
208
MA AVG
94
Rank
#6 / 276 |
95.0%
Facility
95.0%
MA AVG
78.3
Rank
#6 / 81 | +21% | 3.68
Facility
3.68
MA AVG
3.93
Rank
#52 / 86 | -44% | -6% | $0
Facility
$0
MA AVG
$76.6k
Rank
#1 / 87 | 29
Facility
29
MA AVG
32.7
Rank
#45 / 86 | 5.8
Facility
5.8
MA AVG
7.2
Rank
#40 / 86 | 1 | 198 | - |
19
Facility
19
MA AVG
53
Rank
#425 / 498 | D'youville Leadership Solutions, Inc | $24.2MFiscal year ending 12/2023
Facility
$24.2MFiscal year ending 12/2023
MA AVG
$17.4M
Rank
#9 / 89 | $15.5MFiscal year ending 12/2023
Facility
$15.5MFiscal year ending 12/2023
MA AVG
$6.5M
Rank
#6 / 89 | 64.2%Fiscal year ending 12/2023
Facility
64.2%Fiscal year ending 12/2023
MA AVG
43.6%
Rank
#19 / 89 | 225515 | ||||
| Palm Center | NH HOS PC RC SNF | Chelmsford (North Chelmsford) | 124
Facility
124
MA AVG
94
Rank
#50 / 276 |
88.1%
Facility
88.1%
MA AVG
78.3
Rank
#35 / 81 | +13% | 4.27
Facility
4.27
MA AVG
3.93
Rank
#18 / 86 | +44% | +9% | $8.6k
Facility
$8.6k
MA AVG
$76.6k
Rank
#51 / 87 | 21
Facility
21
MA AVG
32.7
Rank
#28 / 86 | 4.2
Facility
4.2
MA AVG
7.2
Rank
#19 / 86 | 1 | 109 | - |
78
Facility
78
MA AVG
53
Rank
#133 / 498 | Dimitre Sirakov | $13.5M*Fiscal year ending 11/2022These figures are from this home's most recent complete cost report — an older period than most facilities report. Compare with that in mind.
Facility
$13.5M*Fiscal year ending 11/2022These figures are from this home's most recent complete cost report — an older period than most facilities report. Compare with that in mind.
MA AVG
$17.4M
Rank
#39 / 89 | $8.5M*Fiscal year ending 11/2022These figures are from this home's most recent complete cost report — an older period than most facilities report. Compare with that in mind.
Facility
$8.5M*Fiscal year ending 11/2022These figures are from this home's most recent complete cost report — an older period than most facilities report. Compare with that in mind.
MA AVG
$6.5M
Rank
#43 / 89 | 63.1%*Fiscal year ending 11/2022These figures are from this home's most recent complete cost report — an older period than most facilities report. Compare with that in mind.
Facility
63.1%*Fiscal year ending 11/2022These figures are from this home's most recent complete cost report — an older period than most facilities report. Compare with that in mind.
MA AVG
43.6%
Rank
#55 / 89 | 225508 | ||||
| Fairhaven Healthcare Center for Rehabilitation and Nursing | NH HOS MC RC SNF | Lowell (Pawtucketville) | 169
Facility
169
MA AVG
94
Rank
#14 / 276 |
74.0%
Facility
74.0%
MA AVG
78.3
Rank
#56 / 81 | -5% | 4.23
Facility
4.23
MA AVG
3.93
Rank
#22 / 86 | -42% | +8% | $15.0k
Facility
$15.0k
MA AVG
$76.6k
Rank
#62 / 87 | 41
Facility
41
MA AVG
32.7
Rank
#64 / 86 | 6.8
Facility
6.8
MA AVG
7.2
Rank
#48 / 86 | 1 | 125 | A+ |
40
Facility
40
MA AVG
53
Rank
#313 / 498 | Michael Takesian | $12.6MFiscal year ending 12/2023
Facility
$12.6MFiscal year ending 12/2023
MA AVG
$17.4M
Rank
#68 / 89 | $6.7MFiscal year ending 12/2023
Facility
$6.7MFiscal year ending 12/2023
MA AVG
$6.5M
Rank
#67 / 89 | 53.6%Fiscal year ending 12/2023
Facility
53.6%Fiscal year ending 12/2023
MA AVG
43.6%
Rank
#22 / 89 | 225458 | ||||
| RegalCare at Lowell | NH SNF | Lowell (Highlands) | 90
Facility
90
MA AVG
94
Rank
#125 / 276 |
67.4%
Facility
67.4%
MA AVG
78.3
Rank
#65 / 81 | -14% | 3.53
Facility
3.53
MA AVG
3.93
Rank
#65 / 86 | -15% | -10% | $30.5k
Facility
$30.5k
MA AVG
$76.6k
Rank
#70 / 87 | 44
Facility
44
MA AVG
32.7
Rank
#70 / 86 | 8.8
Facility
8.8
MA AVG
7.2
Rank
#64 / 86 | 3 | 61 | - |
69
Facility
69
MA AVG
53
Rank
#177 / 498 | - | $6.7MFiscal year ending 12/2023
Facility
$6.7MFiscal year ending 12/2023
MA AVG
$17.4M
Rank
#88 / 89 | $4.1MFiscal year ending 12/2023
Facility
$4.1MFiscal year ending 12/2023
MA AVG
$6.5M
Rank
#83 / 89 | 60.5%Fiscal year ending 12/2023
Facility
60.5%Fiscal year ending 12/2023
MA AVG
43.6%
Rank
#4 / 89 | 225511 |
RegalCare at Lowell is located in Lowell, Massachusetts.
Here are the financial assistance programs available to residents in Massachusetts.
RegalCare at Lowell is in the Highlands neighborhood.
RegalCare at Lowell has a walk score of 69. Moderately walkable. Some errands can be accomplished on foot, with a mix of nearby amenities.
RegalCare at Lowell's occupancy is 70.7%.
No, RegalCare at Lowell has a no-pet policy.
RegalCare at Lowell is registered as a for-profit.
Yes — there are 4 photos of RegalCare at Lowell in the photo gallery on this page.
RegalCare at Lowell is located at 30 Princeton Blvd, Lowell, MA 01851.
Care Cost Calculator: See Prices in Your Area
Nursing Home Data Explorer
Don’t Wait Too Long: 7 Red Flag Signs Your Parent Needs Assisted Living Now
The True Cost of Assisted Living in 2025 – And How Families Are Paying For It
Understanding Senior Living Costs: Pricing Models, Discounts & Financial Assistance


