


Total health inspections
14
Texas average 7.4
Last Health inspection on Jul 2025
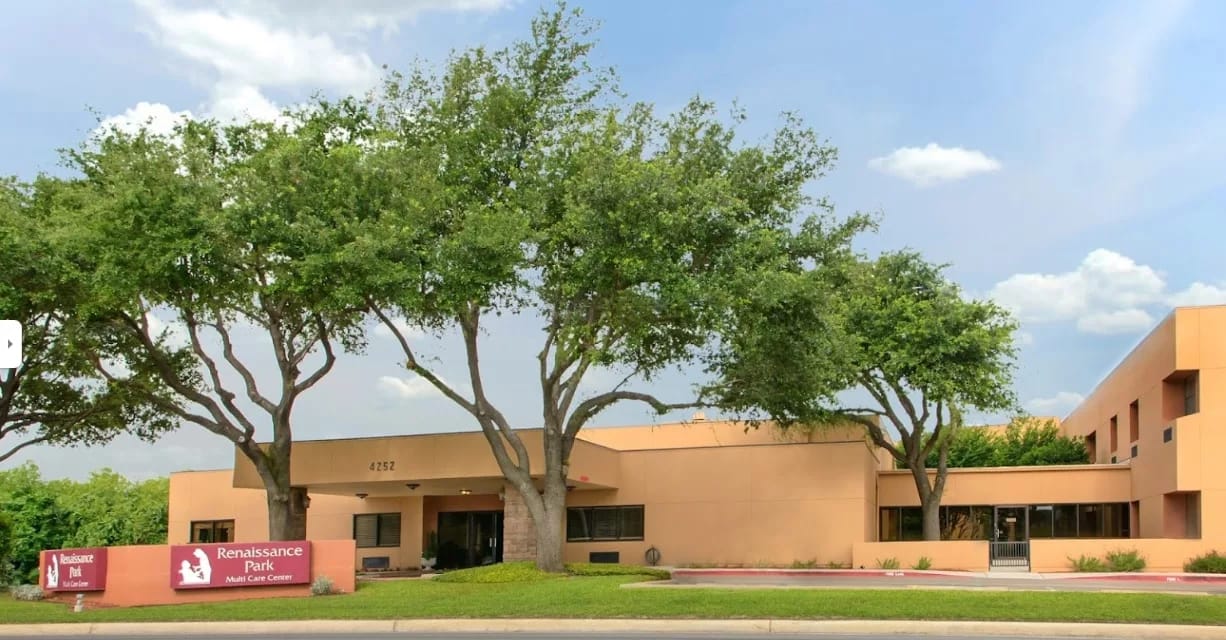
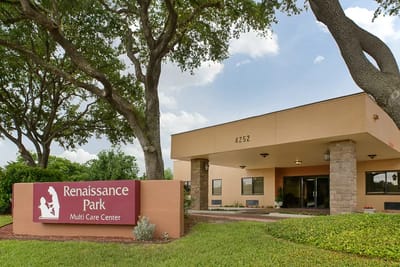
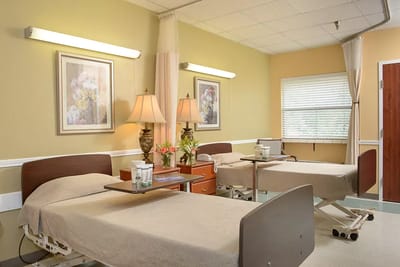
Renaissance Park Multi Care Center is a skilled nursing and rehabilitation center in Fort Worth. The upscale nursing home aims to change the meaning of senior recovery through the exceptional care delivered by their patient-friendly staff to offer the best care possible for their residents. As a member of the Life Care Centers, Renaissance Park is known as a safe and secure community that cares for every individual’s needs.
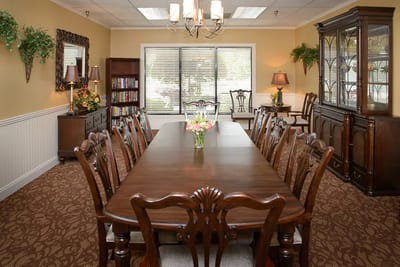
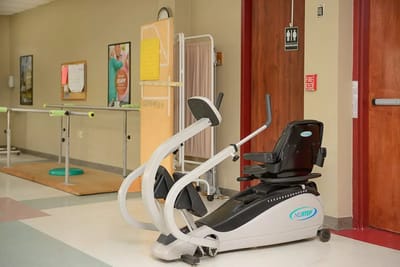
Convenience and hassle-free living are the centers of Renaissance Park services: medication management, post-surgical care, wound care, and 24-hour skilled nursing and long-term care services. Other nursing home activities include daily activities, delicious dining, religious services, 24-hour security and safety, a library, landscaped grounds, courtyards, and a fine dining meal program.
| Staff type | Hours / Day / Resident | vs state avg |
|---|---|---|
|
Registered Nurse (RN)
| 56m per day | ▲ 114% State avg: 26m per day · National avg: 41m per day |
|
LPN / LVN
| 46m per day | ▼ 20% State avg: 57m per day · National avg: 52m per day |
|
Nurse Aide
| 2h 11m per day | ▲ 8% State avg: 2h 1m per day · National avg: 2h 21m per day |
|
Weekend Total Nursing
| 3h 15m per day | ▲ 9% State avg: 2h 59m per day · National avg: 3h 26m per day |
|
Physical Therapist
| 5m per day | ▲ 36% State avg: 4m per day · National avg: 4m per day |
|
Weekend RN
| 51m per day | ▲ 145% State avg: 21m per day · National avg: 29m per day |
Renaissance Park Multi Care Center is administered by Yvonne Yegon.
Key information about the people who lead and staff this community.
In Texas, the Health and Human Services Commission (HHSC) is the primary regulatory body that conducts unannounced inspections and publishes quality reports for all long-term care homes.
Citations
| This Facility | TX Average | vs. TX Avg |
|---|---|---|---|
|
Total citations
| 18 | 6 | This facility has 200% more total citations than a typical Texas nursing home (18 vs. TX avg 6).↑ 200% worse |
|
Health citations
| 18 | 2 | This facility has 800% more health citations than a typical Texas nursing home (18 vs. TX avg 2).↑ 800% worse |
|
Life safety citations
| 18 | 6 | This facility has 200% more life safety citations than a typical Texas nursing home (18 vs. TX avg 6).↑ 200% worse |
Texas average 7.4
Last Health inspection on Jul 2025
Texas average 25.9
Texas average 3.67
Health citations are formal notices following inspections when they fail to comply with safety and care standards.
8 of 31 citations resulted from standard inspections; 22 of 31 resulted from complaint investigations; and 1 of 31 came from combined inspections (standard and complaint).
Texas average: 2
Texas average: 0.4
Reporting period: October 1 – December 31, 2025 (Q4 2025). Source: CMS Payroll-Based Journal report.
Manages medical care and health needs.
Assists with medical care and medications.
Helps with daily care and mobility.
Total hours from contractors
149 contractor hours this quarter
| Certified Nursing Assistant | 25 | 2 | 27 | 7,205 | 92 | 100% | 7.8 |
| Licensed Practical Nurse | 13 | 1 | 14 | 3,153 | 88 | 96% | 8 |
| Registered Nurse | 8 | 0 | 8 | 2,258 | 90 | 98% | 8.9 |
| Medication Aide/Technician | 6 | 0 | 6 | 1,822 | 90 | 98% | 8.9 |
| Clinical Nurse Specialist | 4 | 0 | 4 | 1,306 | 69 | 75% | 8.2 |
| Qualified Social Worker | 7 | 0 | 7 | 819 | 73 | 79% | 5.7 |
| Administrator | 1 | 0 | 1 | 528 | 66 | 72% | 8 |
| Dietitian | 1 | 0 | 1 | 481 | 66 | 72% | 7.3 |
| Physical Therapy Aide | 3 | 0 | 3 | 474 | 66 | 72% | 7.2 |
| Speech Language Pathologist | 2 | 0 | 2 | 445 | 65 | 71% | 6.7 |
| Physical Therapy Assistant | 3 | 0 | 3 | 413 | 63 | 68% | 6.4 |
| Respiratory Therapy Technician | 4 | 0 | 4 | 373 | 63 | 68% | 5.6 |
| Mental Health Service Worker | 2 | 0 | 2 | 280 | 35 | 38% | 8 |
| Nurse Practitioner | 2 | 0 | 2 | 272 | 34 | 37% | 8 |
| Occupational Therapy Aide | 0 | 1 | 1 | 50 | 10 | 11% | 5 |
| Medical Director | 0 | 1 | 1 | 19 | 2 | 2% | 9.5 |
| Occupational Therapy Assistant | 0 | 1 | 1 | 18 | 2 | 2% | 9 |
| Other Physician | 0 | 1 | 1 | 10 | 1 | 1% | 9.5 |
Includes penalties issued in 2023-2025
Federal penalties imposed by CMS for regulatory violations, including civil money penalties (fines) and denials of payment for new Medicare/Medicaid admissions.
Source: CMS Penalties Database (Data as of Jan 2026)
Texas average: $80K
Texas average: 2.5
Texas average: 0.2
Penalties are imposed by CMS for violations of federal nursing home regulations.
4 penalties in the past 3 years
Multiple penalties were reported in the last 3 years.
Last updated: Jan 2026
These measures show how residents usually do over time at this home, based on health outcomes and preventive care.
Texas average: 8.6
Texas average: 16.0
Texas average: 16.2%
Texas average: 16.2%
Texas average: 15.7%
Texas average: 3.2%
Texas average: 4.4%
Texas average: 0.8%
Texas average: 3.5%
Texas average: 2.9%
Texas average: 7.9%
Texas average: 97.3%
Texas average: 97.9%
Texas average: 2.13
Texas average: 2.07
Texas average: 90.4%
Texas average: 1.4%
Texas average: 88.0%
Texas average: 25.9%
Texas average: 12.0%
Texas average: 0.8%
Texas average: 53.7%
Texas average: 50.6%
Quality measures are calculated from Minimum Data Set (MDS) assessments. For most measures, lower percentages indicate better care quality.
17% of new residents, usually for short-term rehab.
70% of new residents, often for short stays.
13% of new residents, often for long-term daily care.
Source: CMS Long-Term Care Facility Characteristics (Data as of Jan 2026)
Residents meet regularly to discuss policies, care quality, and activities
Organized group of residents that meets regularly to discuss facility policies, quality of life, and activities.
Data sourced from CMS Long-Term Care Facility Characteristics quarterly report. Payer mix reflects the current resident census by primary payment source.
Historical financial and operational data for Renaissance Park Multi Care Center from 2012–2024, based on CMS SNF Cost Reports.
Key figures below are for fiscal year ending in 06/2024.
Based on CMS SNF Cost Report for fiscal year ending in 06/2024.
Residents typically stay for brief periods, with frequent admissions and discharges throughout the year.
Most new residents arrive under private pay (70% of admissions), and a typical private pay stay runs around 1 months.
Coverage residents most often arrive under.
Coverage residents most often leave under.
![]() 6.4 miles from city center
6.4 miles from city center
![]() Estimated distance in miles from Fort Worth's city center to Renaissance Park Multi Care Center's address, calculated via Google Maps.
Estimated distance in miles from Fort Worth's city center to Renaissance Park Multi Care Center's address, calculated via Google Maps.
Add your location
Info below is compiled from CMS reports & the TX Health & Human Services Commission (HHSC), senior community websites & trusted data sources such as Walk Score & BBB.
Communities are listed from highest to lowest based on our ranking methodology.
| Stonegate Nursing and Rehabilitation | NH SNF | Fort Worth | 134
Facility
134
TX AVG
79
Rank
#115 / 972 |
66.7%
Facility
66.7%
TX AVG
67.3
Rank
#114 / 195 | -1% | 4.01
Facility
4.01
TX AVG
3.63
Rank
#61 / 239 | +78% | +10% | $16.8k
Facility
$16.8k
TX AVG
$81.8k
Rank
#103 / 244 | 28
Facility
28
TX AVG
25.9
Rank
#174 / 241 | 3.1
Facility
3.1
TX AVG
3.7
Rank
#111 / 241 | 3 | 89 | A+ |
35
Facility
35
TX AVG
41
Rank
#847 / 1389 | Hmg Park Manor Of Stonegate, LLC | $8.1MFiscal year ending 08/2024
Facility
$8.1MFiscal year ending 08/2024
TX AVG
$8.4M
Rank
#93 / 245 | $4.1MFiscal year ending 08/2024
Facility
$4.1MFiscal year ending 08/2024
TX AVG
$3.5M
Rank
#140 / 245 | 50.1%Fiscal year ending 08/2024
Facility
50.1%Fiscal year ending 08/2024
TX AVG
47%
Rank
#205 / 245 | 675759 | ||||
| Garden Terrace at Fort Worth | NH SNF | Fort Worth (Oakmont Boulevard) | 120
Facility
120
TX AVG
79
Rank
#204 / 972 |
30.8%
Facility
30.8%
TX AVG
67.3
Rank
#177 / 195 | -54% | 4.32
Facility
4.32
TX AVG
3.63
Rank
#51 / 239 | -56% | +19% | $34.4k
Facility
$34.4k
TX AVG
$81.8k
Rank
#148 / 244 | 21
Facility
21
TX AVG
25.9
Rank
#124 / 241 | 3.0
Facility
3.0
TX AVG
3.7
Rank
#100 / 241 | 3 | 37 | A+ |
51
Facility
51
TX AVG
41
Rank
#481 / 1389 | Jerry Weeter | $4.3MFiscal year ending 09/2023
Facility
$4.3MFiscal year ending 09/2023
TX AVG
$8.4M
Rank
#232 / 245 | $2.9MFiscal year ending 09/2023
Facility
$2.9MFiscal year ending 09/2023
TX AVG
$3.5M
Rank
#216 / 245 | 67.4%Fiscal year ending 09/2023
Facility
67.4%Fiscal year ending 09/2023
TX AVG
47%
Rank
#22 / 245 | 675650 | ||||
| Village Creek Wellness and Rehabilitation | NH PC SNF | Fort Worth | 100
Facility
100
TX AVG
79
Rank
#354 / 972 |
84.5%
Facility
84.5%
TX AVG
67.3
Rank
#49 / 195 | +26% | 2.80
Facility
2.80
TX AVG
3.63
Rank
#226 / 239 | +16% | -23% | $19.0k
Facility
$19.0k
TX AVG
$81.8k
Rank
#108 / 244 | 19
Facility
19
TX AVG
25.9
Rank
#102 / 241 | 3.8
Facility
3.8
TX AVG
3.7
Rank
#167 / 241 | 2 | 85 | - |
26
Facility
26
TX AVG
41
Rank
#1003 / 1389 | Village Creek Nursing & Rehabilitation LLC | $6.1M*Fiscal year ending 12/2022These figures are from this home's most recent complete cost report — an older period than most facilities report. Compare with that in mind.
Facility
$6.1M*Fiscal year ending 12/2022These figures are from this home's most recent complete cost report — an older period than most facilities report. Compare with that in mind.
TX AVG
$8.4M
Rank
#241 / 245 | $3.4M*Fiscal year ending 12/2022These figures are from this home's most recent complete cost report — an older period than most facilities report. Compare with that in mind.
Facility
$3.4M*Fiscal year ending 12/2022These figures are from this home's most recent complete cost report — an older period than most facilities report. Compare with that in mind.
TX AVG
$3.5M
Rank
#194 / 245 | 55.5%*Fiscal year ending 12/2022These figures are from this home's most recent complete cost report — an older period than most facilities report. Compare with that in mind.
Facility
55.5%*Fiscal year ending 12/2022These figures are from this home's most recent complete cost report — an older period than most facilities report. Compare with that in mind.
TX AVG
47%
Rank
#2 / 245 | 675977 | ||||
| Park View Care Center | NH AL HOS MC SNF | Fort Worth (West Meadowbrook) | 179
Facility
179
TX AVG
79
Rank
#28 / 972 |
71.0%
Facility
71.0%
TX AVG
67.3
Rank
#97 / 195 | +5% | 4.16
Facility
4.16
TX AVG
3.63
Rank
#54 / 239 | -5% | +15% | $299.0k
Facility
$299.0k
TX AVG
$81.8k
Rank
#241 / 244 | 46
Facility
46
TX AVG
25.9
Rank
#220 / 241 | 2.9
Facility
2.9
TX AVG
3.7
Rank
#92 / 241 | 6 | 127 | - |
28
Facility
28
TX AVG
41
Rank
#954 / 1389 | Mathew Bedard | $9.7MFiscal year ending 08/2024
Facility
$9.7MFiscal year ending 08/2024
TX AVG
$8.4M
Rank
#65 / 245 | $0.0kFiscal year ending 08/2024
Facility
$0.0kFiscal year ending 08/2024
TX AVG
$3.5M
Rank
#95 / 245 | 0%Fiscal year ending 08/2024
Facility
0%Fiscal year ending 08/2024
TX AVG
47%
Rank
#188 / 245 | 455606 | ||||
| Renaissance Park Multi Care Center | NH SNF | Fort Worth (Bryant Irvin Road) | 120
Facility
120
TX AVG
79
Rank
#204 / 972 | - | - | 4.11
Facility
4.11
TX AVG
3.63
Rank
#56 / 239 | +19% | +13% | $106.5k
Facility
$106.5k
TX AVG
$81.8k
Rank
#206 / 244 | 31
Facility
31
TX AVG
25.9
Rank
#186 / 241 | 2.2
Facility
2.2
TX AVG
3.7
Rank
#34 / 241 | 4 | 5 | - |
58
Facility
58
TX AVG
41
Rank
#326 / 1389 | Douglas Meharry | $5.1MFiscal year ending 06/2024
Facility
$5.1MFiscal year ending 06/2024
TX AVG
$8.4M
Rank
#199 / 245 | $3.6MFiscal year ending 06/2024
Facility
$3.6MFiscal year ending 06/2024
TX AVG
$3.5M
Rank
#188 / 245 | 69.5%Fiscal year ending 06/2024
Facility
69.5%Fiscal year ending 06/2024
TX AVG
47%
Rank
#81 / 245 | 455891 |
Renaissance Park Multi Care Center is located in Fort Worth, Texas.
Here are the financial assistance programs available to residents in Texas.
Renaissance Park Multi Care Center is in the Bryant Irvin Road neighborhood of Fort Worth.
Renaissance Park Multi Care Center is legally operated by United Investors Limited Partnership, and administered by Yvonne Yegon.
Renaissance Park Multi Care Center has a walk score of 58. Moderately walkable. Some errands can be accomplished on foot, with a mix of nearby amenities.
According to TX state health department records, Renaissance Park Multi Care Center's license number is 146056.
According to TX state health department records, Renaissance Park Multi Care Center's license expires on October 30, 2028.
Renaissance Park Multi Care Center's occupancy is 39.8%.
Renaissance Park Multi Care Center has been operating for approximately 26 years, based on available licensing and registration records.
Care Cost Calculator: See Prices in Your Area
Nursing Home Data Explorer
Don’t Wait Too Long: 7 Red Flag Signs Your Parent Needs Assisted Living Now
The True Cost of Assisted Living in 2025 – And How Families Are Paying For It
Understanding Senior Living Costs: Pricing Models, Discounts & Financial Assistance


