


Total staff
56
Employees
37
Contractors
19
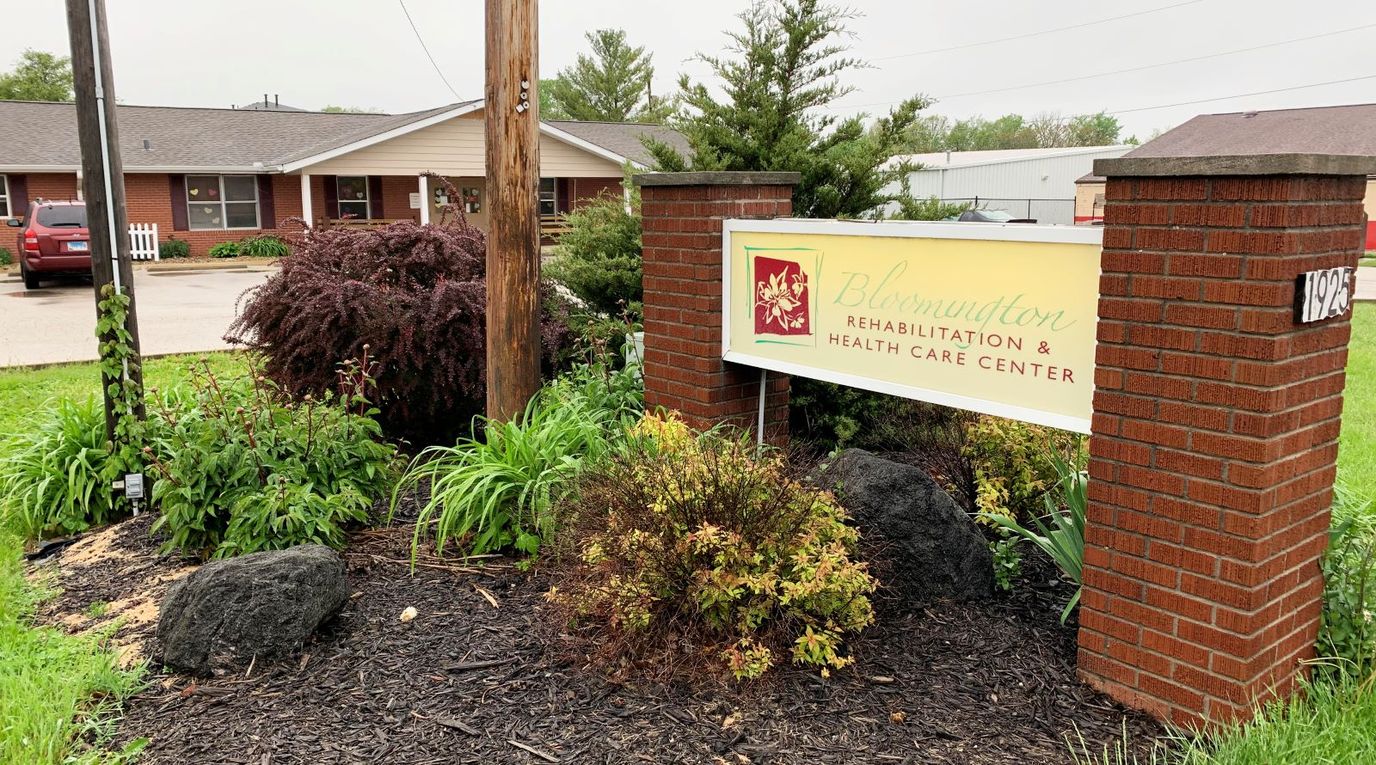
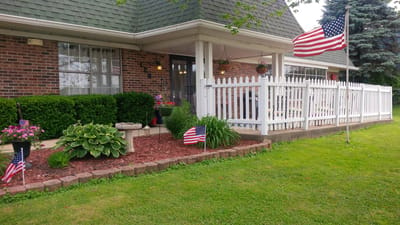
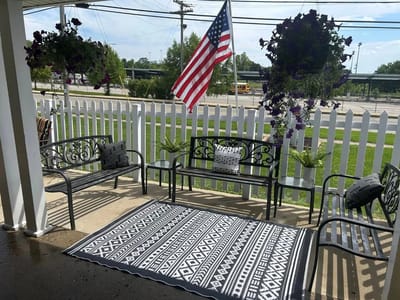
Situated in the beautiful Indiana, the Bloomington Nursing & Rehabilitation Center exemplifies compassionate care and support. Operating as a nonprofit community, this facility comprises 38 beds, providing essential nursing and rehab services to those in need. Here, dedicated staff and residents foster a sense of community infused with empathy and understanding, offering a helping hand to families and seniors alike.
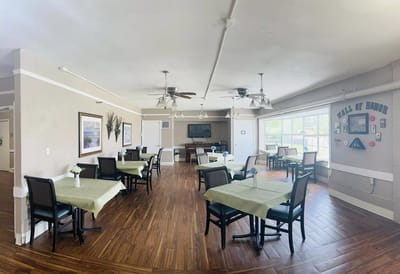
From IV therapy and skilled nursing care to restorative nursing and hospice care, the center ensures comprehensive support. Additionally, they prioritize holistic well-being through therapeutic diet plans, engaging social activities, and robust physical, occupational, and speech therapy programs. Moreover, the center understands the importance of seamless transitions, offering discharge planning services for those returning home, along with convenient transportation options for medical appointments.
| Staff type | Hours / Day / Resident | vs state avg |
|---|---|---|
|
Registered Nurse (RN)
| 26m per day | ▼ 34% State avg: 40m per day · National avg: 41m per day |
|
LPN / LVN
| 35m per day | ▼ 23% State avg: 46m per day · National avg: 52m per day |
|
Nurse Aide
| 2h 2m per day | ▼ 10% State avg: 2h 16m per day · National avg: 2h 21m per day |
|
Weekend Total Nursing
| 2h 48m per day | ▼ 13% State avg: 3h 14m per day · National avg: 3h 26m per day |
|
Physical Therapist
| 1m per day | ▼ 73% State avg: 4m per day · National avg: 4m per day |
|
Weekend RN
| 23m per day | ▼ 15% State avg: 27m per day · National avg: 29m per day |
Reporting period: October 1 – December 31, 2025 (Q4 2025). Source: CMS Payroll-Based Journal report.
Manages medical care and health needs.
Assists with medical care and medications.
Helps with daily care and mobility.
Total hours from contractors
1,031 contractor hours this quarter
| Certified Nursing Assistant | 16 | 0 | 16 | 4,983 | 92 | 100% | 8.7 |
| Licensed Practical Nurse | 8 | 0 | 8 | 1,561 | 92 | 100% | 8.9 |
| Medication Aide/Technician | 3 | 0 | 3 | 1,071 | 91 | 99% | 9.6 |
| Registered Nurse | 3 | 3 | 6 | 773 | 64 | 70% | 9.9 |
| Administrator | 1 | 0 | 1 | 504 | 63 | 68% | 8 |
| Mental Health Service Worker | 1 | 1 | 2 | 498 | 62 | 67% | 7.9 |
| Speech Language Pathologist | 0 | 1 | 1 | 474 | 62 | 67% | 7.6 |
| Dietitian | 1 | 0 | 1 | 440 | 55 | 60% | 8 |
| Nurse Practitioner | 1 | 0 | 1 | 412 | 58 | 63% | 7.1 |
| Physical Therapy Aide | 0 | 2 | 2 | 308 | 54 | 59% | 5.7 |
| Other Dietary Services Staff | 1 | 0 | 1 | 291 | 59 | 64% | 4.9 |
| RN Director of Nursing | 1 | 0 | 1 | 186 | 25 | 27% | 7.4 |
| Clinical Nurse Specialist | 1 | 2 | 3 | 122 | 23 | 25% | 5.3 |
| Occupational Therapy Aide | 0 | 3 | 3 | 98 | 26 | 28% | 3.6 |
| Respiratory Therapy Technician | 0 | 2 | 2 | 53 | 37 | 40% | 1.2 |
| Physical Therapy Assistant | 0 | 2 | 2 | 32 | 36 | 39% | 0.8 |
| Other Physician | 0 | 1 | 1 | 12 | 4 | 4% | 3 |
| Occupational Therapy Assistant | 0 | 1 | 1 | 12 | 3 | 3% | 4 |
| Medical Director | 0 | 1 | 1 | 3 | 3 | 3% | 1 |
Federal penalties imposed by CMS for regulatory violations, including civil money penalties (fines) and denials of payment for new Medicare/Medicaid admissions.
Source: CMS Penalties Database
No penalties in the past 3 years
No civil money penalties or payment denials were reported in the last 3 years.
These measures show how residents usually do over time at this home, based on health outcomes and preventive care.
Indiana average: 8.0
Indiana average: 17.1
Indiana average: 12.0%
Indiana average: 14.4%
Indiana average: 24.6%
Indiana average: 3.9%
Indiana average: 4.4%
Indiana average: 1.2%
Indiana average: 5.7%
Indiana average: 24.1%
Indiana average: 12.4%
Indiana average: 93.7%
Indiana average: 95.4%
Indiana average: 1.60
Indiana average: 1.48
Indiana average: 81.7%
Indiana average: 1.4%
Quality measures are calculated from Minimum Data Set (MDS) assessments. For most measures, lower percentages indicate better care quality.
21% of new residents, usually for short-term rehab.
4% of new residents, often for short stays.
75% of new residents, often for long-term daily care.
Source: CMS Long-Term Care Facility Characteristics (Data as of Jan 2026)
Residents meet regularly to discuss policies, care quality, and activities
Organized group of residents that meets regularly to discuss facility policies, quality of life, and activities.
Data sourced from CMS Long-Term Care Facility Characteristics quarterly report. Payer mix reflects the current resident census by primary payment source.
Historical financial and operational data for Bloomington Nursing & Rehabilitation Center from 2011–2023, based on CMS SNF Cost Reports.
Based on CMS SNF Cost Report for fiscal year ending in 12/2023.
Most residents stay for extended periods and receive ongoing daily care.
Most new residents arrive under Medicaid (75% of admissions), and a typical Medicaid stay runs around 6 - 7 months.
Coverage residents most often arrive under.
Coverage residents most often leave under.
![]() 1.6 miles from city center
1.6 miles from city center
![]() Estimated distance in miles from Bloomington's city center to Bloomington Nursing & Rehabilitation Center's address, calculated via Google Maps.
Estimated distance in miles from Bloomington's city center to Bloomington Nursing & Rehabilitation Center's address, calculated via Google Maps.
Add your location
The information below is reported by the Indiana Department of Health, Division of Long Term Care.
| Stonecroft Health Campus | NH ADC AL MC RC | Bloomington | 124
Facility
124
IN AVG
116
Rank
#157 / 437 |
84.7%
Facility
84.7%
IN AVG
69.4%
Rank
#388 / 434 | +22% | 3.59
Facility
3.59
IN AVG
3.44
Rank
#88 / 291 | +18% | +4% | $0
Facility
$0
IN AVG
$31.4k
Rank
#1 / 293 | 91
Facility
91
IN AVG
83
Rank
#71 / 384 | 4
Facility
4
IN AVG
25.0
Rank
#7 / 292 | 2.0
Facility
2.0
IN AVG
4.1
Rank
#25 / 292 | - | 105 | A+ |
9
Facility
9
IN AVG
37
Rank
#473 / 587 | Daviess County Hospital | $10.6M
Facility
$10.6M
IN AVG
$10.7M
Rank
#139 / 294 | $5.2M
Facility
$5.2M
IN AVG
$4.2M
Rank
#125 / 294 | 49.7%
Facility
49.7%
IN AVG
42%
Rank
#151 / 294 | 155838 | ||||
| Bell Trace Family-first Senior Living | NH AL HC IL RC | Bloomington | 90
Facility
90
IN AVG
116
Rank
#286 / 437 |
90.2%
Facility
90.2%
IN AVG
69.4%
Rank
#29 / 434 | +30% | 3.57
Facility
3.57
IN AVG
3.44
Rank
#88 / 291 | +71% | +4% | $0
Facility
$0
IN AVG
$31.4k
Rank
#1 / 293 | - | 4
Facility
4
IN AVG
25.0
Rank
#7 / 292 | 4.0
Facility
4.0
IN AVG
4.1
Rank
#153 / 292 | - | 77 | - |
29
Facility
29
IN AVG
37
Rank
#337 / 587 | - | $11.9M
Facility
$11.9M
IN AVG
$10.7M
Rank
#39 / 294 | $5.5M
Facility
$5.5M
IN AVG
$4.2M
Rank
#81 / 294 | 46.5%
Facility
46.5%
IN AVG
42%
Rank
#259 / 294 | 155677 | ||||
| Majestic Care of Bloomington | NH HC MC RC | Bloomington | 224
Facility
224
IN AVG
116
Rank
#21 / 437 |
50.0%
Facility
50.0%
IN AVG
69.4%
Rank
#348 / 434 | -28% | 2.95
Facility
2.95
IN AVG
3.44
Rank
#232 / 291 | -30% | -14% | $0
Facility
$0
IN AVG
$31.4k
Rank
#1 / 293 | 89
Facility
89
IN AVG
83
Rank
#89 / 384 | 6
Facility
6
IN AVG
25.0
Rank
#17 / 292 | 2.0
Facility
2.0
IN AVG
4.1
Rank
#25 / 292 | - | 108 | - |
44
Facility
44
IN AVG
37
Rank
#249 / 587 | Columbus Regional Hospital | $12.4M
Facility
$12.4M
IN AVG
$10.7M
Rank
#115 / 294 | $5.8M
Facility
$5.8M
IN AVG
$4.2M
Rank
#110 / 294 | 46.6%
Facility
46.6%
IN AVG
42%
Rank
#165 / 294 | 155019 | ||||
| Brickyard Healthcare – Bloomington Care Center | NH MC RC | Bloomington (Sunny Slopes) | 153
Facility
153
IN AVG
116
Rank
#83 / 437 |
72.5%
Facility
72.5%
IN AVG
69.4%
Rank
#169 / 434 | +4% | 3.46
Facility
3.46
IN AVG
3.44
Rank
#107 / 291 | -1% | +1% | $9.1k
Facility
$9.1k
IN AVG
$31.4k
Rank
#253 / 293 | 69
Facility
69
IN AVG
83
Rank
#341 / 384 | 26
Facility
26
IN AVG
25.0
Rank
#164 / 292 | 2.6
Facility
2.6
IN AVG
4.1
Rank
#59 / 292 | 2 | 125 | - |
33
Facility
33
IN AVG
37
Rank
#313 / 587 | Ggnsc Bloomington LLC | $16.2M
Facility
$16.2M
IN AVG
$10.7M
Rank
#91 / 294 | $6.4M
Facility
$6.4M
IN AVG
$4.2M
Rank
#68 / 294 | 39.7%
Facility
39.7%
IN AVG
42%
Rank
#108 / 294 | 155278 | ||||
| Bloomington Nursing & Rehabilitation Center | NH HC RC | Bloomington (Barclay Gardens) | 38
Facility
38
IN AVG
116
Rank
#424 / 437 |
74.3%
Facility
74.3%
IN AVG
69.4%
Rank
#154 / 434 | +7% | 2.26
Facility
2.26
IN AVG
3.44
Rank
#286 / 291 | +9% | -34% | $0
Facility
$0
IN AVG
$31.4k
Rank
#1 / 293 | - | 29
Facility
29
IN AVG
25.0
Rank
#187 / 292 | 4.1
Facility
4.1
IN AVG
4.1
Rank
#167 / 292 | - | 32 | - |
64
Facility
64
IN AVG
37
Rank
#115 / 587 | Aperion Care Monroe, LLC | $3.6M
Facility
$3.6M
IN AVG
$10.7M
Rank
#285 / 294 | $1.3M
Facility
$1.3M
IN AVG
$4.2M
Rank
#284 / 294 | 36.4%
Facility
36.4%
IN AVG
42%
Rank
#43 / 294 | 155532 |
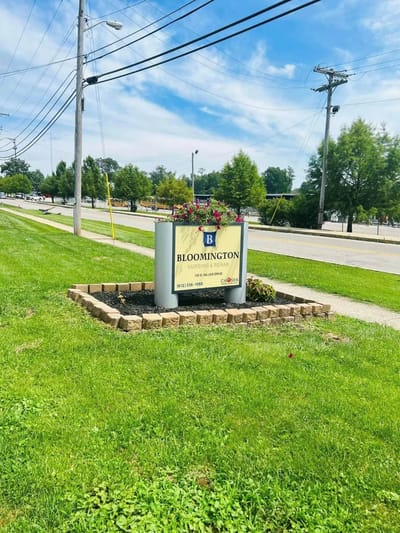
Bloomington Nursing & Rehabilitation Center is located in Bloomington, Indiana.
Here are the financial assistance programs available to residents in Indiana.
Bloomington Nursing & Rehabilitation Center is in the Barclay Gardens neighborhood.
Bloomington Nursing & Rehabilitation Center has a walk score of 64. Moderately walkable. Some errands can be accomplished on foot, with a mix of nearby amenities.
Bloomington Nursing & Rehabilitation Center's occupancy is 74.3%.
Bloomington Nursing & Rehabilitation Center is registered as a for-profit.
Yes — there are 7 photos of Bloomington Nursing & Rehabilitation Center in the photo gallery on this page.
Bloomington Nursing & Rehabilitation Center is located at 120 E Miller Dr, Bloomington, IN 47401.
(812) 336-1055 will put you in contact with the team at Bloomington Nursing & Rehabilitation Center.
Care Cost Calculator: See Prices in Your Area
Nursing Home Data Explorer
Don’t Wait Too Long: 7 Red Flag Signs Your Parent Needs Assisted Living Now
The True Cost of Assisted Living in 2025 – And How Families Are Paying For It
Understanding Senior Living Costs: Pricing Models, Discounts & Financial Assistance


