


Total health inspections
5
South Carolina average 3.9
Last Health inspection on Jul 2025
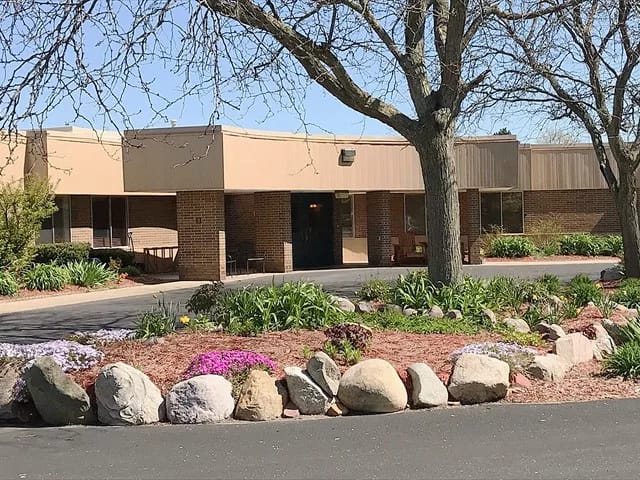
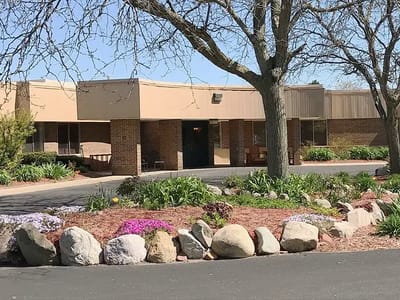
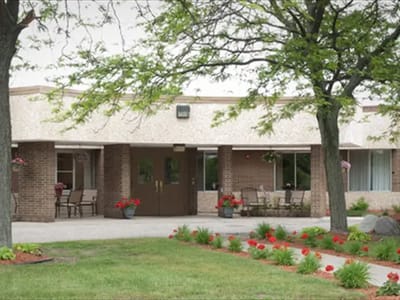
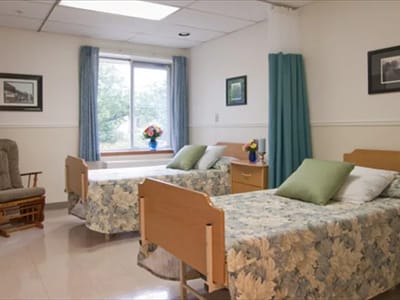


Medilodge of Mt Pleasant is a 132-bed skilled nursing community in Mount Pleasant, Michigan, operated as a privately owned facility since 1980 and currently administered by Mrs. Bobby Sherlock. Located at 1524 Portabella Trail in Isabella County, the nursing home serves a mixed population of short-term rehabilitation and long-term care residents, with current occupancy at 47%, notably below state levels.
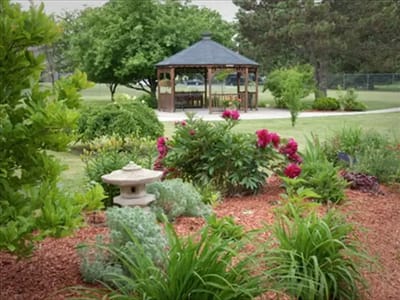
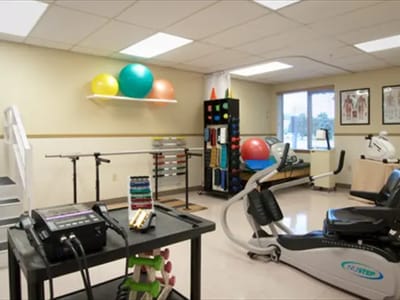
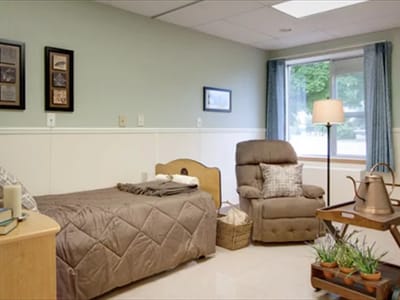
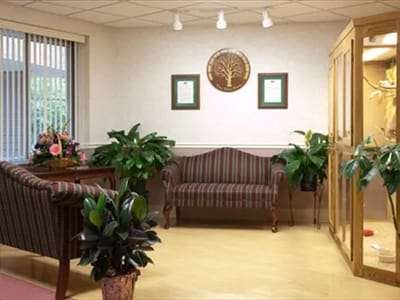
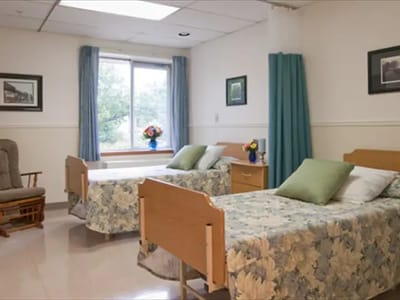
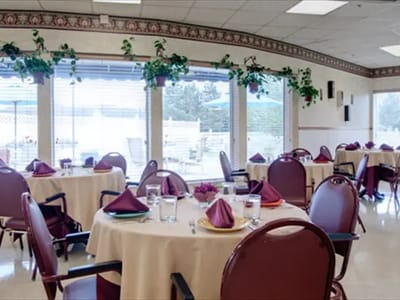
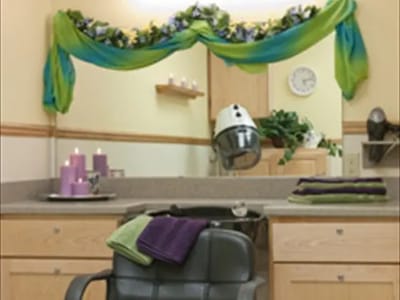
Staffing includes 126 total personnel covering 24-hour skilled nursing, rehabilitation, respite care, specialized services in palliative and hospice care, wound management, IV therapy, fall prevention programming, and secure memory care. On-site clinicians span medical directors, licensed practitioners, and specialists, including an on-site podiatrist, dentist, salon services, and religious services. The community emphasizes fine dining, rehabilitation facilities, and amenities including pet therapy, WiFi, private rooms, gardens, and courtyard spaces.
Average resident stay runs 74 days overall, with Medicare admissions typically staying 28 days and Medicaid residents remaining 8 to 9 months.
The facility holds 4-star CMS ratings for overall performance and health inspection (20.1% above state average), suggesting strong baseline compliance. Yet across five inspections in three years, inspectors documented 16 deficiencies; double the state average.
Most recent findings identified eight compliance gaps: inaccessible call lights for dependent residents, failure to notify family of a fall-related injury, unimplemented fall-prevention interventions, tube-feeding labeling errors, missed nebulizer treatments with inadequate equipment cleaning, narcotic documentation inaccuracies, kitchen sanitation failures, and absence of plumbing-system legionella risk management.
Prior surveys in 2024 and 2023 uncovered similar patterns in medication administration oversight, infection control precautions, tube-feeding protocols, and vaccination compliance.
Two substantiated complaints were documented concerning gaps: December 2023 investigation revealed Resident #5 developed unstageable pressure ulcers from prolonged bedpan exposure; wounds were documented on October 2, but treatment was delayed, and the care plan omitted interventions addressing the identified cause. February 2023 investigation found that a CNA failed to follow a resident’s documented two-person transfer requirement. Staff education was provided following both incidents.
Nursing hours run 3 hours 50 minutes per resident per day, 10% below the state average, with registered nurse hours notably 50% above average, but licensed practical nurse hours 87% below state norms.
Pressure ulcer rates (4.2%) and antipsychotic medication use (0.9%) significantly outperform state benchmarks, as do hospitalization rates and vaccine administration above 97%. Weight loss, falls with major injury, and emergency department visits all exceed state averages negatively.
No federal penalties or payment denials were imposed in three years.
Walk Score 28 reflects a car-dependent neighborhood; the facility sits 0.27 miles from the nearest hospital.
Medilodge serves residents across short-term post-acute care and longer-term skilled nursing needs. However, the pattern of recurrent deficiencies across care coordination, medication administration, and facility maintenance indicates the presence of systemic challenges related to operational improvements and staff oversight protocols.
| Staff type | Hours / Day / Resident | vs state avg |
|---|---|---|
|
Registered Nurse (RN)
| 1h 14m per day | ▲ 60% State avg: 46m per day · National avg: 41m per day |
|
LPN / LVN
| 5m per day | ▼ 90% State avg: 53m per day · National avg: 52m per day |
|
Nurse Aide
| 2h 34m per day | ▲ 7% State avg: 2h 23m per day · National avg: 2h 21m per day |
|
Weekend Total Nursing
| 3h 16m per day | ▼ 7% State avg: 3h 31m per day · National avg: 3h 26m per day |
|
Physical Therapist
| 2m per day | ▼ 52% State avg: 4m per day · National avg: 4m per day |
|
Weekend RN
| 51m per day | ▲ 74% State avg: 29m per day · National avg: 29m per day |
Key information about the people who lead and staff this community.
In South Carolina, the Department of Licensing and Regulatory Affairs (LARA) conducts unannounced inspections and investigations to ensure long-term care facilities comply with state health codes.
Deficiencies
| This Facility | MI Average | vs. MI Avg |
|---|---|---|---|
|
Total deficiencies
| 16 | 8 | This facility has 100% more total deficiencies than a typical South Carolina nursing home (16 vs. MI avg 8).↑ 100% worse |
South Carolina average 3.9
Last Health inspection on Jul 2025
South Carolina average 13.7
South Carolina average 3.44
Health citations are formal notices following inspections when they fail to comply with safety and care standards.
12 of 16 citations resulted from standard inspections; 2 of 16 resulted from complaint investigations; and 2 of 16 came from combined inspections (standard and complaint).
South Carolina average: 1
South Carolina average: 0.3
Reporting period: October 1 – December 31, 2025 (Q4 2025). Source: CMS Payroll-Based Journal report.
Manages medical care and health needs.
Assists with medical care and medications.
Helps with daily care and mobility.
Total hours from contractors
2,540 contractor hours this quarter
| Certified Nursing Assistant | 52 | 0 | 52 | 17,109 | 92 | 100% | 8.4 |
| Registered Nurse | 15 | 0 | 15 | 5,485 | 92 | 100% | 10.2 |
| Clinical Nurse Specialist | 12 | 0 | 12 | 2,086 | 66 | 72% | 9.8 |
| Speech Language Pathologist | 0 | 8 | 8 | 1,102 | 81 | 88% | 6 |
| Other Dietary Services Staff | 5 | 0 | 5 | 974 | 83 | 90% | 7.8 |
| Physical Therapy Assistant | 0 | 7 | 7 | 649 | 84 | 91% | 5 |
| Nurse Practitioner | 1 | 0 | 1 | 630 | 63 | 68% | 10 |
| Licensed Practical Nurse | 3 | 0 | 3 | 593 | 46 | 50% | 10.4 |
| Administrator | 1 | 0 | 1 | 504 | 63 | 68% | 8 |
| Dietitian | 1 | 0 | 1 | 496 | 62 | 67% | 8 |
| Mental Health Service Worker | 1 | 0 | 1 | 496 | 62 | 67% | 8 |
| Physical Therapy Aide | 0 | 2 | 2 | 312 | 58 | 63% | 5.1 |
| Occupational Therapy Aide | 3 | 0 | 3 | 288 | 34 | 37% | 8 |
| Respiratory Therapy Technician | 0 | 8 | 8 | 214 | 61 | 66% | 2.9 |
| Qualified Social Worker | 0 | 3 | 3 | 165 | 35 | 38% | 4.6 |
| Occupational Therapy Assistant | 0 | 1 | 1 | 54 | 20 | 22% | 2.7 |
| Medical Director | 0 | 2 | 2 | 43 | 19 | 21% | 2.3 |
| Nurse Aide in Training | 1 | 0 | 1 | 8 | 1 | 1% | 7.7 |
Federal penalties imposed by CMS for regulatory violations, including civil money penalties (fines) and denials of payment for new Medicare/Medicaid admissions.
Source: CMS Penalties Database
No penalties in the past 3 years
No civil money penalties or payment denials were reported in the last 3 years.
These measures show how residents usually do over time at this home, based on health outcomes and preventive care.
South Carolina average: 8.4
South Carolina average: 16.3
South Carolina average: 12.5%
South Carolina average: 15.3%
South Carolina average: 21.0%
South Carolina average: 3.2%
South Carolina average: 5.7%
South Carolina average: 1.7%
South Carolina average: 5.7%
South Carolina average: 3.9%
South Carolina average: 15.0%
South Carolina average: 94.9%
South Carolina average: 95.0%
South Carolina average: 1.74
South Carolina average: 1.54
South Carolina average: 82.5%
South Carolina average: 1.4%
South Carolina average: 79.5%
South Carolina average: 24.2%
South Carolina average: 11.5%
South Carolina average: 0.8%
South Carolina average: 53.7%
South Carolina average: 50.6%
Quality measures are calculated from Minimum Data Set (MDS) assessments. For most measures, lower percentages indicate better care quality.
23% of new residents, usually for short-term rehab.
53% of new residents, often for short stays.
24% of new residents, often for long-term daily care.
Source: CMS Long-Term Care Facility Characteristics (Data as of Jan 2026)
Residents meet regularly to discuss policies, care quality, and activities
Organized group of residents that meets regularly to discuss facility policies, quality of life, and activities.
Data sourced from CMS Long-Term Care Facility Characteristics quarterly report. Payer mix reflects the current resident census by primary payment source.
Historical financial and operational data for Medilodge of Mt Pleasant from 2011–2023, based on CMS SNF Cost Reports.
Key figures below are for fiscal year ending in 12/2023.
Based on CMS SNF Cost Report for fiscal year ending in 12/2023.
This home supports both short-term rehab and long-term care, with residents staying for a wide range of durations.
Most new residents arrive under private pay (53% of admissions), and a typical private pay stay runs around 24 days.
Coverage residents most often arrive under.
Coverage residents most often leave under.
Bobbie is the Administrator at Medilodge of Mt Pleasant, known for her immediate responsiveness and warm approach to resident needs. She is recognized by residents for her dedication and hands-on leadership, ensuring a welcoming and supportive environment for all.
![]() 0.8 miles from city center
0.8 miles from city center
![]() Estimated distance in miles from Mt Pleasant's city center to Medilodge of Mt Pleasant's address, calculated via Google Maps.
Estimated distance in miles from Mt Pleasant's city center to Medilodge of Mt Pleasant's address, calculated via Google Maps.
Add your location
Info below is compiled from CMS reports & the SC Dept. of Public Health (DPH), senior community websites & trusted data sources such as Walk Score & BBB.
Communities are listed from highest to lowest based on our ranking methodology.
| Laurels of Mt Pleasant | NH HOS PC RC SNF | Mt Pleasant | 100 | 87.5% | +18% | 3.78 | -7% | -12% | $0 | 7 | 2.3 | - | 88 | - | 34 | Tami Bolies | $11.4MFiscal year ending 12/2023 | $6.7MFiscal year ending 12/2023 | 58.4%Fiscal year ending 12/2023 | 235385 | ||||
| Medilodge of Mt Pleasant | NH HOS MC PC RC SNF | Mt Pleasant | 104 | 69.9% | -6% | 3.83 | +17% | -11% | $0 | 16 | 3.2 | 1 | 73 | A+ | 28 | - | $7.3MFiscal year ending 12/2023 | $4.4MFiscal year ending 12/2023 | 59.8%Fiscal year ending 12/2023 | 235490 | ||||
| Oak Harbor Healthcare | NH SNF | Mount Pleasant | 132
Facility
132
SC AVG
90
Rank
#37 / 307 |
91.7%
Facility
91.7%
SC AVG
84.8
Rank
#46 / 94 | +8% | 3.81
Facility
3.81
SC AVG
4.00
Rank
#60 / 118 | -28% | -5% | $7.9k
Facility
$7.9k
SC AVG
$34.8k
Rank
#66 / 120 | 13
Facility
13
SC AVG
13.7
Rank
#70 / 119 | 2.6
Facility
2.6
SC AVG
3.4
Rank
#37 / 119 | 1 | 121 | - | - | Braden Wiscombe | $12.4MFiscal year ending 12/2023
Facility
$12.4MFiscal year ending 12/2023
SC AVG
$13.0M
Rank
#47 / 121 | $6.4MFiscal year ending 12/2023
Facility
$6.4MFiscal year ending 12/2023
SC AVG
$5.4M
Rank
#44 / 121 | 52%Fiscal year ending 12/2023
Facility
52%Fiscal year ending 12/2023
SC AVG
44%
Rank
#83 / 121 | 425110 | ||||
| Cooper River Post Acute | NH SNF | Mount Pleasant | 176
Facility
176
SC AVG
90
Rank
#10 / 307 |
85.8%
Facility
85.8%
SC AVG
84.8
Rank
#65 / 94 | +1% | 3.18
Facility
3.18
SC AVG
4.00
Rank
#101 / 118 | +47% | -21% | $85.0k
Facility
$85.0k
SC AVG
$34.8k
Rank
#117 / 120 | 47
Facility
47
SC AVG
13.7
Rank
#119 / 119 | 7.8
Facility
7.8
SC AVG
3.4
Rank
#118 / 119 | 4 | 151 | - | - | Palmetto Master Tenant, LLC | $18.4MFiscal year ending 12/2023
Facility
$18.4MFiscal year ending 12/2023
SC AVG
$13.0M
Rank
#19 / 121 | $9.9MFiscal year ending 12/2023
Facility
$9.9MFiscal year ending 12/2023
SC AVG
$5.4M
Rank
#14 / 121 | 53.9%Fiscal year ending 12/2023
Facility
53.9%Fiscal year ending 12/2023
SC AVG
44%
Rank
#65 / 121 | 425146 |
Medilodge of Mt Pleasant is located in Mt Pleasant, South Carolina.
Here are the financial assistance programs available to residents in South Carolina.
Medilodge of Mt Pleasant has a walk score of 28. Somewhat walkable. A few nearby services may be reachable on foot, but most trips require transportation.
Medilodge of Mt Pleasant's occupancy is 47.0%.
Medilodge of Mt Pleasant has been operating for approximately 45 years, based on available licensing and registration records.
No, Medilodge of Mt Pleasant has a no-pet policy.
Medilodge of Mt Pleasant is registered as a for-profit in MI.
Yes — there are 18 photos of Medilodge of Mt Pleasant in the photo gallery on this page.
Medilodge of Mt Pleasant is located at 1524 Portabella Trail, Mt Pleasant, MI 48858.
Care Cost Calculator: See Prices in Your Area
Nursing Home Data Explorer
Don’t Wait Too Long: 7 Red Flag Signs Your Parent Needs Assisted Living Now
The True Cost of Assisted Living in 2025 – And How Families Are Paying For It
Understanding Senior Living Costs: Pricing Models, Discounts & Financial Assistance


