Laurels of Mt Pleasant

Nursing Home · Mount Pleasant, SC
CMS overall rating Info The Overall CMS Rating is scored from 1 to 5 stars and combines results from health inspections, staffing levels, and quality measures. Health inspections carry the most weight. Staffing and quality scores can increase or decrease the final rating based on performance compared to state and national standards.
Laurels of Mt Pleasant

Nursing Home in Mount Pleasant

CMS overall rating Info The Overall CMS Rating is scored from 1 to 5 stars and combines results from health inspections, staffing levels, and quality measures. Health inspections carry the most weight. Staffing and quality scores can increase or decrease the final rating based on performance compared to state and national standards.
Calculator: See prices in your area
Laurels of Mt Pleasant accepts Medicare and private pay.

Overview of Laurels of Mt Pleasant

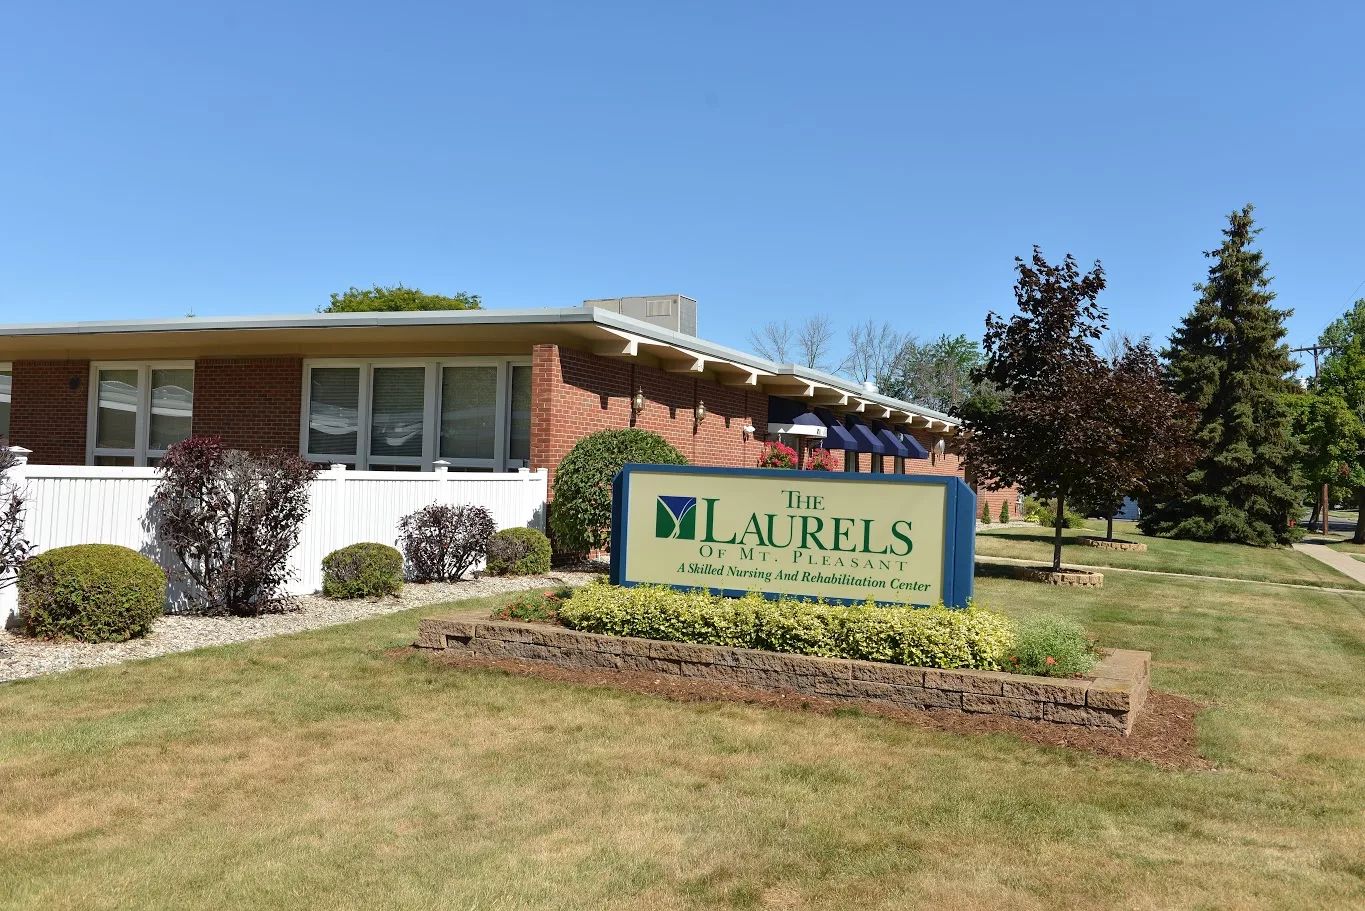
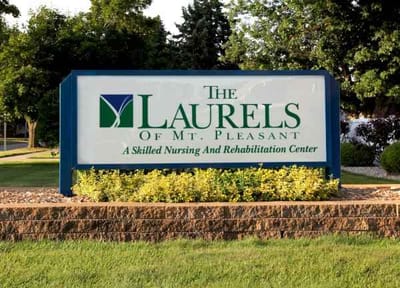
The Laurels of Mt Pleasant, located in Mt Pleasant MI, is a premier provider of short-term rehabilitation, and long-term skilled nursing services. They employe certified and licensed nursing staff, registered nurses and therapists, as well as social workers, to ensure the quality of care their patients and residents receive. Part of the services patients and residents in need of skilled nursing or rehabilitation include hospice care, post-surgery care, respite care, wound and pain management, and skilled services for Alzheimer’s.
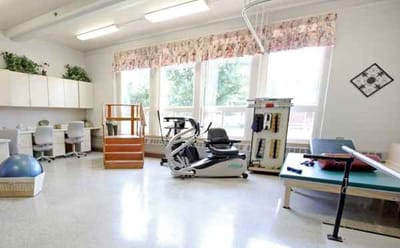
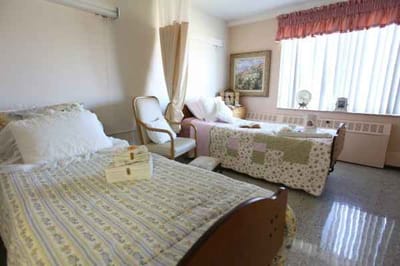
Residents and patients are also able to enjoy a variety of amenities during their stay in The Laurels. Such amenities include private guest rooms, dining services and provisioning, grooming services, and access to rehab gyms.

(989) 773-5918

Quality ratings

Measured by Centers for Medicare & Medicaid Services (CMS)

Overall rating Info The Overall CMS Rating combines results from health inspections, staffing levels and quality measures. Health inspections carry the most weight. Staffing and quality scores can increase or decrease the final rating based on performance compared to state and national standards.
▲ 40.8% Above SC avg.
Health Inspection Info Based on the results of the facility's three most recent standard inspections and any complaint investigations. CMS reviews the number, scope, and severity of deficiencies, with more recent findings weighted more heavily.
▲ 50.2% Above SC avg.
Staffing Info Measures average nursing staff hours per resident per day, including Registered Nurses (RNs) and total nursing staff. Ratings are adjusted based on the level of care residents require and are compared to state and national benchmarks.
▲ 19.0% Above SC avg.
Quality Measures Info Based on clinical and physical health indicators reported to CMS, such as hospital readmissions, falls, pressure ulcers, and improvements in mobility. These measures reflect how well residents' health needs are being managed.
▼ 21.3% Below SC avg.

Staffing hours breakdown

Info Daily nursing hours per resident by staff type, reported to CMS. Higher is generally better — compare this facility to state and national averages to see where staffing stands.

Hours per resident per day — compared to South Carolina state averages

Total nursing care / resident Info This home is ranked 62nd out of 94 homes in South Carolina.

Total adjusted nursing hours per resident per day, combining RN, LPN, and aide time. CMS adjusts this for case-mix so facilities can be fairly compared.
3h 47m per day
Rank #62 / 94Nurse hours — state benchmarkedThis home is ranked 62nd out of 94 homes in Michigan.Shows adjusted nurse hours per resident per day benchmarked to the Michigan average, with a ranking across 94 Michigan SNFs. More hours mean more direct care. The national average is about 3.5 hrs; below 3.0 is a red flag.
This facility South Carolina avg (4h 15m per day)
vs South Carolina avg
-11%

4 of 6 metrics below state avg

Standout metric RN (Weekend) is +10% above state avg
Staff typeHours / dayvs state avg
Registered Nurse (RN) Info RNs hold the highest nursing license and can assess residents, interpret test results, and direct care plans. More RN hours per day often signals stronger clinical oversight and faster response to health changes. 48m per day ▲ 4% State avg: 46m per day · National avg: 41m per day
LPN / LVN Info Licensed Practical Nurses (LPNs) or Licensed Vocational Nurses (LVNs) deliver routine hands-on care — medication administration, wound dressing, and monitoring vital signs. They work under RN supervision and make up a large share of daily bedside care. 34m per day ▼ 36% State avg: 53m per day · National avg: 52m per day
Nurse Aide Info Certified Nurse Aides (CNAs) provide the most direct day-to-day assistance: bathing, dressing, feeding, and mobility. Nurse aide hours are typically the largest staffing category and directly affect residents' quality of life. 2h 8m per day ▼ 10% State avg: 2h 23m per day · National avg: 2h 21m per day
Total Nursing (Weekend) Info Combined nursing hours (RN + LPN + Nurse Aide) per resident per day on weekends. Staffing often drops on weekends — this figure reveals whether the facility maintains adequate coverage outside of weekday hours. 3h 10m per day ▼ 10% State avg: 3h 31m per day · National avg: 3h 26m per day
Physical Therapist Info Hours per resident per day provided by licensed Physical Therapists (PTs) or PT Assistants. PT services help residents recover mobility after injury or illness and are especially important for post-acute (short-stay) rehabilitation. 1m per day ▼ 75% State avg: 4m per day · National avg: 4m per day
RN (Weekend) Info Registered nurse hours specifically on weekends. Facilities sometimes reduce RN presence on Saturdays and Sundays — a low weekend RN figure compared to weekday hours can indicate reduced clinical oversight when most administrative staff are absent. 32m per day ▲ 10% State avg: 29m per day · National avg: 29m per day

Capacity and availability

This home usually has availability

Occupancy lower than 85% suggests more openings may be available.

Lower occupancy than the South Carolina average: 82.1%
Occupancy rate 74.6% Rank #44 / 96Occupancy rate — state benchmarkedThis home is ranked 44th out of 96 homes in Michigan.Shows this facility's occupancy rate versus the Michigan average, with its statewide rank out of 96. Higher occupancy signals strong local demand and financial stability.
Avg. Length of Stay 97 days
Occupancy rate
74.6% Rank #44 / 96Occupancy rate — state benchmarkedThis home is ranked 44th out of 96 homes in Michigan.Shows this facility's occupancy rate versus the Michigan average, with its statewide rank out of 96. Higher occupancy signals strong local demand and financial stability.
Avg. Length of Stay
97 days

Who this home usually serves

TYPE OF STAY

Primarily short stays

Residents typically stay for brief periods, with frequent admissions and discharges throughout the year.

Breakdown by payment type

Medicare

19% of new residents, usually for short-term rehab.

Typical stay 25 days

Private pay

81% of new residents, often for short stays.

Typical stay 3 - 4 months

Finances and operations

Privately-owned community
Operated by a business corporation.
Home revenue
$20.2M
Profit
$550.4K
Privately-owned community Operated by a business corporation.
Home revenue
$20.2M Rank #32 / 95Revenue — state benchmarkedThis home is ranked 32nd out of 95 homes in Michigan.Shows this facility's annual revenue compared to the Michigan SNF average. Higher revenue generally means more resources for staffing and capital — read alongside Payroll %.
Profit
$550.4K
Payroll costs Info The portion of the home's budget spent on staff, including nurses, caregivers, and other employees who support care and operations. Rank #52 / 95Payroll — state benchmarkedThis home is ranked 52nd out of 95 homes in Michigan.Shows total annual staff payroll benchmarked to the Michigan average. Higher payroll investment relative to peers often signals better staffing and less reliance on cheaper contract labor.
$6.7M
33.4% of revenue Rank #81 / 95Payroll % — state benchmarkedThis home is ranked 81st out of 95 homes in Michigan.Shows payroll as a percentage of revenue versus the Michigan average. Well-run SNFs often land around 55–65%. Below 25% may signal understaffing or heavy agency use — read with Staffing ratings.
Other operating costs Info All remaining costs needed to run the home, such as food, utilities, building maintenance, supplies and administrative expenses.
$12.9M
Total costs $19.6M
Walk Score
Walk Score: 34 / 100 Rank #40 / 70Walk Score — state benchmarkedThis home is ranked 40th out of 70 homes in Michigan.Shows how walkable this facility's neighborhood is compared to the average Walk Score across Michigan SNFs. Higher scores benefit residents, families, and staff.
Somewhat walkable. A few nearby services may be reachable on foot, but most trips require transportation.

License Details

CMS Certification Number235385

Contact Laurels of Mt Pleasant

Inspection History

In South Carolina, the Department of Licensing and Regulatory Affairs (LARA) conducts unannounced inspections and investigations to ensure long-term care facilities comply with state health codes.

The data displayed corresponds to the last 4 years.

4 visits/inspections Info Inspections are mandatory, regular evaluations conducted by state health departments or regulatory agencies. They ensure the community provides safe, compliant care, covering areas like resident health, staff and management.

South Carolina average: 5 visits/inspections

Latest inspection

Date June 26, 2025
Routine

9 deficiencies

Deficiencies indicate regulatory issues. A higher number implies the facility had several areas requiring improvement.

South Carolina average: 8 deficiencies

Inspection Report Summary for Laurels of Mt Pleasant

The most recent inspection on June 26, 2025, identified deficiencies related to medication consent, assistance with activities of daily living, shower scheduling, and weight monitoring. Earlier inspections showed a pattern of issues including inadequate supervision to prevent resident altercations, incomplete mental health screenings, improper infection control practices, and call light accessibility. Complaint investigations substantiated failures in supervision that allowed multiple resident-to-resident altercations involving one resident with aggressive behavior. Enforcement actions such as fines or license suspensions were not listed in the available reports. The facility’s deficiencies have persisted over time without a clear pattern of improvement or worsening.

Health Inspection History

Inspections
Total health inspections 3

South Carolina average 3.9


Last Health inspection on Jun 2025

Total health citations
7 Rank #5 / 96Health citations — state benchmarkedThis home is ranked 5th out of 96 homes in Michigan.Shows this facility's total health deficiency citations benchmarked to the Michigan state average, with a ranking across all 96 MI SNFs. Lower citation counts earn a better rank.

South Carolina average 13.7

Citations per inspection
2.33 Rank #7 / 96Citations per inspection — state benchmarkedThis home is ranked 7th out of 96 homes in Michigan.Shows average deficiency citations per CMS inspection for this facility versus the Michigan mean across 96 SNFs with citation data. Lower is better.

South Carolina average 3.44


Health citations are formal notices following inspections when they fail to comply with safety and care standards.

6 of 7 citations resulted from standard inspections; and 1 of 7 resulted from complaint investigations.

Breakdown of citation severity (last 3 years)
Critical Health citations More info
0
100% better than South Carolina average

South Carolina average: 1


Serious Health citations More info 0
100% better than South Carolina average

South Carolina average: 0.3

0 critical citations More info South Carolina average: 1

0 serious citations More info South Carolina average: 0.3

7 moderate citations More info South Carolina average: 12.3

0 minor citations More info South Carolina average: 0.1
Citations history (last 3 years)
Quality of Care moderate citation Info Issues related to how well residents receive appropriate treatment and support for their medical and daily care needs. Jun 26, 2025
Corrected

Quality of Care moderate citation Info Issues related to how well residents receive appropriate treatment and support for their medical and daily care needs. Jun 26, 2025
Corrected

Resident Rights moderate citation Info Issues related to resident's rights, including dignity, privacy, and the ability to make decisions about their care. Jun 26, 2025
Corrected

Infection Control moderate citation Info Issues related to preventing and controlling infections, including hygiene practices and safety protocols. Jul 24, 2024
Corrected

Financial Assistance for
Nursing Home in South Carolina

Laurels of Mt Pleasant is located in Mt Pleasant, South Carolina.
Here are the financial assistance programs available to residents in South Carolina.

Get Financial aid guidance

Community Long Term Care (CLTC)

SC Medicaid CLTC

Age 65+ or disabled
General South Carolina resident, Medicaid-eligible, nursing home-level care need.
Income Limits (2025) ~$2,829/month 300% FBR, individual
Asset Limits $2,000 (individual), $3,000 (couple).
SC

High rural demand; waitlists possible.

Benefits
Personal care (5-7 hours/day) Respite (240 hours/year) Adult day care ($60/day) Home modifications ($1,500 avg.)

South Carolina Respite Care Program

SC NFCSP Respite

Age Caregiver of someone 60+ (or with dementia)
General South Carolina resident.
Income Limits No strict limit; prioritizes low-income.
Asset Limits Not applicable.
SC

Limited slots; rural/urban balance.

Benefits
In-home respite (4-6 hours/day) Adult day care (~$60/day) Short-term facility care (up to 5 days)

Medicare Savings Program (MSP)

South Carolina Medicare Savings Program

Age 65+ or disabled
General SC resident, Medicare Part A/B.
Income Limits (2025) ~$2,510/month (QMB), ~$3,380/month (SLMB), ~$3,598/month (QI)—individual.
Asset Limits $9,430 (individual), $14,130 (couple).
SC

Three tiers; includes Extra Help for Part D; no waitlist.

Benefits
Covers Part B premiums ($174.70/month) Deductibles ($240/year) Copays (~20%)

Low-Income Home Energy Assistance Program (LIHEAP)

South Carolina LIHEAP

Age 60+ prioritized
General SC resident, low-income household.
Income Limits (2025) ~$3,970/month individual, 185% FPL
Asset Limits Not assessed; income-focused.
SC

Covers gas, electric, oil; emergency aid via ECAP (~$500 max).

Benefits
Heating/cooling aid (~$300-$1,000/season) Emergency aid Weatherization

Senior Community Service Employment Program (SCSEP)

South Carolina SCSEP

Age 55+
General unemployed, low-income, SC resident.
Income Limits (2025) ~$1,983/month 125% FPL
Asset Limits Not specified; income-focused.
SC

Priority for veterans, rural residents; Goodwill/AARP partnership.

Benefits
Paid training (~20 hours/week at ~$7.25/hour) Job placement

VA Aid and Attendance (A&A) and Housebound Benefits

South Carolina VA Aid and Attendance/Housebound

Age 65+ or disabled veteran/spouse
General SC resident, wartime service, need for ADL help (A&A) or homebound.
Income Limits (2025) Net income < ~$1,984/month (veteran with dependent, A&A); pension offsets income.
Asset Limits ~$155,356 net worth limit
SC

High veteran population; supports rural/urban care needs.

Benefits
Cash (~$1,433-$2,642/month veteran, ~$951-$1,318 spouse) for care costs (e.g., in-home, assisted living)

Senior Farmers’ Market Nutrition Program (SFMNP)

South Carolina SFMNP

Age 60+
General SC resident, low-income.
Income Limits (2025) ~$2,322/month individual, 185% FPL
Asset Limits Not assessed.
SC

Vouchers (~$50/season); serves ~20,000 annually via 10 AAAs.

Benefits
Vouchers (~$50/season) for fresh produce at approved markets

Homestead Exemption Program

South Carolina Homestead Exemption

Age 65+ (or disabled/blind)
General SC resident 1+ year, homeowner.
Income Limits (2025) None; tax-based eligibility.
Asset Limits Not assessed; home-focused.
SC

Saves ~$500-$1,000/year avg.; applies to primary residence.

Benefits
Property tax exemption (~$50,000 value, ~$500-$1,000/year savings)

Elderly Simplified Application Project (ESAP)

South Carolina ESAP (SNAP for Seniors)

Age 60+
General SC resident, no earned income, not on SCCAP.
Income Limits (2025) ~$1,732/month 133% FPL, individual
Asset Limits $4,250 individual, higher than standard SNAP
SC

Simplified process; serves ~50,000 seniors annually.

Benefits
EBT card for food (~$100-$300/month based on income)

Places of interest near Laurels of Mt Pleasant

Address 0.5 miles from city center Info Estimated distance in miles from Mt Pleasant's city center to Laurels of Mt Pleasant's address, calculated via Google Maps. — 0.04 miles to nearest hospital (DaVita Mt Pleasant Dialysis)

Calculate Travel Distance to Laurels of Mt Pleasant

Add your location

Address

Staffing Data (Q2 2025)

This data corresponds to Q2 2025 and is based on CMS Payroll-Based Journal.

Total staff 100
Employees 84
Contractors 16
Staff to resident ratio 1.16:1
35% worse than South Carolina average

South Carolina average ratio: 1.80:1

Avg staff/day 44
Average shift 8.4 hours
6% better than South Carolina average

South Carolina average: 7.9 hours

Total staff hours (quarter) 33,543
Nursing staff breakdown
Registered Nurse

Manages medical care and health needs.

Total count 12
Average shift length Info Average shift length. Calculated as total hours divided by days worked and average staff per day. 9.3 hours

No contractors work on this role.

Licensed Practical Nurse

Assists with medical care and medications.

Total count 8
Average shift length Info Average shift length. Calculated as total hours divided by days worked and average staff per day. 9.2 hours

No contractors work on this role.

Certified Nursing Assistant

Helps with daily care and mobility.

Total count 48
Average shift length Info Average shift length. Calculated as total hours divided by days worked and average staff per day. 8.4 hours

No contractors work on this role.

Contractor staffing

Total hours from contractors

5.6%

1,876 contractor hours this quarter

Occupational Therapy Assistant: 3 Respiratory Therapy Technician: 3 Clinical Nurse Specialist: 2 Physical Therapy Assistant: 2 Speech Language Pathologist: 2 Qualified Social Worker: 2 Occupational Therapy Aide: 1 Medical Director: 1
Staff by category
Certified Nursing Assistant4804816,81891100%8.4
Registered Nurse120124,32991100%9.3
Licensed Practical Nurse8084,09791100%9.2
Other Dietary Services Staff6062,14191100%7.4
Clinical Nurse Specialist4261,9186571%8.1
Physical Therapy Assistant0229016875%8
Dietitian1014875864%8.4
Administrator1014806066%8
Nurse Practitioner1014725965%8
Mental Health Service Worker1014725965%8
Dental Services Staff1014335560%7.9
Speech Language Pathologist0224286470%6.6
Qualified Social Worker0223124044%7.8
Respiratory Therapy Technician033933033%2.8
Occupational Therapy Aide011591112%5.4
RN Director of Nursing1013667%5.9
Occupational Therapy Assistant033352123%1.7
Medical Director011321820%1.8
48 Certified Nursing Assistant
% of Days 100%
12 Registered Nurse
% of Days 100%
8 Licensed Practical Nurse
% of Days 100%
6 Other Dietary Services Staff
% of Days 100%
6 Clinical Nurse Specialist
% of Days 71%
2 Physical Therapy Assistant
% of Days 75%
1 Dietitian
% of Days 64%
1 Administrator
% of Days 66%
1 Nurse Practitioner
% of Days 65%
1 Mental Health Service Worker
% of Days 65%
1 Dental Services Staff
% of Days 60%
2 Speech Language Pathologist
% of Days 70%
2 Qualified Social Worker
% of Days 44%
3 Respiratory Therapy Technician
% of Days 33%
1 Occupational Therapy Aide
% of Days 12%
1 RN Director of Nursing
% of Days 7%
3 Occupational Therapy Assistant
% of Days 23%
1 Medical Director
% of Days 20%

Facility Characteristics

Source: CMS Long-Term Care Facility Characteristics (Data as of Jan 2026)

Total residents 86
Medicare
7
8.1% of residents
Medicaid
62
72.1% of residents
Private pay or other
17
19.8% of residents
Programs & Services
Residents Group

Residents meet regularly to discuss policies, care quality, and activities

Active Resident Council

Organized group of residents that meets regularly to discuss facility policies, quality of life, and activities.

Quality of care over time

These measures show how residents usually do over time at this home, based on health outcomes and preventive care.

High-risk clinical events score Info A composite score based on pressure ulcers, falls with injury, weight loss, walking ability decline, and activities of daily living decline. 5.0
41% better than South Carolina average

South Carolina average: 8.4

Functional decline score Info A composite score based on activities of daily living decline, walking ability decline, and incontinence. 11.2
32% better than South Carolina average

South Carolina average: 16.3

Long-stay resident measures
Significantly above average South Carolina avg: 4.1 Info CMS star rating based on long-stay quality measure performance. 5 stars = significantly above average, 1 star = significantly below average.
Need for Help with Daily Activities Increased Info Percent of long-stay residents whose need for help with daily activities has increased 5.7%
54% better than South Carolina average

South Carolina average: 12.5%

Walking Ability Worsened Info Percent of long-stay residents whose ability to move independently worsened 11.3%
26% better than South Carolina average

South Carolina average: 15.3%

Low Risk Residents with Bowel/Bladder Incontinence Info Percent of low risk long-stay residents who lose control of their bowels or bladder 16.4%
22% better than South Carolina average

South Carolina average: 21.0%

Falls with Major Injury Info Percent of long-stay residents experiencing one or more falls with major injury 2.9%
7% better than South Carolina average

South Carolina average: 3.2%

High Risk Residents with Pressure Ulcers Info Percent of long-stay high risk residents with pressure ulcers 4.3%
25% better than South Carolina average

South Carolina average: 5.7%

Urinary Tract Infection Info Percent of long-stay residents with a urinary tract infection 0.0%
100% better than South Carolina average

South Carolina average: 1.7%

Lost Too Much Weight Info Percent of long-stay residents who lose too much weight 0.7%
87% better than South Carolina average

South Carolina average: 5.7%

Depressive Symptoms Info Percent of long-stay residents who have depressive symptoms 10.9%
183% worse than South Carolina average

South Carolina average: 3.9%

Antipsychotic Use Info Percent of long-stay residents who received an antipsychotic medication 18.6%
24% worse than South Carolina average

South Carolina average: 15.0%

Pneumococcal Vaccine Info Percent of long-stay residents assessed and appropriately given the pneumococcal vaccine 100.0%
5% better than South Carolina average

South Carolina average: 94.9%

Influenza Vaccine Info Percent of long-stay residents assessed and appropriately given the seasonal influenza vaccine 100.0%
5% better than South Carolina average

South Carolina average: 95.0%

Hospitalizations per 1,000 days Info Number of hospitalizations per 1,000 long-stay resident days. 2.29
32% worse than South Carolina average

South Carolina average: 1.74

ED visits per 1,000 days Info Number of outpatient emergency department visits per 1,000 long-stay resident days. 2.60
69% worse than South Carolina average

South Carolina average: 1.54

Short-stay resident measures
Significantly below average South Carolina avg: 3.3 Info CMS star rating based on short-stay quality measure performance. 5 stars = much above average, 1 star = much below average.
Pneumococcal Vaccine Info Percent of short-stay residents assessed and appropriately given the pneumococcal vaccine 99.5%
20% better than South Carolina average

South Carolina average: 82.5%

Antipsychotic medication increase Info Percent of short-stay residents who newly received an antipsychotic medication 1.4%
In line with South Carolina average

South Carolina average: 1.4%

Influenza Vaccine Info Percent of short-stay residents assessed and appropriately given the seasonal influenza vaccine 94.9%
19% better than South Carolina average

South Carolina average: 79.5%

Re-hospitalized after SNF stay Info Percentage of short-stay residents who were re-hospitalized after their nursing home admission. 31.3%
29% worse than South Carolina average

South Carolina average: 24.2%

Emergency department visits Info Percentage of short-stay residents who had an outpatient emergency department visit. 15.7%
37% worse than South Carolina average

South Carolina average: 11.5%

Falls with major injury Info Percentage of SNF residents who experience falls with major injury during their stay. 0.0%
100% better than South Carolina average

South Carolina average: 0.8%

Ability to care for self at discharge Info Percentage of residents at or above expected ability to care for themselves at discharge. 40.0%
25% worse than South Carolina average

South Carolina average: 53.7%

Successful return to home or community Info Rate of successful return to home or community from a skilled nursing facility. 42.0%
17% worse than South Carolina average

South Carolina average: 50.6%

Penalties and fines

Federal penalties imposed by CMS for regulatory violations, including civil money penalties (fines) and denials of payment for new Medicare/Medicaid admissions.

Source: CMS Penalties Database

No penalties in the past 3 years

No civil money penalties or payment denials were reported in the last 3 years.

Compare Nursing Home around Mount Pleasant The information below is reported by the South Carolina Department of Public Health, Bureau of Healthcare Quality.

5 facilities compared · CMS & SC Dept. of Health data · Updated May 2026

Filter by care type
Laurels of Mt Pleasant
NH

Nursing Home Licensed facility providing 24/7 skilled nursing care for residents with complex, ongoing medical needs. Staffed by RNs, LPNs, and CNAs. Inspected and star-rated annually by CMS. Accepts Medicare (short-term rehab) and Medicaid (long-term care).

AL

Assisted Living A licensed, long-term care setting for seniors or individuals with disabilities who need help with daily activities — like bathing, dressing, and medication management — but not 24-hour skilled nursing. Offers housing, meals, and around-the-clock support while aiming to maximize resident independence.

Mt Pleasant112 74.6% -2%3.78 +19%-12%072.3-87- 34 Bolies, Tami$20.2M$5.3M26.3%235385
Medilodge of Mt Pleasant
NH

Nursing Home Licensed facility providing 24/7 skilled nursing care for residents with complex, ongoing medical needs. Staffed by RNs, LPNs, and CNAs. Inspected and star-rated annually by CMS. Accepts Medicare (short-term rehab) and Medicaid (long-term care).

AL

Assisted Living A licensed, long-term care setting for seniors or individuals with disabilities who need help with daily activities — like bathing, dressing, and medication management — but not 24-hour skilled nursing. Offers housing, meals, and around-the-clock support while aiming to maximize resident independence.

Mt Pleasant132 47.0% -38%3.83 +48%-11%0163.2177A+ 28 -$9.9M$3.8M38%235490
Oak Harbor Healthcare
NH

Nursing Home Licensed facility providing 24/7 skilled nursing care for residents with complex, ongoing medical needs. Staffed by RNs, LPNs, and CNAs. Inspected and star-rated annually by CMS. Accepts Medicare (short-term rehab) and Medicaid (long-term care).

AL

Assisted Living A licensed, long-term care setting for seniors or individuals with disabilities who need help with daily activities — like bathing, dressing, and medication management — but not 24-hour skilled nursing. Offers housing, meals, and around-the-clock support while aiming to maximize resident independence.

Mount Pleasant132 92.1% +12%3.81 -50%-5%1132.61118--Wiscombe, Braden$17.6M$5.6M31.8%425110
Cooper River Post Acute -
NH

Nursing Home Licensed facility providing 24/7 skilled nursing care for residents with complex, ongoing medical needs. Staffed by RNs, LPNs, and CNAs. Inspected and star-rated annually by CMS. Accepts Medicare (short-term rehab) and Medicaid (long-term care).

AL

Assisted Living A licensed, long-term care setting for seniors or individuals with disabilities who need help with daily activities — like bathing, dressing, and medication management — but not 24-hour skilled nursing. Offers housing, meals, and around-the-clock support while aiming to maximize resident independence.

Mount Pleasant176--------0-----------
Franke Home at Seaside -
NH

Nursing Home Licensed facility providing 24/7 skilled nursing care for residents with complex, ongoing medical needs. Staffed by RNs, LPNs, and CNAs. Inspected and star-rated annually by CMS. Accepts Medicare (short-term rehab) and Medicaid (long-term care).

AL

Assisted Living A licensed, long-term care setting for seniors or individuals with disabilities who need help with daily activities — like bathing, dressing, and medication management — but not 24-hour skilled nursing. Offers housing, meals, and around-the-clock support while aiming to maximize resident independence.

Mount Pleasant---------0----- 87 -----

Guides for Better Senior Living

Care Cost Calculator: See Prices in Your Area

Nursing Home Data Explorer

Don’t Wait Too Long: 7 Red Flag Signs Your Parent Needs Assisted Living Now

The True Cost of Assisted Living in 2025 – And How Families Are Paying For It

Understanding Senior Living Costs: Pricing Models, Discounts & Financial Assistance

Frequently Asked Questions about Laurels of Mt Pleasant

Is Laurels of Mt Pleasant in a walkable area?

Laurels of Mt Pleasant has a walk score of 34. Somewhat walkable. A few nearby services may be reachable on foot, but most trips require transportation.

What is the phone number of Laurels of Mt Pleasant?

(989) 773-5918 will put you in contact with the team at Laurels of Mt Pleasant.

Is Laurels of Mt Pleasant Medicare or Medicaid certified?

Yes — Laurels of Mt Pleasant is a CMS-certified provider of Medicare and Medicaid.

Explore Open Rooms
1 Contact details
2 What type of senior care service are you looking for?
3 What budget do you have in mind for senior care?
4 How soon do you need to find care?
5 Additional details

Thank you for your interest!

Our team will be in touch shortly to help with next steps.