Hampton Meadows Assisted Living
Assisted Living · Towson, MD

Hampton Meadows Assisted Living

Assisted Living · Towson, MD
Hampton Meadows Assisted Living accepts Medicaid.

Overview of Hampton Meadows Assisted Living

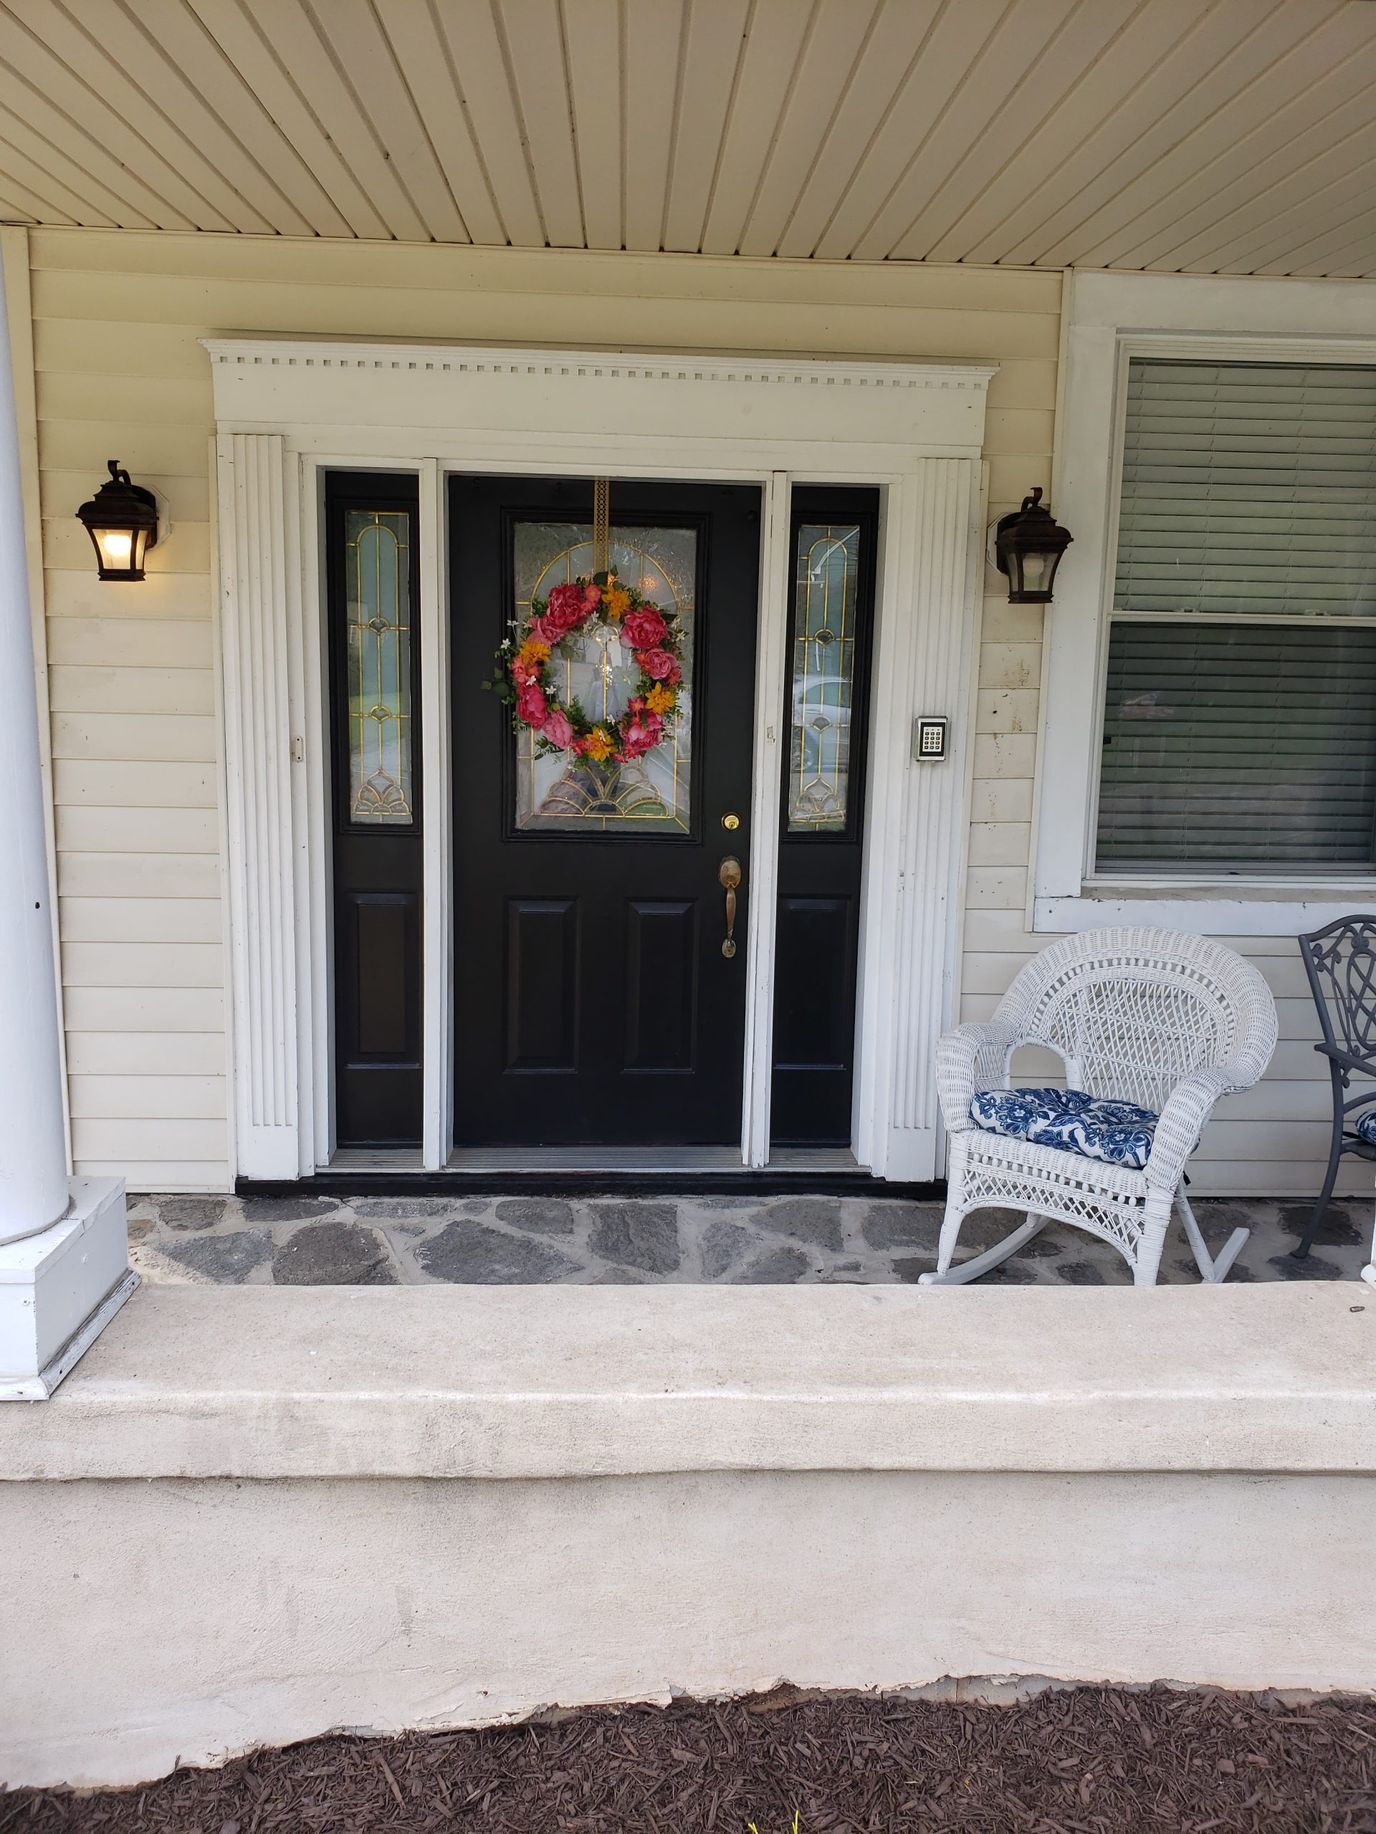
Hampton Meadows Assisted Living in Towson, Maryland, delivers daily personal assistance within a compact, residential environment. Operating with a 15-bed capacity, the home fosters a close-knit atmosphere where caregivers and residents interact on a first-name basis.

Accommodations consist of private and semi-private rooms, allowing residents to weigh personal space against budget preferences. Everyday life includes scheduled arts and crafts, regular exercise sessions, and religious services, alongside kitchen accommodations for specialized dietary needs. Grooming care is handled through the salon, and arranged transportation eliminates the hassle of coordinating rides for appointments and community outings.

Older adults seeking an intimate assisted living home can access straightforward pricing tiers, tailored daily support, and convenient shared amenities in a manageable neighborhood setting.

By The Numbers

Community insights.

Bed count Info A smaller, more intimate setting that may offer a quieter environment and closer staff-resident interactions. 15 Rank #166 / 577Bed count — State benchmarked This assisted living community is ranked 166th out of 577 assisted living communities we track in Maryland for bed count. Shows this facility's certified or reported bed count compared to other Maryland facilities. Larger communities may offer more amenities, programs, and on-site services for residents and families. Communities with the same value for a metric share the same rank. Rankings compare like with like: every assisted living community we track in Maryland that reports data for that category. Assisted living communities without available data are excluded, so the pool size varies from metric to metric.

Smaller home · May offer a more intimate, personalized care environment.

Years of operating Info A longer operating history, which may indicate experience navigating regulations and delivering ongoing care. This is the number of years in operation under current management. Rank #22 / 186Years in operation — State benchmarked This assisted living community is ranked 22nd out of 186 assisted living communities we track in Maryland for years in operation. Shows how long this facility has been in operation compared to other Maryland facilities. Longer operating histories may benefit residents, families, and staff. Communities with the same value for a metric share the same rank. Rankings compare like with like: every assisted living community we track in Maryland that reports data for that category. Assisted living communities without available data are excluded, so the pool size varies from metric to metric.
33 years
Walk Score Info Car-dependent. Most errands require a car, with limited nearby walkable options. Rank #712 / 752Walk Score — State benchmarked This assisted living community is ranked 712th out of 752 assisted living communities we track in Maryland for walk score. Shows how walkable this facility's neighborhood is compared to the average walk score across Maryland facilities. Higher scores benefit residents, families, and staff. Communities with the same value for a metric share the same rank. Rankings compare like with like: every assisted living community we track in Maryland that reports data for that category. Assisted living communities without available data are excluded, so the pool size varies from metric to metric.

5 / 100

About This Community

Pricing & Financial Information

The below pricing was updated on

Private Room
$100 - $185/Day

License Details

Facility TypeAssisted Living
CountyBaltimore

Safety & Compliance

Safety FeaturesKey Pads at doors to help prevent elopement

Staffing & Medical

2 services
Doctor on Staff

Hospice partners Hospice providers this community works with, as listed in the Maryland Health Care Commission's consumer guide. Hospice brings end-of-life and comfort care to residents where they live.

  • Amedisys Hospice of Greater Chesapeake
  • Gilchrist Hospice Care
  • Stella Maris

Memory & Specialized Care

2 services
Dedicated Alzheimer's Unit
Moderate Alzheimer's LevelAccepts residents with moderate (middle-stage) Alzheimer's or dementia, who need regular help with daily activities and closer supervision. Maryland's Health Care Commission asks each assisted living community which stages of Alzheimer's or dementia it accepts and publishes the answer; other states do not report this.

Additional Services

6 services
Nutritious Home-Cooked Meals
Grooming
Laundry & Linen
Housekeeping
TransportationListed as: Arranged Transportation
Beauty Services

Additional Policies & Features

Pets not allowed

Amenities & Lifestyle

Cable Tv
Beauty Salon
Activities
Arts and Crafts

Room Accommodations

Building Type2-story
Room Types
Private Room Semi-Private / Shared Room
In-Room Features
Air Conditioning

Contact Hampton Meadows Assisted Living

Demographics Source: Maryland Health Care Commission consumer guide, as reported by the facility. Maryland is the only state that publishes resident demographics for each community. Data retrieved May 2026.

Resident demographic information for this facility.

Gender

  • Female 73.3%
  • Male 26.7%

Age Distribution

  • 85-94 40%
  • 75-84 33.3%
  • 65-74 26.7%

Ethnicity

  • White 93.3%
  • African American 6.7%

Places of interest near Hampton Meadows Assisted Living

Address 3.1 miles from city center Info Estimated distance in miles from Towson's city center to Hampton Meadows Assisted Living's address, calculated via Google Maps.

Calculate Travel Distance to Hampton Meadows Assisted Living

Add your location

Address

Compare Assisted Living around Towson

Info below is compiled from the MD Dept. of Health (OHCQ), senior community websites & trusted data sources such as Walk Score & BBB.

Communities are listed from highest-ranked to lowest-ranked based on our methodology.

Care Types in This Table AL (Assisted Living): Housing with help for daily activities like bathing, dressing, and medication, without 24-hour skilled nursing. NH (Nursing Home): 24/7 skilled nursing care for residents with complex, ongoing medical needs. SNF (Skilled Nursing Facility): Round-the-clock nursing care, often for recovery after surgery, injury, or illness. MC (Memory Care): Secured, specialized care for people living with Alzheimer's or dementia. IL (Independent Living): Community living with dining, activities, and transportation for active seniors who need little personal care. CCRC (Continuing Care Retirement Community): A campus with multiple care levels so residents can age in place without moving.
City and state of the facility. Used for mapping and state-average comparisons.
Licensed bed capacity (maximum allowed). Not the same as how many beds are currently filled.
Indicates whether residents are allowed to have pets in the facility.
Third-party neighborhood walkability score (0–100). Convenience/context metric, not a healthcare quality measure.
Description of bed or unit types offered (e.g. assisted living, memory care), as reported in state or facility disclosures.
Number of years the company has been in operation.
Better Business Bureau grade for the operating company. Reflects complaint handling and business practices, not clinical care quality.
Percentage of residents reported as male in state demographics, shown as a whole-number percent.
Percentage of residents reported as female in state demographics, shown as a whole-number percent.
Share of residents reported as White in the state-published race/ethnicity breakdown for this facility, shown as a whole-number percent. Parsed from the same source as the profile demographics section.
Share of residents reported as African American or Black in the state breakdown, shown as a whole-number percent. Labels in the raw data are normalized to this bucket for compare.
Combined share of all race/ethnicity groups that are not classified as White or African American (e.g. Hispanic, Asian, multiracial, and other labeled categories), summed to a single whole-number percent.
Share of residents aged 65–74 in reported demographics, as a whole-number percentage of residents.
Share of residents aged 75–84 in reported demographics, as a whole-number percentage of residents.
Share of residents aged 85–94 in reported demographics, as a whole-number percentage of residents.
Share of residents aged 95 or older in reported demographics, as a whole-number percentage of residents.
Pickersgill Retirement Community
AL
IL
NH
SNF
Baltimore (Chestnut Hill)
138
Facility 138
MD AVG 28
Rank #18 / 577
No
45
Facility 45
MD AVG 43
Rank #347 / 752
--A+
24%

Male Residents — State Benchmarked 24% of residents are male, compared to the Maryland average of 31%. This facility caters to a majority female resident pool (76% female), consistent with the broader assisted living trend where women significantly outnumber men.

76%

Female Residents — State Benchmarked 76% of residents are female, compared to the Maryland average of 69%. Women comprise the large majority, consistent with national assisted living demographics where women live longer and enter care facilities at higher rates.

95%

White Residents — State Benchmarked 95% of residents are reported as White, compared to the Maryland average of 81%. A higher White share than is typical for assisted living in Maryland in this dataset — compare with peer facilities for local context.

1%

African American Residents — State Benchmarked 1% of residents are reported as African American or Black, compared to the Maryland average of 13%. A lower African American share than is typical in Maryland; local markets still vary widely.

4%

Other Ethnicity Residents — State Benchmarked 4% of residents fall into categories other than White or African American (combined), compared to the Maryland average of 6%. This column aggregates Hispanic, Asian, multiracial, and any other labeled groups that are not classified as White or African American. Reported subgroups in this total: Asian (4%).

3%

Residents Age 65–74 — State Benchmarked 3% of residents are 65–74, compared to the Maryland average of 13%. Fewer younger seniors suggests the resident population skews older, likely requiring higher acuity care and more hands-on support.

27%

Residents Age 75–84 — State Benchmarked 27% of residents are 75–84, compared to the Maryland average of 31%. This is the second most common age bracket in assisted living, representing residents with moderate care needs.

55%

Residents Age 85–94 — State Benchmarked 55% of residents are 85–94, compared to the Maryland average of 44%. A high concentration of very elderly residents signals a higher-acuity facility with experience caring for advanced age-related needs.

15%

Residents Age 95+ — State Benchmarked 15% of residents are 95 or older, compared to the Maryland average of 16%. In line with the statewide profile for the oldest resident bracket.

Hampton Meadows Assisted Living
AL
Towson
15
Facility 15
MD AVG 28
Rank #166 / 577
No
5
Facility 5
MD AVG 43
Rank #712 / 752
Private / Semi-Private Rooms
33
Facility 33
MD AVG 21
Rank #22 / 186
-
27%

Male Residents — State Benchmarked 27% of residents are male, compared to the Maryland average of 31%. This facility caters to a majority female resident pool (73% female), consistent with the broader assisted living trend where women significantly outnumber men.

73%

Female Residents — State Benchmarked 73% of residents are female, compared to the Maryland average of 69%. Women comprise the large majority, consistent with national assisted living demographics where women live longer and enter care facilities at higher rates.

93%

White Residents — State Benchmarked 93% of residents are reported as White, compared to the Maryland average of 81%. A higher White share than is typical for assisted living in Maryland in this dataset — compare with peer facilities for local context.

7%

African American Residents — State Benchmarked 7% of residents are reported as African American or Black, compared to the Maryland average of 13%. In line with the Maryland average for African American residents among facilities reporting this breakdown.

0%

Other Ethnicity Residents — State Benchmarked 0% of residents fall into categories other than White or African American (combined), compared to the Maryland average of 6%. This column aggregates Hispanic, Asian, multiracial, and any other labeled groups that are not classified as White or African American.

27%

Residents Age 65–74 — State Benchmarked 27% of residents are 65–74, compared to the Maryland average of 13%. A higher share of younger seniors often signals a more independent, active resident community with lower acuity care needs.

33%

Residents Age 75–84 — State Benchmarked 33% of residents are 75–84, compared to the Maryland average of 31%. This is the second most common age bracket in assisted living, representing residents with moderate care needs.

40%

Residents Age 85–94 — State Benchmarked 40% of residents are 85–94, compared to the Maryland average of 44%. This is typically the most common age bracket in assisted living — this facility is in line with the statewide norm.

-
Edenwald Senior Living
AL
CCRC
IL
MC
NH
SNF
Towson
94
Facility 94
MD AVG 28
Rank #67 / 577
No
83
Facility 83
MD AVG 43
Rank #51 / 752
1 Bed / 2 Bed-A+
18%

Male Residents — State Benchmarked 18% of residents are male, compared to the Maryland average of 31%. This facility caters to a majority female resident pool (82% female), consistent with the broader assisted living trend where women significantly outnumber men.

82%

Female Residents — State Benchmarked 82% of residents are female, compared to the Maryland average of 69%. Women comprise the large majority, consistent with national assisted living demographics where women live longer and enter care facilities at higher rates.

100%

White Residents — State Benchmarked 100% of residents are reported as White, compared to the Maryland average of 81%. A higher White share than is typical for assisted living in Maryland in this dataset — compare with peer facilities for local context.

0%

African American Residents — State Benchmarked 0% of residents are reported as African American or Black, compared to the Maryland average of 13%. A lower African American share than is typical in Maryland; local markets still vary widely.

0%

Other Ethnicity Residents — State Benchmarked 0% of residents fall into categories other than White or African American (combined), compared to the Maryland average of 6%. This column aggregates Hispanic, Asian, multiracial, and any other labeled groups that are not classified as White or African American.

-
13%

Residents Age 75–84 — State Benchmarked 13% of residents are 75–84, compared to the Maryland average of 31%. Below the state norm — the resident mix may skew either younger or older than this typical middle bracket.

53%

Residents Age 85–94 — State Benchmarked 53% of residents are 85–94, compared to the Maryland average of 44%. A high concentration of very elderly residents signals a higher-acuity facility with experience caring for advanced age-related needs.

35%

Residents Age 95+ — State Benchmarked 35% of residents are 95 or older, compared to the Maryland average of 16%. A high proportion of the oldest-old suggests strong end-of-life care experience and very-high-acuity capabilities.

Brightview Towson
AL
MC
Towson (Loch Raven)
100
Facility 100
MD AVG 28
Rank #44 / 577
Yes
92
Facility 92
MD AVG 43
Rank #10 / 752
Studio / 1 Bed / 2 Bed
14
Facility 14
MD AVG 21
Rank #127 / 186
-
28%

Male Residents — State Benchmarked 28% of residents are male, compared to the Maryland average of 31%. This facility caters to a majority female resident pool (72% female), consistent with the broader assisted living trend where women significantly outnumber men.

72%

Female Residents — State Benchmarked 72% of residents are female, compared to the Maryland average of 69%. Women comprise the large majority, consistent with national assisted living demographics where women live longer and enter care facilities at higher rates.

0%

White Residents — State Benchmarked 0% of residents are reported as White, compared to the Maryland average of 81%. A lower White share than the Maryland average — the community may draw a more diverse resident mix relative to other facilities in Maryland.

0%

African American Residents — State Benchmarked 0% of residents are reported as African American or Black, compared to the Maryland average of 13%. A lower African American share than is typical in Maryland; local markets still vary widely.

100%

Other Ethnicity Residents — State Benchmarked 100% of residents fall into categories other than White or African American (combined), compared to the Maryland average of 6%. This column aggregates Hispanic, Asian, multiracial, and any other labeled groups that are not classified as White or African American. Reported subgroups in this total: Other (100%).

----
Seaton Towson
AL
Towson
80
Facility 80
MD AVG 28
Rank #89 / 577
Yes
80
Facility 80
MD AVG 43
Rank #70 / 752
Studio / 1 Bed
27
Facility 27
MD AVG 21
Rank #61 / 186
----------

Rank badges are statewide and care-type specific: each assisted living community is ranked against every other MD assisted living community we track that reports that metric, not just the 5 on this page. See how we rank facilities

Know before you visit

Frequently Asked Questions about Hampton Meadows Assisted Living

Quick answers from public records and the community's own listing.
01 Is Hampton Meadows Assisted Living in a walkable area?
Hampton Meadows Assisted Living has a walk score of 5. Car-dependent. Most errands require a car, with limited nearby walkable options.
02 How long has Hampton Meadows Assisted Living been in business?
Hampton Meadows Assisted Living has been operating for approximately 33 years, based on available licensing and registration records.
03 Are pets allowed at Hampton Meadows Assisted Living?
No, Hampton Meadows Assisted Living has a no-pet policy.
04 How many beds does Hampton Meadows Assisted Living have?
Hampton Meadows Assisted Living has 15 beds.
05 How much does Hampton Meadows Assisted Living cost per month?
Pricing at Hampton Meadows Assisted Living starts at $2,400 per month, with rates varying by floorplan and additional care needs.
06 Are there photos of Hampton Meadows Assisted Living?
Yes — there are 19 photos of Hampton Meadows Assisted Living in the photo gallery on this page.
07 What levels of care does Hampton Meadows Assisted Living provide?
Hampton Meadows Assisted Living offers Assisted Living.