


Compare Assisted Living around Bowie
Info below is compiled from the MD Dept. of Health (OHCQ), senior community websites & trusted data sources such as Walk Score & BBB.
Communities are listed from highest to lowest based on our ranking methodology.
| Brookdale Woodward Estates | AL | Bowie (Bowie Town Center) | 100
Facility
100
MD AVG
42
Rank
#109 / 685 | No |
27
Facility
27
MD AVG
43
Rank
#668 / 985 | Studio / 1 Bed / 2 Bed | 27
Facility
27
MD AVG
21
Rank
#62 / 210 | - |
31% Male Residents — State Benchmarked 31% of residents are male, compared to the Maryland average of 31%. This facility caters to a majority female resident pool (69% female), consistent with the broader assisted living trend where women significantly outnumber men. |
69% Female Residents — State Benchmarked 69% of residents are female, compared to the Maryland average of 69%. Women comprise the large majority, consistent with national assisted living demographics where women live longer and enter care facilities at higher rates. |
29% White Residents — State Benchmarked 29% of residents are reported as White, compared to the Maryland average of 81%. A lower White share than the Maryland average — the community may draw a more diverse resident mix relative to other facilities in Maryland. |
69% African American Residents — State Benchmarked 69% of residents are reported as African American or Black, compared to the Maryland average of 13%. A higher African American share than the typical Maryland average — useful context when comparing cultural fit and community composition. |
2% Other Ethnicity Residents — State Benchmarked 2% of residents fall into categories other than White or African American (combined), compared to the Maryland average of 6%. This column aggregates Hispanic, Asian, multiracial, and any other labeled groups that are not classified as White or African American. Reported subgroups in this total: Asian (2%). |
10% Residents Age 65–74 — State Benchmarked 10% of residents are 65–74, compared to the Maryland average of 13%. Fewer younger seniors suggests the resident population skews older, likely requiring higher acuity care and more hands-on support. |
49% Residents Age 75–84 — State Benchmarked 49% of residents are 75–84, compared to the Maryland average of 31%. A high concentration in this mid-range bracket, where residents typically need moderate support with daily activities. |
33% Residents Age 85–94 — State Benchmarked 33% of residents are 85–94, compared to the Maryland average of 44%. The population here skews younger than the statewide norm, which may indicate a more active, lower-acuity community. |
6% Residents Age 95+ — State Benchmarked 6% of residents are 95 or older, compared to the Maryland average of 16%. Most residents here have not yet reached the oldest-old bracket, suggesting a younger overall community. |
| Arbor Terrace at Waugh Chapel | AL MC | Gambrills (Waugh Chapel Towne Centre) | 96
Facility
96
MD AVG
42
Rank
#131 / 685 | Yes |
47
Facility
47
MD AVG
43
Rank
#459 / 985 | - | 4
Facility
4
MD AVG
21
Rank
#195 / 210 | A+ |
30% Male Residents — State Benchmarked 30% of residents are male, compared to the Maryland average of 31%. This facility caters to a majority female resident pool (70% female), consistent with the broader assisted living trend where women significantly outnumber men. |
70% Female Residents — State Benchmarked 70% of residents are female, compared to the Maryland average of 69%. Women comprise the large majority, consistent with national assisted living demographics where women live longer and enter care facilities at higher rates. |
86% White Residents — State Benchmarked 86% of residents are reported as White, compared to the Maryland average of 81%. Close to the average for this category among assisted living facilities in Maryland with reported race/ethnicity data. |
12% African American Residents — State Benchmarked 12% of residents are reported as African American or Black, compared to the Maryland average of 13%. In line with the Maryland average for African American residents among facilities reporting this breakdown. |
3% Other Ethnicity Residents — State Benchmarked 3% of residents fall into categories other than White or African American (combined), compared to the Maryland average of 6%. This column aggregates Hispanic, Asian, multiracial, and any other labeled groups that are not classified as White or African American. Reported subgroups in this total: Asian (1%), Hawaiian/Pacific Islander (1%). |
10% Residents Age 65–74 — State Benchmarked 10% of residents are 65–74, compared to the Maryland average of 13%. Fewer younger seniors suggests the resident population skews older, likely requiring higher acuity care and more hands-on support. |
43% Residents Age 75–84 — State Benchmarked 43% of residents are 75–84, compared to the Maryland average of 31%. A high concentration in this mid-range bracket, where residents typically need moderate support with daily activities. |
39% Residents Age 85–94 — State Benchmarked 39% of residents are 85–94, compared to the Maryland average of 44%. This is typically the most common age bracket in assisted living — this facility is in line with the statewide norm. |
8% Residents Age 95+ — State Benchmarked 8% of residents are 95 or older, compared to the Maryland average of 16%. Most residents here have not yet reached the oldest-old bracket, suggesting a younger overall community. |
| Charter Senior Living of Bowie | AL MC RC | Bowie (Laurel Bowie Road) | 52
Facility
52
MD AVG
42
Rank
#209 / 685 | Yes |
30
Facility
30
MD AVG
43
Rank
#627 / 985 | Studio / 1 Bed / 2 Bed | 26
Facility
26
MD AVG
21
Rank
#77 / 210 | - |
21% Male Residents — State Benchmarked 21% of residents are male, compared to the Maryland average of 31%. This facility caters to a majority female resident pool (79% female), consistent with the broader assisted living trend where women significantly outnumber men. |
79% Female Residents — State Benchmarked 79% of residents are female, compared to the Maryland average of 69%. Women comprise the large majority, consistent with national assisted living demographics where women live longer and enter care facilities at higher rates. |
52% White Residents — State Benchmarked 52% of residents are reported as White, compared to the Maryland average of 81%. A lower White share than the Maryland average — the community may draw a more diverse resident mix relative to other facilities in Maryland. |
46% African American Residents — State Benchmarked 46% of residents are reported as African American or Black, compared to the Maryland average of 13%. A higher African American share than the typical Maryland average — useful context when comparing cultural fit and community composition. |
2% Other Ethnicity Residents — State Benchmarked 2% of residents fall into categories other than White or African American (combined), compared to the Maryland average of 6%. This column aggregates Hispanic, Asian, multiracial, and any other labeled groups that are not classified as White or African American. Reported subgroups in this total: American Indian (2%). | - | - |
83% Residents Age 85–94 — State Benchmarked 83% of residents are 85–94, compared to the Maryland average of 44%. A high concentration of very elderly residents signals a higher-acuity facility with experience caring for advanced age-related needs. |
17% Residents Age 95+ — State Benchmarked 17% of residents are 95 or older, compared to the Maryland average of 16%. In line with the statewide profile for the oldest resident bracket. |
| Tribute at Melford | AL MC | Bowie (Melford Boulevard) | 140
Facility
140
MD AVG
42
Rank
#49 / 685 | Yes |
17
Facility
17
MD AVG
43
Rank
#766 / 985 | Studio / 1 Bed | 5
Facility
5
MD AVG
21
Rank
#184 / 210 | - |
32% Male Residents — State Benchmarked 32% of residents are male, compared to the Maryland average of 31%. This facility caters to a majority female resident pool (68% female), consistent with the broader assisted living trend where women significantly outnumber men. |
68% Female Residents — State Benchmarked 68% of residents are female, compared to the Maryland average of 69%. Women comprise the large majority, consistent with national assisted living demographics where women live longer and enter care facilities at higher rates. |
24% White Residents — State Benchmarked 24% of residents are reported as White, compared to the Maryland average of 81%. A lower White share than the Maryland average — the community may draw a more diverse resident mix relative to other facilities in Maryland. |
58% African American Residents — State Benchmarked 58% of residents are reported as African American or Black, compared to the Maryland average of 13%. A higher African American share than the typical Maryland average — useful context when comparing cultural fit and community composition. |
18% Other Ethnicity Residents — State Benchmarked 18% of residents fall into categories other than White or African American (combined), compared to the Maryland average of 6%. This column aggregates Hispanic, Asian, multiracial, and any other labeled groups that are not classified as White or African American. Reported subgroups in this total: Mixed Race (10%), Asian (4%), Hispanic (4%). |
16% Residents Age 65–74 — State Benchmarked 16% of residents are 65–74, compared to the Maryland average of 13%. In line with the statewide profile for this youngest senior bracket in assisted living. |
26% Residents Age 75–84 — State Benchmarked 26% of residents are 75–84, compared to the Maryland average of 31%. Below the state norm — the resident mix may skew either younger or older than this typical middle bracket. |
36% Residents Age 85–94 — State Benchmarked 36% of residents are 85–94, compared to the Maryland average of 44%. The population here skews younger than the statewide norm, which may indicate a more active, lower-acuity community. |
18% Residents Age 95+ — State Benchmarked 18% of residents are 95 or older, compared to the Maryland average of 16%. In line with the statewide profile for the oldest resident bracket. |
| Arcadia of Crofton II | AL HOS MC NH RC SNF | Gambrills | 16
Facility
16
MD AVG
42
Rank
#246 / 685 | No |
21
Facility
21
MD AVG
43
Rank
#731 / 985 | - | 5
Facility
5
MD AVG
21
Rank
#184 / 210 | - |
36% Male Residents — State Benchmarked 36% of residents are male, compared to the Maryland average of 31%. This facility caters to a majority female resident pool (64% female), consistent with the broader assisted living trend where women significantly outnumber men. |
64% Female Residents — State Benchmarked 64% of residents are female, compared to the Maryland average of 69%. Closer to an even gender split than most assisted living facilities, which typically have 65–75% female residents. |
100% White Residents — State Benchmarked 100% of residents are reported as White, compared to the Maryland average of 81%. A higher White share than is typical for assisted living in Maryland in this dataset — compare with peer facilities for local context. |
0% African American Residents — State Benchmarked 0% of residents are reported as African American or Black, compared to the Maryland average of 13%. A lower African American share than is typical in Maryland; local markets still vary widely. |
0% Other Ethnicity Residents — State Benchmarked 0% of residents fall into categories other than White or African American (combined), compared to the Maryland average of 6%. This column aggregates Hispanic, Asian, multiracial, and any other labeled groups that are not classified as White or African American. |
7% Residents Age 65–74 — State Benchmarked 7% of residents are 65–74, compared to the Maryland average of 13%. Fewer younger seniors suggests the resident population skews older, likely requiring higher acuity care and more hands-on support. |
36% Residents Age 75–84 — State Benchmarked 36% of residents are 75–84, compared to the Maryland average of 31%. This is the second most common age bracket in assisted living, representing residents with moderate care needs. |
29% Residents Age 85–94 — State Benchmarked 29% of residents are 85–94, compared to the Maryland average of 44%. The population here skews younger than the statewide norm, which may indicate a more active, lower-acuity community. |
29% Residents Age 95+ — State Benchmarked 29% of residents are 95 or older, compared to the Maryland average of 16%. A high proportion of the oldest-old suggests strong end-of-life care experience and very-high-acuity capabilities. |
| Caring Hearts & Hands Assisted Living | AL RESC | Bowie (Idlewild) | 8
Facility
8
MD AVG
42
Rank
#301 / 685 | Yes |
41
Facility
41
MD AVG
43
Rank
#508 / 985 | Private Rooms / Semi-Private Rooms | 22
Facility
22
MD AVG
21
Rank
#105 / 210 | A+ | - | - | - | - | - | - | - | - | - |
| Harmony at Enterprise | AL IL MC | Bowie | 102
Facility
102
MD AVG
42
Rank
#104 / 685 | Yes |
7
Facility
7
MD AVG
43
Rank
#876 / 985 | Studio / 1 Bed / 2 Bed | - | - | - | - | - | - | - | - | - | - | - |
| House of Grace | AL HOS | Bowie | 8
Facility
8
MD AVG
42
Rank
#301 / 685 | No |
49
Facility
49
MD AVG
43
Rank
#431 / 985 | - | - | - | - | - | - | - | - | - | - | - | - |
| Castles of Love Assisted Living at Bowie | AL PC | Bowie | - | No |
29
Facility
29
MD AVG
43
Rank
#638 / 985 | Private / Semi-Private Rooms | 27
Facility
27
MD AVG
21
Rank
#62 / 210 | A+ | - | - | - | - | - | - | - | - | - |
| New Horizon AL at Pointer Ridge Drive | AL | Bowie | - | No |
41
Facility
41
MD AVG
43
Rank
#508 / 985 | Private Rooms / Semi-Private Rooms | - | - | - | - | - | - | - | - | - | - | - |
| Nhyira Haven Assisted Living | AL | Bowie | 8
Facility
8
MD AVG
42
Rank
#301 / 685 | No |
33
Facility
33
MD AVG
43
Rank
#597 / 985 | - | - | - | - | - | - | - | - | - | - | - | - |
| Miracle Hands Care Services Assisted Living – Bowie | AL | Bowie | - | No |
36
Facility
36
MD AVG
43
Rank
#563 / 985 | Private / Semi-Private Rooms | - | - | - | - | - | - | - | - | - | - | - |
| New Horizon AL at Heming Lane | AL | Bowie (Essington) | - | No |
36
Facility
36
MD AVG
43
Rank
#563 / 985 | Private / Shared Rooms | - | - | - | - | - | - | - | - | - | - | - |
| Sunlife Assisted Living | AL NH | Bowie | - | No |
35
Facility
35
MD AVG
43
Rank
#583 / 985 | Private Rooms | - | - | - | - | - | - | - | - | - | - | - |
| Clara’s Place I | AL | Turn Bowie (Yorktown) | 8
Facility
8
MD AVG
42
Rank
#301 / 685 | No |
7
Facility
7
MD AVG
43
Rank
#876 / 985 | - | - | - | - | - | - | - | - | - | - | - | - |
Rows per page:

View all Nearby Homes
Overview of Springtime Home Assisted Living Facility


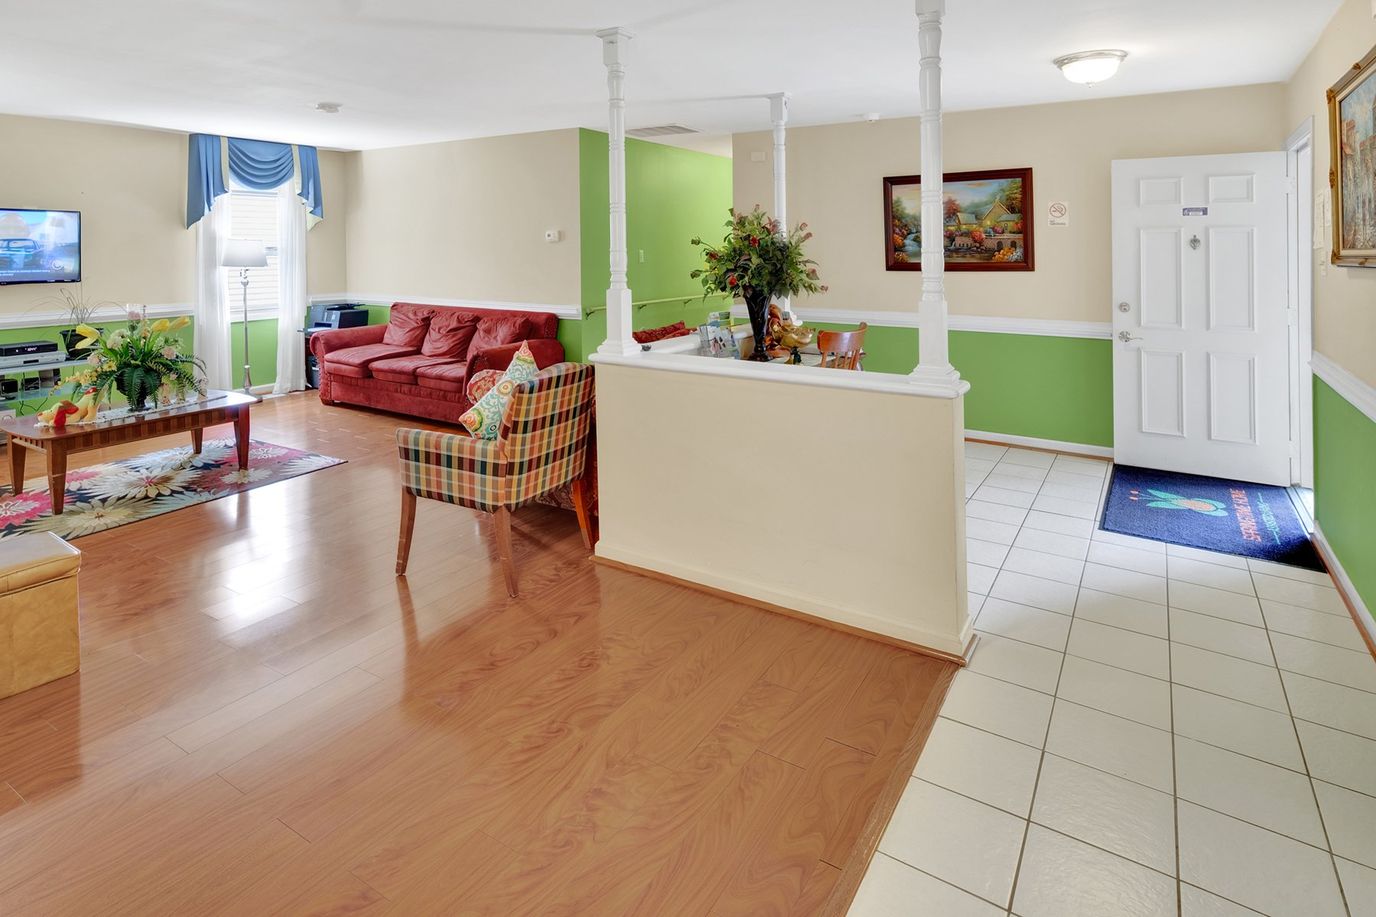
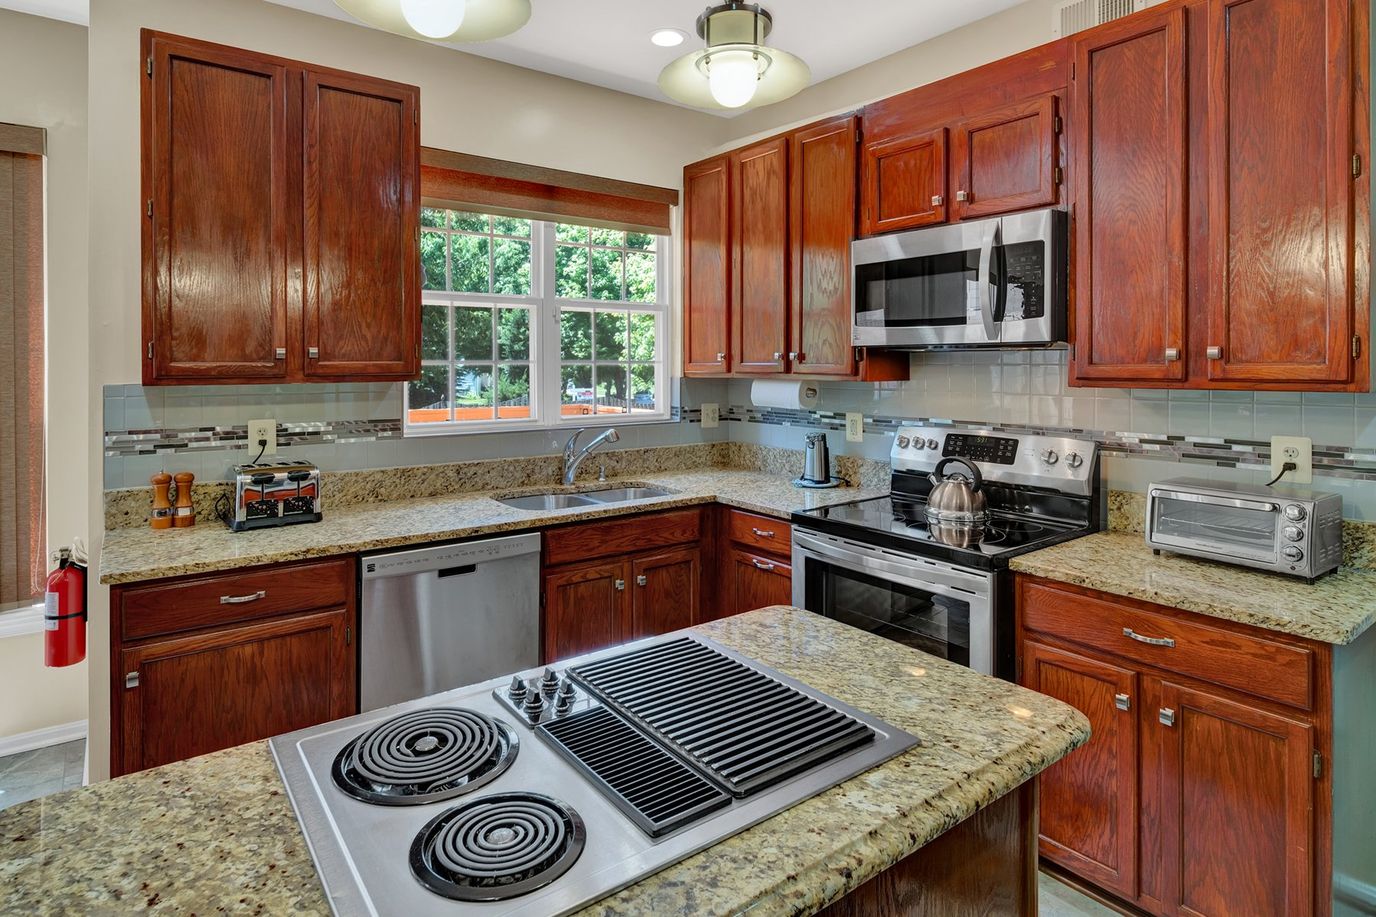
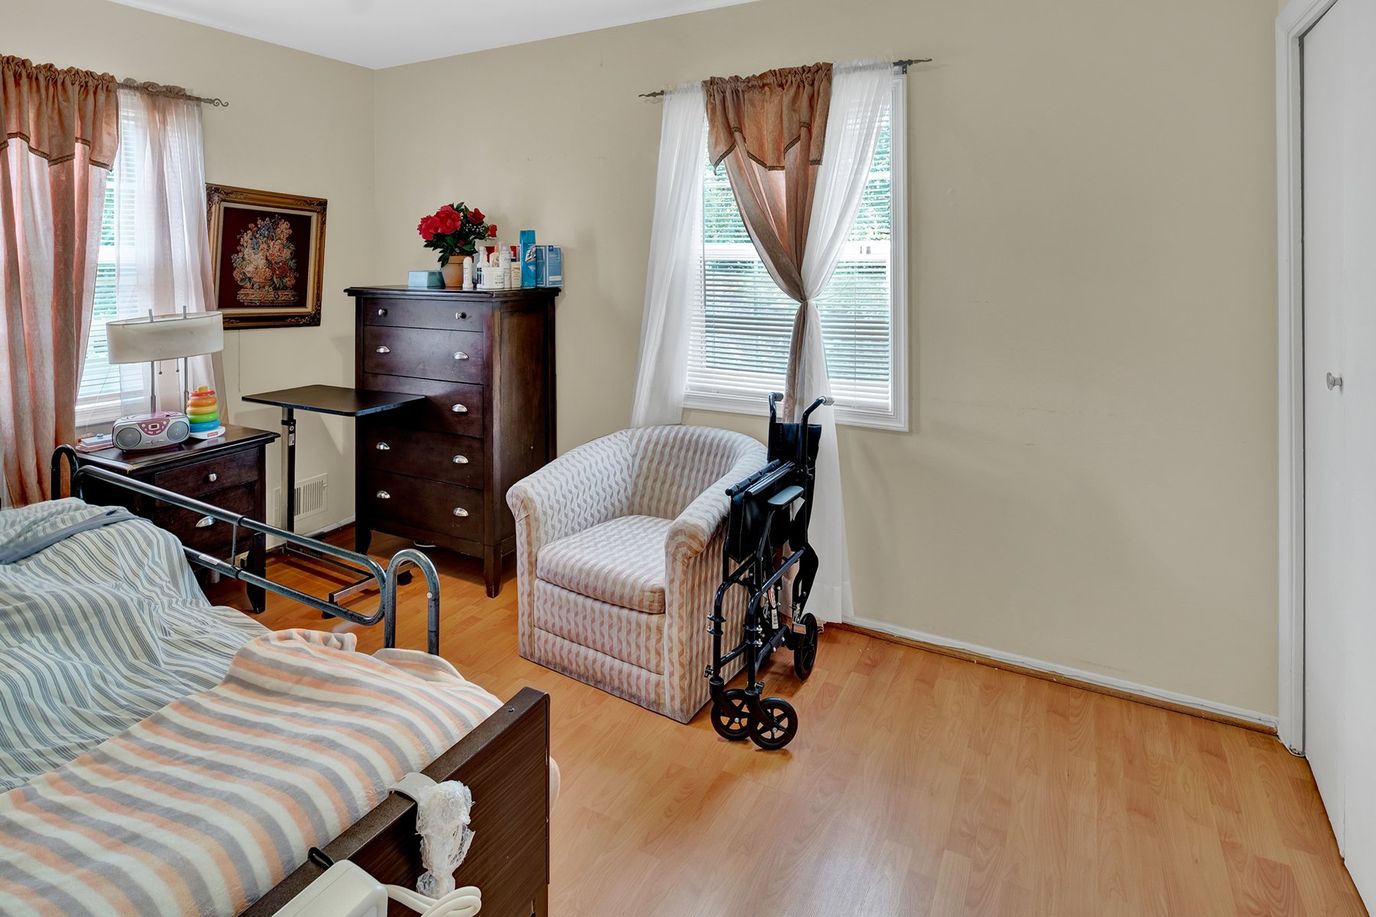
Springtime Home I is a nurse-owned and operated assisted living community in Hyattsville, MD, offering different levels of assisted living services. Promoting a nurturing, home-like environment, the community ensures older adults have a comfortable stay. High-quality services, including well-balanced meals, housekeeping, and laundry, are also provided to help residents maintain their independence. Along with an exceptionally trained care team, the community also follows a resident-centered approach to care for residents’ comfort.
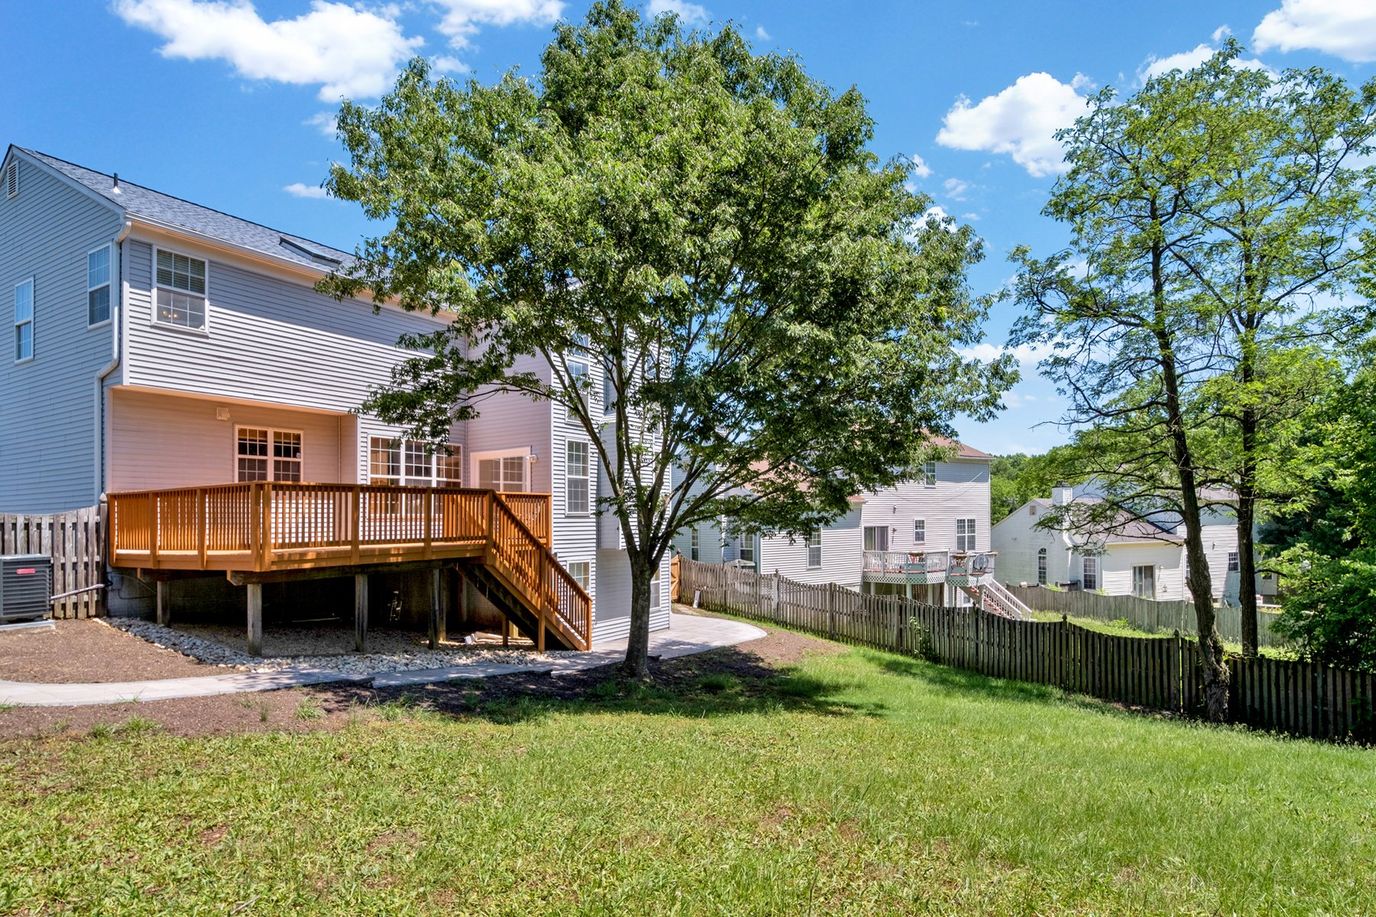
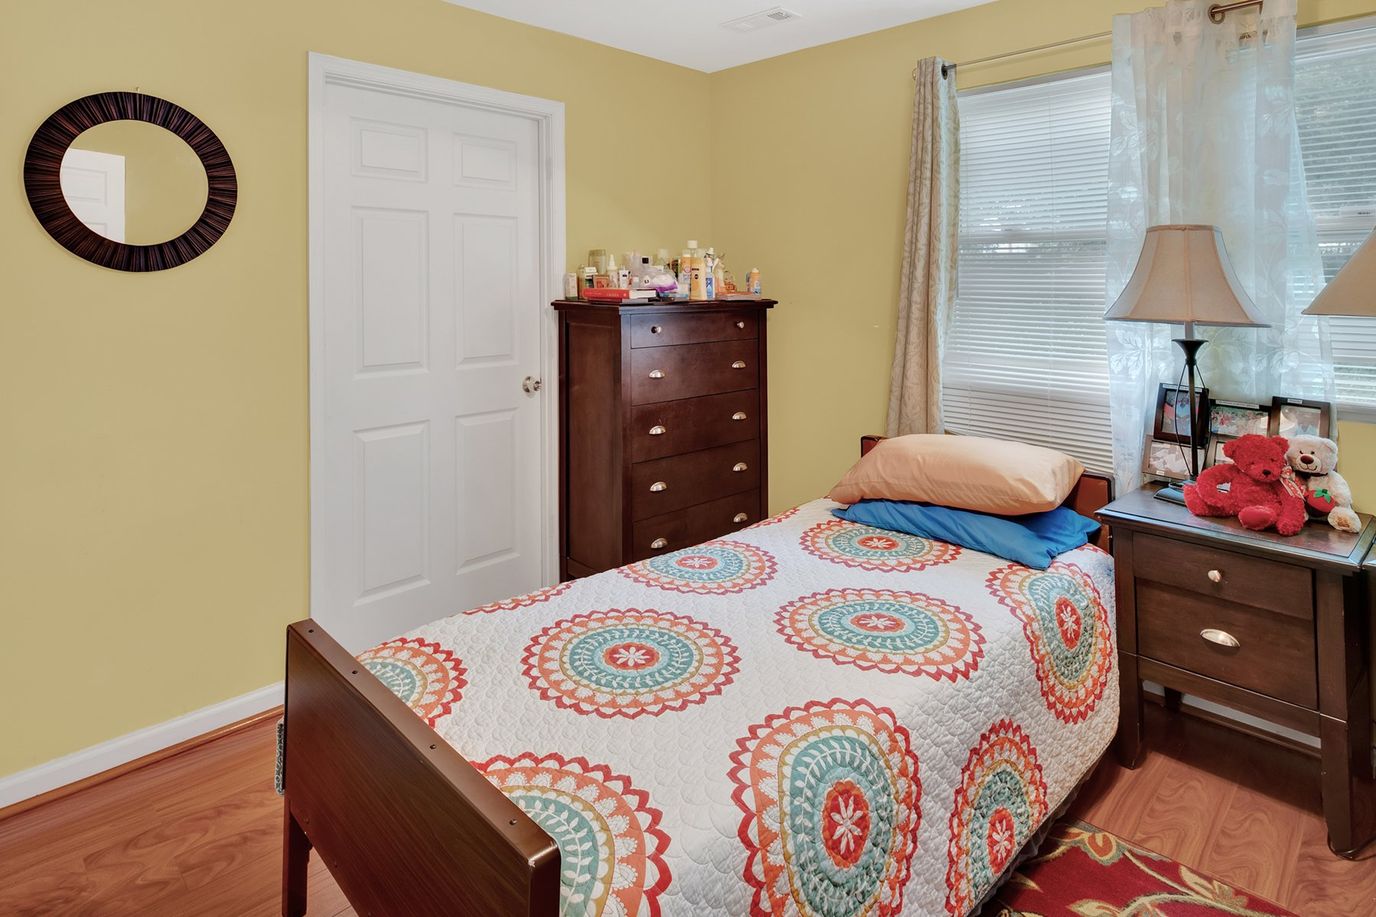
Light exercise and social gatherings help residents live more actively and explore new hobbies. Residents can also relax and connect with their surroundings, as spacious communal areas and cozy rooms are also available. Situated near restaurants, shops, and public transportation in the tree-lined neighborhood of Hyattsville, the community guarantees accessibility and convenience. This assisted living community has high standards of care, making it a great choice for senior living in Maryland.
Welcoming seniors warmly in its charming community, Bowie House IV strives to enhance seniors’ quality of life with residential living care. The community features cozy private and semi-private accommodations for seniors to enjoy every moment of their best years without worries. A kind and compassionate team tends to seniors’ needs and aspirations to ensure they thrive and live to their potential.
Committed to providing residents with the finest care and assistance, the community promotes a vibrant and welcoming environment. Convenient amenities and stunning establishments are within a few steps away from the community to ensure residents are well-cared for. Filled with inviting spaces, Bowie House IV goes above and beyond to provide a safe place for seniors to spend their golden years wonderfully.
Cbl House in Bowie, MD, is an assisted living community that offers assistance with daily living activities and end-of-life services. With a family-oriented and supportive atmosphere, the community ensures older adults feel at home. Exceptional services, including three nutritious meals daily, 24-hour care, laundry, and medication management, are also provided to help residents maintain their independence. Through a collaborative effort with families and healthcare providers, the community creates care plans tailored to residents’ unique needs and habits.
Wellness programs, social events, and a variety of activities help residents maintain holistic wellness and encourage them to live actively. Residents can also relax and socialize in the spacious outdoors and comfortable communal areas. Located in the peaceful residential area of Bowie, the community guarantees a laid-back retirement. As one of the trusted choices for senior living in Maryland, this assisted living community continuously provides high-quality care for older adults’ welfare.
Enjoy the highest quality of life in your later years with Bea’s Hive Assisted Living III located in the harmonious neighborhood of Overbrook Lane, Bowie, MD, offering assisted living. The community is dedicated to enhancing residents’ living experiences with round-the-clock care and assistance from a kind and well-trained team. Housekeeping, laundry, and assistance with daily living activities are provided to ensure a maintenance-free lifestyle.
Empowering residents to live their retirement to the fullest, the community conducts onsite and offsite activities tailored to their leisure and wellness. Transportation to appointments, early dementia care, respite care, and medication administration are also provided to meet residents’ healthcare needs. Enjoy mealtimes with healthy and delicious meals catering to nutritional needs and preferences for a satisfactory dining experience. Residents will surely enjoy their golden years with the community’s specially designed amenities and top-tier services.
Ideally situated in the harmonious neighborhood of Bowie, MD, Eby Health at Brady Court is an idyllic retreat that offers assisted living. Residents can keep their peace of mind with a kind and highly skilled team helping with their daily living activities 24/7. A hassle-free living is also guaranteed, as housekeeping and laundry are taken care of.
Prioritizing residents’ happiness and wellness, a jam-packed calendar of enriching activities and stimulating programs is conducted. Mealtimes foster comfort and satisfy dietary needs with delicious and well-balanced dining options; special diets are also accommodated. Emergency alert system and move-in coordination are available for convenience and safety. With its warm and nurturing environment, residents are guaranteed the finest retirement experience.
Resilient Care Assisted Living II – Bald Hill Terrace is a distinct community in Bald Hill Terrace, Bowie, MD, that offers assisted living. Here, personalized care is provided 24/7 to meet residents’ special needs in retirement; those with dementia also receive specialized dementia programs to enhance their cognition. The community also handles the housekeeping and laundry services for a maintenance-free lifestyle.
Elevate your retirement with enriching activities and stimulating programs conducted to keep residents active and well-engaged. Medication management, pharmacy-delivered prescriptions, and nurses are available to meet residents’ healthcare needs. The community is ideal for those who need assistance in living their day-to-day activities with its genuine care and wheelchair-accessible amenities.
Ranking Methodology
How we rank these assisted living communities
Every community above is evaluated across six weighted categories using public data including state inspection records, review platforms, BBB profiles, and operator-published materials.
Weighting overview
- 35%Resident Experience
- 25%Regulatory
- 15%Visual Media
- 10%Website
- 10%Stability
- 5%Environment
01
Resident & Family Experience 35%
The single largest share of every ranking. Aggregated review sentiment and volume from major platforms — the closest signal to real resident experience.
- Includes
- Review Sentiment
- Review Volume
02
Regulatory & Safety Record 25%
State inspection records, citations, and complaint visits. We weight per-inspection rates more heavily than raw counts.
- Includes
- State Inspections
- Citations/Inspection
- % Inspections w/ Citations
- Complaint Visits
- Accreditations
- BBB Rating
03
Visual Media & Transparency 15%
Communities that publish high-quality visuals give families a real preview. No photos or tours = a negative transparency signal.
- Includes
- Video Tours
- Virtual Walkthroughs
- Photo Quantity
- Photo Quality
04
Website & Operator Transparency 10%
Site quality and whether the operator publishes basic accountability information — staff names, contact details, ownership.
- Includes
- Website Content
- Mobile Usability
- Staff Info Available
- Owner Info Available
05
Community Stability 10%
Operational signals indicating whether a community is well-run and meeting demand.
- Includes
- Occupancy Rate
- Bed Options
06
Environment & Pricing 5%
Walkability and pricing transparency. Walk Score is weighted higher for Independent Living than for Memory Care, where most residents do not leave unaccompanied.
- Includes
- Walk Score
- Pricing Transparency
Who we are
Your Senior Care Partner, Every Step of the Way
We help families find affordable senior communities and unlock same day discounts, Medicaid, and Medicare options tailored to your needs.
Contact us Today
Frequently Asked Questions about Assisted Living in Bowie, MD
What is the average cost of assisted living in Bowie, MD?
The average monthly cost of assisted living in Bowie, MD is approximately $5,800. Actual rates vary by community, level of care, and floorplan.
What is the price range for assisted living in Bowie, MD?
Assisted living in Bowie, MD typically ranges from $5,300–$7,900 per month, depending on the community, room type, and care needs.
What is the typical staff-to-resident ratio at assisted living facilities in Bowie, MD?
Assisted living facilities in Bowie, MD typically operate with a staff-to-resident ratio in the range of 1:6 to 1:12.
What's the difference between assisted living and memory care in Maryland?
Assisted living in Maryland supports residents with daily activities (bathing, dressing, medication management) while preserving independence. Memory care is a specialized form of assisted living for residents living with Alzheimer's or dementia, and adds 24/7 secured environments, dementia-trained staff, and structured routines designed to reduce confusion and wandering.
What's the difference between assisted living and a nursing home in Maryland?
Assisted living in Maryland is a residential model focused on housing, hospitality, and help with daily activities. Nursing homes (skilled nursing facilities) provide 24/7 medical care from licensed nurses for residents with significant health needs, and are regulated more strictly under both state and federal CMS rules.
Does Maryland Medicaid cover assisted living?
Maryland Medicaid does not directly pay room-and-board for assisted living, but most states (including Maryland) offer Home and Community-Based Services (HCBS) waivers that can offset the cost of care services delivered inside a licensed community. Eligibility, waitlists, and covered services vary — check directly with the state Medicaid agency.
What is assisted living?
Assisted living combines private or semi-private apartments with help on activities of daily living (meals, bathing, dressing, medication management) and a social calendar — for residents who need some support but do not need 24/7 medical care.
Updated on
