


Compare Assisted Living around Silver Spring
Info below is compiled from the MD Dept. of Health (OHCQ), senior community websites & trusted data sources such as Walk Score & BBB.
Communities are listed from highest to lowest based on our ranking methodology.
| Bedford Court, a CCRC | AL HOS IL MC NH RC SNF | Silver Spring (International Drive) | 76
Facility
76
MD AVG
42
Rank
#174 / 685 | Yes |
64
Facility
64
MD AVG
43
Rank
#261 / 985 | Studio / 1 Bed | 34
Facility
34
MD AVG
21
Rank
#22 / 210 |
15% Male Residents — State Benchmarked 15% of residents are male, compared to the Maryland average of 31%. This facility caters to a majority female resident pool (85% female), consistent with the broader assisted living trend where women significantly outnumber men. |
85% Female Residents — State Benchmarked 85% of residents are female, compared to the Maryland average of 69%. Women comprise the large majority, consistent with national assisted living demographics where women live longer and enter care facilities at higher rates. |
95% White Residents — State Benchmarked 95% of residents are reported as White, compared to the Maryland average of 81%. A higher White share than is typical for assisted living in Maryland in this dataset — compare with peer facilities for local context. |
3% African American Residents — State Benchmarked 3% of residents are reported as African American or Black, compared to the Maryland average of 13%. A lower African American share than is typical in Maryland; local markets still vary widely. |
2% Other Ethnicity Residents — State Benchmarked 2% of residents fall into categories other than White or African American (combined), compared to the Maryland average of 6%. This column aggregates Hispanic, Asian, multiracial, and any other labeled groups that are not classified as White or African American. Reported subgroups in this total: Asian (2%). |
2% Residents Age 65–74 — State Benchmarked 2% of residents are 65–74, compared to the Maryland average of 13%. Fewer younger seniors suggests the resident population skews older, likely requiring higher acuity care and more hands-on support. |
8% Residents Age 75–84 — State Benchmarked 8% of residents are 75–84, compared to the Maryland average of 31%. Below the state norm — the resident mix may skew either younger or older than this typical middle bracket. |
65% Residents Age 85–94 — State Benchmarked 65% of residents are 85–94, compared to the Maryland average of 44%. A high concentration of very elderly residents signals a higher-acuity facility with experience caring for advanced age-related needs. |
26% Residents Age 95+ — State Benchmarked 26% of residents are 95 or older, compared to the Maryland average of 16%. A high proportion of the oldest-old suggests strong end-of-life care experience and very-high-acuity capabilities. |
| Bedford Court | AL HOS IL MC NH RC SNF | Silver Spring (International Drive) | 76
Facility
76
MD AVG
42
Rank
#174 / 685 | Yes |
66
Facility
66
MD AVG
43
Rank
#240 / 985 | Studio / 1 Bed / 2 Bed | 34
Facility
34
MD AVG
21
Rank
#22 / 210 |
15% Male Residents — State Benchmarked 15% of residents are male, compared to the Maryland average of 31%. This facility caters to a majority female resident pool (85% female), consistent with the broader assisted living trend where women significantly outnumber men. |
85% Female Residents — State Benchmarked 85% of residents are female, compared to the Maryland average of 69%. Women comprise the large majority, consistent with national assisted living demographics where women live longer and enter care facilities at higher rates. |
95% White Residents — State Benchmarked 95% of residents are reported as White, compared to the Maryland average of 81%. A higher White share than is typical for assisted living in Maryland in this dataset — compare with peer facilities for local context. |
3% African American Residents — State Benchmarked 3% of residents are reported as African American or Black, compared to the Maryland average of 13%. A lower African American share than is typical in Maryland; local markets still vary widely. |
2% Other Ethnicity Residents — State Benchmarked 2% of residents fall into categories other than White or African American (combined), compared to the Maryland average of 6%. This column aggregates Hispanic, Asian, multiracial, and any other labeled groups that are not classified as White or African American. Reported subgroups in this total: Asian (2%). |
2% Residents Age 65–74 — State Benchmarked 2% of residents are 65–74, compared to the Maryland average of 13%. Fewer younger seniors suggests the resident population skews older, likely requiring higher acuity care and more hands-on support. |
8% Residents Age 75–84 — State Benchmarked 8% of residents are 75–84, compared to the Maryland average of 31%. Below the state norm — the resident mix may skew either younger or older than this typical middle bracket. |
65% Residents Age 85–94 — State Benchmarked 65% of residents are 85–94, compared to the Maryland average of 44%. A high concentration of very elderly residents signals a higher-acuity facility with experience caring for advanced age-related needs. |
26% Residents Age 95+ — State Benchmarked 26% of residents are 95 or older, compared to the Maryland average of 16%. A high proportion of the oldest-old suggests strong end-of-life care experience and very-high-acuity capabilities. |
| Riderwood Village | AL IL MC | Silver Spring | 275
Facility
275
MD AVG
42
Rank
#3 / 685 | Yes |
33
Facility
33
MD AVG
43
Rank
#597 / 985 | - | 23
Facility
23
MD AVG
21
Rank
#101 / 210 |
29% Male Residents — State Benchmarked 29% of residents are male, compared to the Maryland average of 31%. This facility caters to a majority female resident pool (71% female), consistent with the broader assisted living trend where women significantly outnumber men. |
71% Female Residents — State Benchmarked 71% of residents are female, compared to the Maryland average of 69%. Women comprise the large majority, consistent with national assisted living demographics where women live longer and enter care facilities at higher rates. |
89% White Residents — State Benchmarked 89% of residents are reported as White, compared to the Maryland average of 81%. Close to the average for this category among assisted living facilities in Maryland with reported race/ethnicity data. |
7% African American Residents — State Benchmarked 7% of residents are reported as African American or Black, compared to the Maryland average of 13%. In line with the Maryland average for African American residents among facilities reporting this breakdown. |
4% Other Ethnicity Residents — State Benchmarked 4% of residents fall into categories other than White or African American (combined), compared to the Maryland average of 6%. This column aggregates Hispanic, Asian, multiracial, and any other labeled groups that are not classified as White or African American. Reported subgroups in this total: Asian (3%), Hispanic (0%). |
2% Residents Age 65–74 — State Benchmarked 2% of residents are 65–74, compared to the Maryland average of 13%. Fewer younger seniors suggests the resident population skews older, likely requiring higher acuity care and more hands-on support. |
23% Residents Age 75–84 — State Benchmarked 23% of residents are 75–84, compared to the Maryland average of 31%. Below the state norm — the resident mix may skew either younger or older than this typical middle bracket. |
52% Residents Age 85–94 — State Benchmarked 52% of residents are 85–94, compared to the Maryland average of 44%. A high concentration of very elderly residents signals a higher-acuity facility with experience caring for advanced age-related needs. |
23% Residents Age 95+ — State Benchmarked 23% of residents are 95 or older, compared to the Maryland average of 16%. A high proportion of the oldest-old suggests strong end-of-life care experience and very-high-acuity capabilities. |
| Sunrise of Chevy Chase | AL MC | Silver Spring (Rock Creek Gardens) | 196
Facility
196
MD AVG
42
Rank
#10 / 685 | No |
71
Facility
71
MD AVG
43
Rank
#175 / 985 | Studio / 1 Bed / 2 Bed | 8
Facility
8
MD AVG
21
Rank
#164 / 210 |
58% Male Residents — State Benchmarked 58% of residents are male, compared to the Maryland average of 31%. An unusually high male share for assisted living, where most facilities skew heavily female. |
42% Female Residents — State Benchmarked 42% of residents are female, compared to the Maryland average of 69%. An unusually low female share — most assisted living facilities have 65–75% female residents. |
69% White Residents — State Benchmarked 69% of residents are reported as White, compared to the Maryland average of 81%. A lower White share than the Maryland average — the community may draw a more diverse resident mix relative to other facilities in Maryland. |
28% African American Residents — State Benchmarked 28% of residents are reported as African American or Black, compared to the Maryland average of 13%. A higher African American share than the typical Maryland average — useful context when comparing cultural fit and community composition. |
3% Other Ethnicity Residents — State Benchmarked 3% of residents fall into categories other than White or African American (combined), compared to the Maryland average of 6%. This column aggregates Hispanic, Asian, multiracial, and any other labeled groups that are not classified as White or African American. Reported subgroups in this total: Hispanic (2%), Asian (1%). |
12% Residents Age 65–74 — State Benchmarked 12% of residents are 65–74, compared to the Maryland average of 13%. In line with the statewide profile for this youngest senior bracket in assisted living. |
39% Residents Age 75–84 — State Benchmarked 39% of residents are 75–84, compared to the Maryland average of 31%. A high concentration in this mid-range bracket, where residents typically need moderate support with daily activities. |
42% Residents Age 85–94 — State Benchmarked 42% of residents are 85–94, compared to the Maryland average of 44%. This is typically the most common age bracket in assisted living — this facility is in line with the statewide norm. |
6% Residents Age 95+ — State Benchmarked 6% of residents are 95 or older, compared to the Maryland average of 16%. Most residents here have not yet reached the oldest-old bracket, suggesting a younger overall community. |
| The Terraces at Westminster | AL MC RC | Westminster (Washington Heights) | 75
Facility
75
MD AVG
42
Rank
#176 / 685 | No |
76
Facility
76
MD AVG
43
Rank
#118 / 985 | - | 27
Facility
27
MD AVG
21
Rank
#62 / 210 |
22% Male Residents — State Benchmarked 22% of residents are male, compared to the Maryland average of 31%. This facility caters to a majority female resident pool (78% female), consistent with the broader assisted living trend where women significantly outnumber men. |
78% Female Residents — State Benchmarked 78% of residents are female, compared to the Maryland average of 69%. Women comprise the large majority, consistent with national assisted living demographics where women live longer and enter care facilities at higher rates. |
98% White Residents — State Benchmarked 98% of residents are reported as White, compared to the Maryland average of 81%. A higher White share than is typical for assisted living in Maryland in this dataset — compare with peer facilities for local context. |
2% African American Residents — State Benchmarked 2% of residents are reported as African American or Black, compared to the Maryland average of 13%. A lower African American share than is typical in Maryland; local markets still vary widely. |
0% Other Ethnicity Residents — State Benchmarked 0% of residents fall into categories other than White or African American (combined), compared to the Maryland average of 6%. This column aggregates Hispanic, Asian, multiracial, and any other labeled groups that are not classified as White or African American. |
22% Residents Age 65–74 — State Benchmarked 22% of residents are 65–74, compared to the Maryland average of 13%. A higher share of younger seniors often signals a more independent, active resident community with lower acuity care needs. |
46% Residents Age 75–84 — State Benchmarked 46% of residents are 75–84, compared to the Maryland average of 31%. A high concentration in this mid-range bracket, where residents typically need moderate support with daily activities. |
25% Residents Age 85–94 — State Benchmarked 25% of residents are 85–94, compared to the Maryland average of 44%. The population here skews younger than the statewide norm, which may indicate a more active, lower-acuity community. |
6% Residents Age 95+ — State Benchmarked 6% of residents are 95 or older, compared to the Maryland average of 16%. Most residents here have not yet reached the oldest-old bracket, suggesting a younger overall community. |
| Sunrise of Silver Spring | AL HOS MC RC | Silver Spring (New Hampshire Avenue) | 84
Facility
84
MD AVG
42
Rank
#160 / 685 | Yes |
40
Facility
40
MD AVG
43
Rank
#523 / 985 | Studio / 1 Bed / 2 Bed | 24
Facility
24
MD AVG
21
Rank
#93 / 210 |
31% Male Residents — State Benchmarked 31% of residents are male, compared to the Maryland average of 31%. This facility caters to a majority female resident pool (69% female), consistent with the broader assisted living trend where women significantly outnumber men. |
69% Female Residents — State Benchmarked 69% of residents are female, compared to the Maryland average of 69%. Women comprise the large majority, consistent with national assisted living demographics where women live longer and enter care facilities at higher rates. |
53% White Residents — State Benchmarked 53% of residents are reported as White, compared to the Maryland average of 81%. A lower White share than the Maryland average — the community may draw a more diverse resident mix relative to other facilities in Maryland. |
39% African American Residents — State Benchmarked 39% of residents are reported as African American or Black, compared to the Maryland average of 13%. A higher African American share than the typical Maryland average — useful context when comparing cultural fit and community composition. |
9% Other Ethnicity Residents — State Benchmarked 9% of residents fall into categories other than White or African American (combined), compared to the Maryland average of 6%. This column aggregates Hispanic, Asian, multiracial, and any other labeled groups that are not classified as White or African American. Reported subgroups in this total: Asian (4%), Hawaiian/Pacific Islander (3%), Hispanic (1%). |
4% Residents Age 65–74 — State Benchmarked 4% of residents are 65–74, compared to the Maryland average of 13%. Fewer younger seniors suggests the resident population skews older, likely requiring higher acuity care and more hands-on support. |
43% Residents Age 75–84 — State Benchmarked 43% of residents are 75–84, compared to the Maryland average of 31%. A high concentration in this mid-range bracket, where residents typically need moderate support with daily activities. |
37% Residents Age 85–94 — State Benchmarked 37% of residents are 85–94, compared to the Maryland average of 44%. The population here skews younger than the statewide norm, which may indicate a more active, lower-acuity community. |
14% Residents Age 95+ — State Benchmarked 14% of residents are 95 or older, compared to the Maryland average of 16%. In line with the statewide profile for the oldest resident bracket. |
| Seaton Silver Spring | AL IL | Silver Spring (Homecrest Road) | 55
Facility
55
MD AVG
42
Rank
#206 / 685 | Yes |
33
Facility
33
MD AVG
43
Rank
#597 / 985 | 1 Bed / 2 Bed | 36
Facility
36
MD AVG
21
Rank
#16 / 210 |
15% Male Residents — State Benchmarked 15% of residents are male, compared to the Maryland average of 31%. This facility caters to a majority female resident pool (85% female), consistent with the broader assisted living trend where women significantly outnumber men. |
85% Female Residents — State Benchmarked 85% of residents are female, compared to the Maryland average of 69%. Women comprise the large majority, consistent with national assisted living demographics where women live longer and enter care facilities at higher rates. |
79% White Residents — State Benchmarked 79% of residents are reported as White, compared to the Maryland average of 81%. Close to the average for this category among assisted living facilities in Maryland with reported race/ethnicity data. |
21% African American Residents — State Benchmarked 21% of residents are reported as African American or Black, compared to the Maryland average of 13%. A higher African American share than the typical Maryland average — useful context when comparing cultural fit and community composition. |
0% Other Ethnicity Residents — State Benchmarked 0% of residents fall into categories other than White or African American (combined), compared to the Maryland average of 6%. This column aggregates Hispanic, Asian, multiracial, and any other labeled groups that are not classified as White or African American. |
9% Residents Age 65–74 — State Benchmarked 9% of residents are 65–74, compared to the Maryland average of 13%. Fewer younger seniors suggests the resident population skews older, likely requiring higher acuity care and more hands-on support. |
21% Residents Age 75–84 — State Benchmarked 21% of residents are 75–84, compared to the Maryland average of 31%. Below the state norm — the resident mix may skew either younger or older than this typical middle bracket. |
38% Residents Age 85–94 — State Benchmarked 38% of residents are 85–94, compared to the Maryland average of 44%. The population here skews younger than the statewide norm, which may indicate a more active, lower-acuity community. |
32% Residents Age 95+ — State Benchmarked 32% of residents are 95 or older, compared to the Maryland average of 16%. A high proportion of the oldest-old suggests strong end-of-life care experience and very-high-acuity capabilities. |
| Brightview Crofton Riverwalk | AL IL MC | Crofton | 92
Facility
92
MD AVG
42
Rank
#146 / 685 | Yes |
45
Facility
45
MD AVG
43
Rank
#475 / 985 | Studio / 1 Bed / 2 Bed | 6
Facility
6
MD AVG
21
Rank
#178 / 210 |
27% Male Residents — State Benchmarked 27% of residents are male, compared to the Maryland average of 31%. This facility caters to a majority female resident pool (73% female), consistent with the broader assisted living trend where women significantly outnumber men. |
73% Female Residents — State Benchmarked 73% of residents are female, compared to the Maryland average of 69%. Women comprise the large majority, consistent with national assisted living demographics where women live longer and enter care facilities at higher rates. |
0% White Residents — State Benchmarked 0% of residents are reported as White, compared to the Maryland average of 81%. A lower White share than the Maryland average — the community may draw a more diverse resident mix relative to other facilities in Maryland. |
0% African American Residents — State Benchmarked 0% of residents are reported as African American or Black, compared to the Maryland average of 13%. A lower African American share than is typical in Maryland; local markets still vary widely. |
100% Other Ethnicity Residents — State Benchmarked 100% of residents fall into categories other than White or African American (combined), compared to the Maryland average of 6%. This column aggregates Hispanic, Asian, multiracial, and any other labeled groups that are not classified as White or African American. Reported subgroups in this total: Other (100%). | - | - | - | - |
| Grace House | AL HOS PC | Silver Spring | 32
Facility
32
MD AVG
42
Rank
#236 / 685 | No |
25
Facility
25
MD AVG
43
Rank
#684 / 985 | Studio / 1 Bed | 19
Facility
19
MD AVG
21
Rank
#117 / 210 |
29% Male Residents — State Benchmarked 29% of residents are male, compared to the Maryland average of 31%. This facility caters to a majority female resident pool (71% female), consistent with the broader assisted living trend where women significantly outnumber men. |
71% Female Residents — State Benchmarked 71% of residents are female, compared to the Maryland average of 69%. Women comprise the large majority, consistent with national assisted living demographics where women live longer and enter care facilities at higher rates. |
74% White Residents — State Benchmarked 74% of residents are reported as White, compared to the Maryland average of 81%. Close to the average for this category among assisted living facilities in Maryland with reported race/ethnicity data. |
23% African American Residents — State Benchmarked 23% of residents are reported as African American or Black, compared to the Maryland average of 13%. A higher African American share than the typical Maryland average — useful context when comparing cultural fit and community composition. |
3% Other Ethnicity Residents — State Benchmarked 3% of residents fall into categories other than White or African American (combined), compared to the Maryland average of 6%. This column aggregates Hispanic, Asian, multiracial, and any other labeled groups that are not classified as White or African American. Reported subgroups in this total: Hispanic (3%). |
6% Residents Age 65–74 — State Benchmarked 6% of residents are 65–74, compared to the Maryland average of 13%. Fewer younger seniors suggests the resident population skews older, likely requiring higher acuity care and more hands-on support. |
26% Residents Age 75–84 — State Benchmarked 26% of residents are 75–84, compared to the Maryland average of 31%. Below the state norm — the resident mix may skew either younger or older than this typical middle bracket. |
32% Residents Age 85–94 — State Benchmarked 32% of residents are 85–94, compared to the Maryland average of 44%. The population here skews younger than the statewide norm, which may indicate a more active, lower-acuity community. |
35% Residents Age 95+ — State Benchmarked 35% of residents are 95 or older, compared to the Maryland average of 16%. A high proportion of the oldest-old suggests strong end-of-life care experience and very-high-acuity capabilities. |
| Kensington Park | AL IL MC | Kensington (Littledale Road) | - | Yes |
49
Facility
49
MD AVG
43
Rank
#431 / 985 | Private Rooms / Semi-Private Rooms | - | - | - | - | - | - | - | - | - | - |
| Royals Assisted Living, LLC | AL | Silver Spring | - | No |
50
Facility
50
MD AVG
43
Rank
#419 / 985 | Private / Shared Rooms | - | - | - | - | - | - | - | - | - | - |
| Nu-Life Assisted Living at 13201 Partridge Dr. | AL HOS RESC RC | Silver Spring | - | No |
47
Facility
47
MD AVG
43
Rank
#459 / 985 | Private Rooms | - | - | - | - | - | - | - | - | - | - |
| Good Samaritan Assisted Living | AL HC HOS MC RC | Silver Spring (Sligo Woods) | - | No |
41
Facility
41
MD AVG
43
Rank
#508 / 985 | Private Rooms / Semi-Private Rooms | - | - | - | - | - | - | - | - | - | - |
| J’Rose Assisted Living | AL | Silver Spring (Franklin Knolls) | 8
Facility
8
MD AVG
42
Rank
#301 / 685 | No |
23
Facility
23
MD AVG
43
Rank
#704 / 985 | - | - | - | - | - | - | - | - | - | - | - |
| Victory Forest | AL IL | Silver Spring (Forest Glen) | - | Yes |
33
Facility
33
MD AVG
43
Rank
#597 / 985 | 1 Bed | - | - | - | - | - | - | - | - | - | - |
Rows per page:

View all Nearby Homes
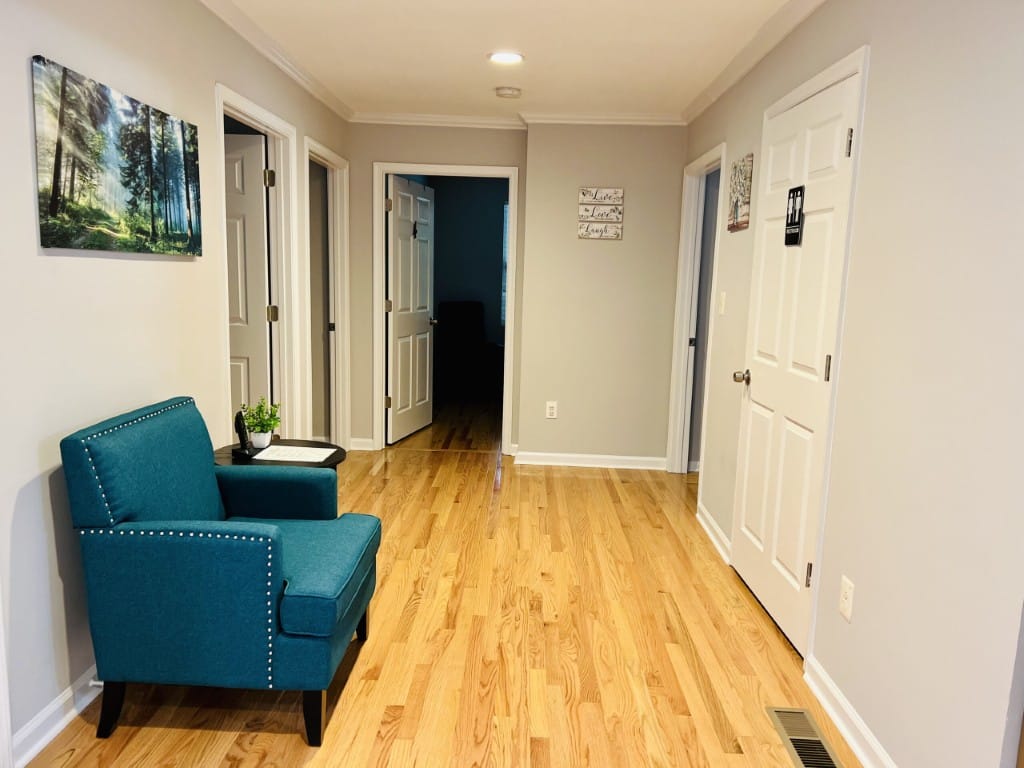
Peacefully nestled in the tree-lined neighborhood of Bregman Road, Silver Spring, MD, Colesville Eldercare is an idyllic retreat that offers assisted living. With a compassionate and highly skilled team available around the clock, residents receive top-notch care and assistance for their unique needs. The community also handles the housekeeping and laundry to provide residents with more time to do the things they truly enjoy.
A well-thought-out calendar of stimulating activities and engaging programs is also conducted for residents to interact with their surroundings and live actively. There’s no need to worry about meal preparation with healthy and delicious meals served to satisfy dietary needs and preferences. Respite care, long-term care, and medication technician are also provided to meet residents’ healthcare needs. Spend your golden years without worries with the community’s dedicated care and welcoming spaces.
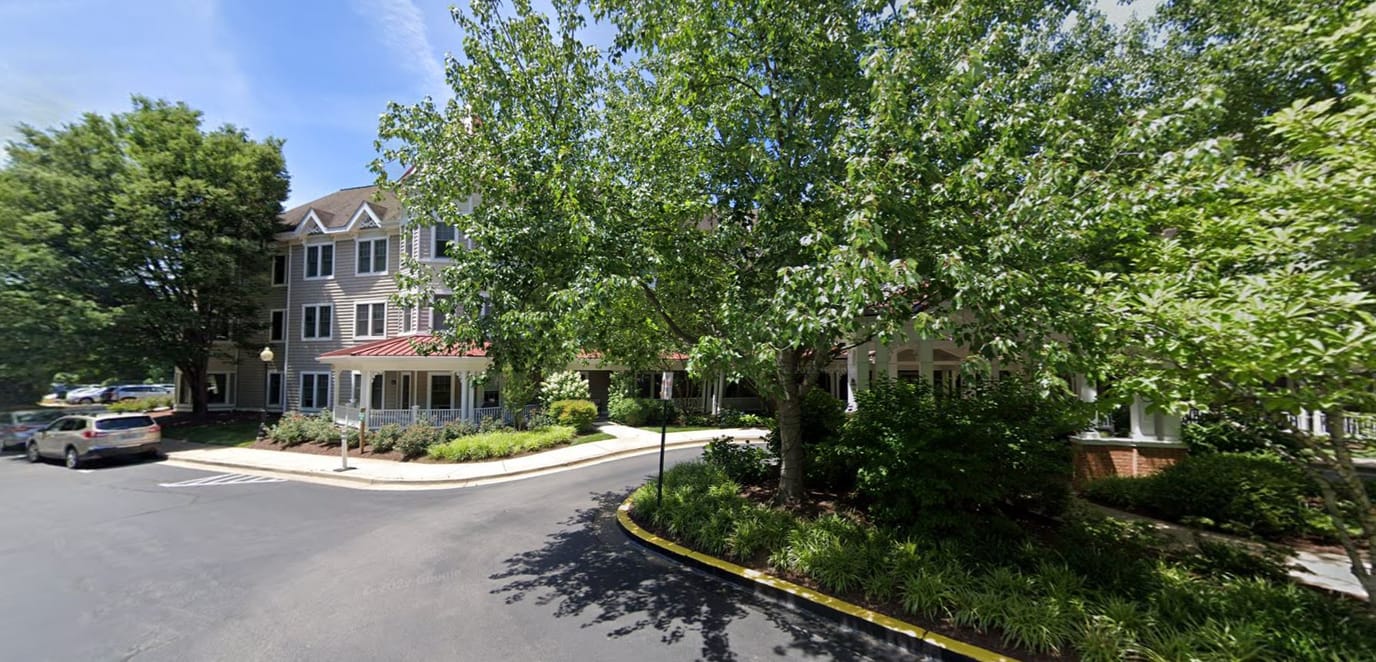
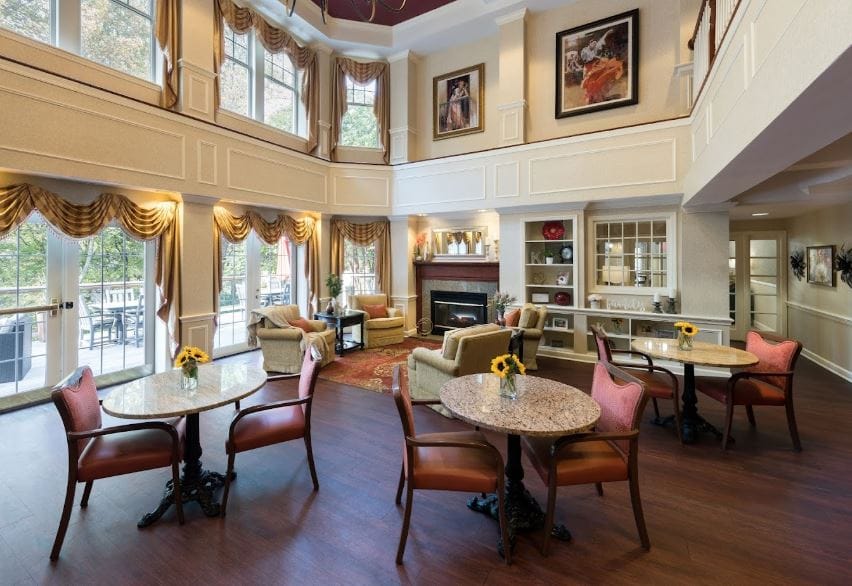
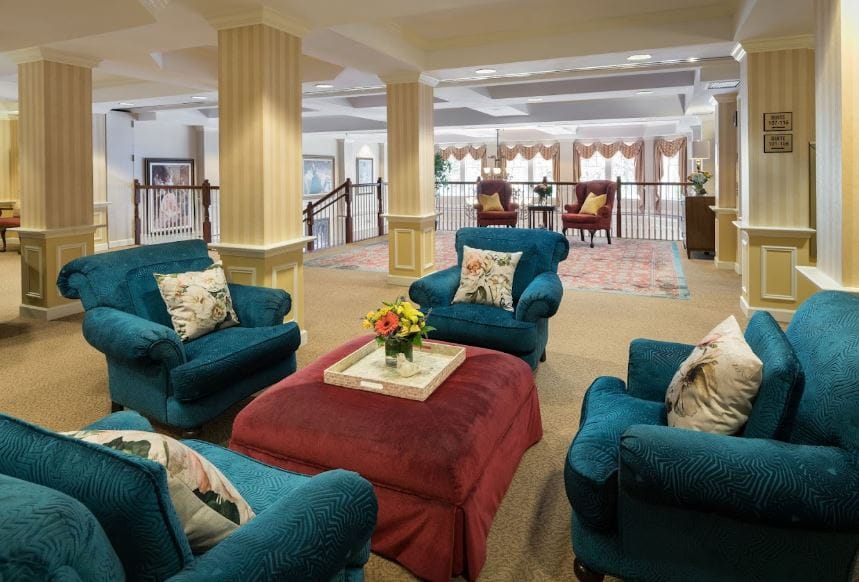
Overview of Kensington Park

Kensington Park is a senior living community in Kensington, Maryland, offering assisted living, independent living, and memory care in one campus. It sits on 8 acres in Montgomery County, giving residents a spread-out, campus-style setting instead of a building on a tight lot. The three-story building sits about half a mile from Kensington’s town center.
Housing options comprise private and semi-private rooms, along with private and companion floor plans, so occupants and families can pick an arrangement that fits their budget and comfort with company. The home welcomes pets, letting residents keep companion animals with them while settling in. Clinical support exists on-site across the assisted living, independent living, and memory care settings. Daily life includes a bistro café where occupants can gather outside of formal mealtimes, and a beauty salon for grooming and personal care. Wellness programming includes brain exercise programs, massage therapy, and fitness training, giving residents a blend of cognitive, physical, and relaxation-focused activities. Transportation services help residents get to appointments and outings without relying on family for every trip. The somewhat walkable surrounding neighborhood has a Walk Score of 49, so some nearby services are reachable on foot, while most trips demand a car.
Since needs can change over time, families touring Kensington Park may want to ask staff how clinical support is designed across assisted living, independent living, and memory care settings.
Beautifully situated in the quiet neighborhood of Silver Spring, MD, Royals Assisted Living LLC is an esteemed community that offers assisted living. Residents do not have to worry about their daily living activities, like bathing and dressing, with a compassionate and highly trained team helping them 24/7. Cleaning, laundry, and other chores are also taken care of, ensuring residents have more time to do the things they love.
To improve residents’ moods and well-being, a thoughtfully curated calendar of enriching activities and stimulating programs is conducted. Mealtimes also foster comfort and satisfy dietary needs with delicious and healthy dining options. The community’s nurturing and supportive environment creates the ideal setting for residents to make the most of their best years.
Overview of Nu-Life Assisted Living at 13201 Partridge Dr


Located on Partridge Drive in Silver Spring, MD, Nu-Life Assisted Living is a trustworthy senior living community, offering exceptional assisted living services in a nurturing environment for seniors. Here, residents enjoy utmost peace of mind and comfort knowing that a devoted care team is available 24 hours a day to offer round the clock supervision, assistance with daily living activities, personal care support, medication assistance, and more. The community ensures each resident is given a relaxing living space with housekeeping services for a low-maintenance lifestyle.
Participate in a broad array of fun and exciting activities held within and outside the community, giving plenty of opportunities for making new friends, staying active, and discovering new interests. Delicious and nutritious meals are also offered, with accommodations for special dietary needs and unique preferences, making mealtimes an enjoyable experience. Overall, Nu-Life Assisted Living in Partridge Drive is an ideal place for those seeking a well-maintained community with attentive team members who prioritize residents’ well-being.
Able Plus Assisted Living has been providing quality care since its inception in March 2016. With a prime location that’s just a stone’s throw away from the Westfield Wheaton Mall and within walking distance to a fire station, residents can have peace of mind knowing that they are well-cared for in case of emergencies. The home is staffed with highly trained and full-time caregivers dedicated to providing personalized care and attention to each resident.
From housekeeping and laundry to transportation and hygiene assistance, the team goes above and beyond to ensure the comfort and satisfaction of the residents. Their top-notch care extends to meal preparation, with a variety of home-cooked meals to choose from and special diet menus to accommodate residents’ specific dietary needs. The homey and intimate atmosphere is enhanced with Wi-Fi connectivity, ensuring that residents stay connected with their loved ones and the world outside.
Enjoy retirement life in an intimate and family-like environment with Good Samaritan Assisted Living, a welcoming senior living community that offers assisted living, memory care, personal care, and respite care. Residents are provided with round the clock care and attention in their well-designed accommodations by a dedicated team of caregivers. With convenient services like housekeeping, linen services, and scheduled transportation, residents are able to live a maintenance-free lifestyle.
Focused on elevating residents’ living experience, the community provides a broad range of exciting and enjoyable activities and fitness programs. Residents enjoy three daily, nutritious meals in the family style dining area that fosters the warmth of bonding over meals. The community also offers an array of amenities, including a library, salon, and well-maintained outdoor spaces.
Ideally situated in the harmonious neighborhood of Silver Spring, MD, Elder Companion Home of Md I is a blissful retreat that offers assisted living. A kind and well-trained team provides top-notch care tailored to residents’ unique needs around the clock to ensure their comfort and safety. Housekeeping, laundry, and linens are also taken care of, so residents can feel at ease during their stay.
A well-thought-out calendar of engaging activities and fun recreational programs is also conducted, encouraging residents to live actively and make new friends. Mealtimes promote social interactions and satisfy dietary needs with delicious and healthy dining options. The community is a good option for those needing assistance to live comfortably in their golden years with its dedicated services and top-notch amenities.
Parry Home Assisted Living is a place where family comes first. They believe in providing a warm and welcoming environment where every resident can find inner satisfaction for the soul. Round the clock care is offered by their dedicated staff, and the ranch-style life is also perfect for those looking for a lovely atmosphere and quaint interior.
In addition to the regular services provided, Parry Home also offers respite care and podiatrist services. They specialize in Parkinson’s, diabetes care, and memory care. An in-house lab and x-ray services are also available. Housekeeping, laundry, and transportation services are provided to make life easier for their residents as well. A piano, fire alarm system, large deck, and Wi-Fi are some of the other amenities offered. The facility is also wheelchair accessible.
Create unforgettable moments at Avonlea Ridge Assisted Living, an idyllic retreat in Silver Spring, MD, that offers assisted living and memory care. Featuring beautifully furnished and secure accommodations, the community ensures residents are comfortable and safe. Residents also receive high-quality care tailored to their unique needs from a kind and highly trained team available around the clock.
To enhance residents’ cognition and living experiences, a well-thought-out calendar of stimulating activities and enriching programs is conducted. With delicious and well-balanced dining options, residents enjoy a hassle-free dining experience that caters to their dietary needs and preferences. The community also ensures residents have a worry-free retirement in its nurturing and supportive environment.
Have a blissful retirement at J’Rose Assisted Living, an idyllic community in Silver Spring, MD, offering assisted living. A compassionate and highly trained team provides top-notch care tailored to residents’ unique needs around the clock, ensuring their comfort and safety. Housekeeping and laundry are also taken care of, so residents have a hassle-free living.
With a variety of fun activities and engaging programs, residents are encouraged to live actively and interact with their surroundings. Meals are also something to look forward to with delicious and healthy dining options served to satisfy residents’ dietary needs and preferences. The community’s comprehensive care and state-of-the-art amenities create the ideal setting for residents to make the most of their golden years.
Ranking Methodology
How we rank these communities
Every community above is evaluated across six weighted categories using public data including state inspection records, review platforms, BBB profiles, and operator-published materials.
Weighting overview
- 35%Resident Experience
- 25%Regulatory
- 15%Visual Media
- 10%Website
- 10%Stability
- 5%Environment
01
Resident & Family Experience 35%
The single largest share of every ranking. Aggregated review sentiment and volume from major platforms — the closest signal to real resident experience.
- Includes
- Review Sentiment
- Review Volume
02
Regulatory & Safety Record 25%
State inspection records, citations, and complaint visits. We weight per-inspection rates more heavily than raw counts.
- Includes
- State Inspections
- Citations/Inspection
- % Inspections w/ Citations
- Complaint Visits
- Accreditations
- BBB Rating
03
Visual Media & Transparency 15%
Communities that publish high-quality visuals give families a real preview. No photos or tours = a negative transparency signal.
- Includes
- Video Tours
- Virtual Walkthroughs
- Photo Quantity
- Photo Quality
04
Website & Operator Transparency 10%
Site quality and whether the operator publishes basic accountability information — staff names, contact details, ownership.
- Includes
- Website Content
- Mobile Usability
- Staff Info Available
- Owner Info Available
05
Community Stability 10%
Operational signals indicating whether a community is well-run and meeting demand.
- Includes
- Occupancy Rate
- Bed Options
06
Environment & Pricing 5%
Walkability and pricing transparency. Walk Score is weighted higher for Independent Living than for Memory Care, where most residents do not leave unaccompanied.
- Includes
- Walk Score
- Pricing Transparency
Who we are
Your Senior Care Partner, Every Step of the Way
We help families find affordable senior communities and unlock same day discounts, Medicaid, and Medicare options tailored to your needs.
Contact us Today
Frequently Asked Questions about Assisted Living in Silver Spring, MD
What is the average cost of assisted living in Silver Spring, MD?
The average monthly cost of assisted living in Silver Spring, MD is approximately $6,000. Actual rates vary by community, level of care, and floorplan.
What is the price range for assisted living in Silver Spring, MD?
Assisted living in Silver Spring, MD typically ranges from $5,500–$8,100 per month, depending on the community, room type, and care needs.
What is the typical staff-to-resident ratio at assisted living facilities in Silver Spring, MD?
Assisted living facilities in Silver Spring, MD typically operate with a staff-to-resident ratio in the range of 1:6 to 1:12.
What's the difference between assisted living and memory care in Maryland?
Assisted living in Maryland supports residents with daily activities (bathing, dressing, medication management) while preserving independence. Memory care is a specialized form of assisted living for residents living with Alzheimer's or dementia, and adds 24/7 secured environments, dementia-trained staff, and structured routines designed to reduce confusion and wandering.
What's the difference between assisted living and a nursing home in Maryland?
Assisted living in Maryland is a residential model focused on housing, hospitality, and help with daily activities. Nursing homes (skilled nursing facilities) provide 24/7 medical care from licensed nurses for residents with significant health needs, and are regulated more strictly under both state and federal CMS rules.
Does Maryland Medicaid cover assisted living?
Maryland Medicaid does not directly pay room-and-board for assisted living, but most states (including Maryland) offer Home and Community-Based Services (HCBS) waivers that can offset the cost of care services delivered inside a licensed community. Eligibility, waitlists, and covered services vary — check directly with the state Medicaid agency.
What is assisted living?
Assisted living combines private or semi-private apartments with help on activities of daily living (meals, bathing, dressing, medication management) and a social calendar — for residents who need some support but do not need 24/7 medical care.
Updated on
