Annandale Care Center
Nursing Home, Assisted Living, Independent Living & Memory Care · Annandale, MN
CMS overall rating Info CMS (the Centers for Medicare & Medicaid Services) is the federal agency that rates nursing home quality. Its Overall Rating runs from 1 to 5 stars, combining health inspections, staffing, and quality measures, with inspections weighted most heavily.

Annandale Care Center

Nursing Home, Assisted Living, Independent Living & Memory Care · Annandale, MN
CMS overall rating Info CMS (the Centers for Medicare & Medicaid Services) is the federal agency that rates nursing home quality. Its Overall Rating runs from 1 to 5 stars, combining health inspections, staffing, and quality measures, with inspections weighted most heavily.
Calculator: See prices in your area
Annandale Care Center accepts Medicare, Medicaid, and private pay.

Overview of Annandale Care Center

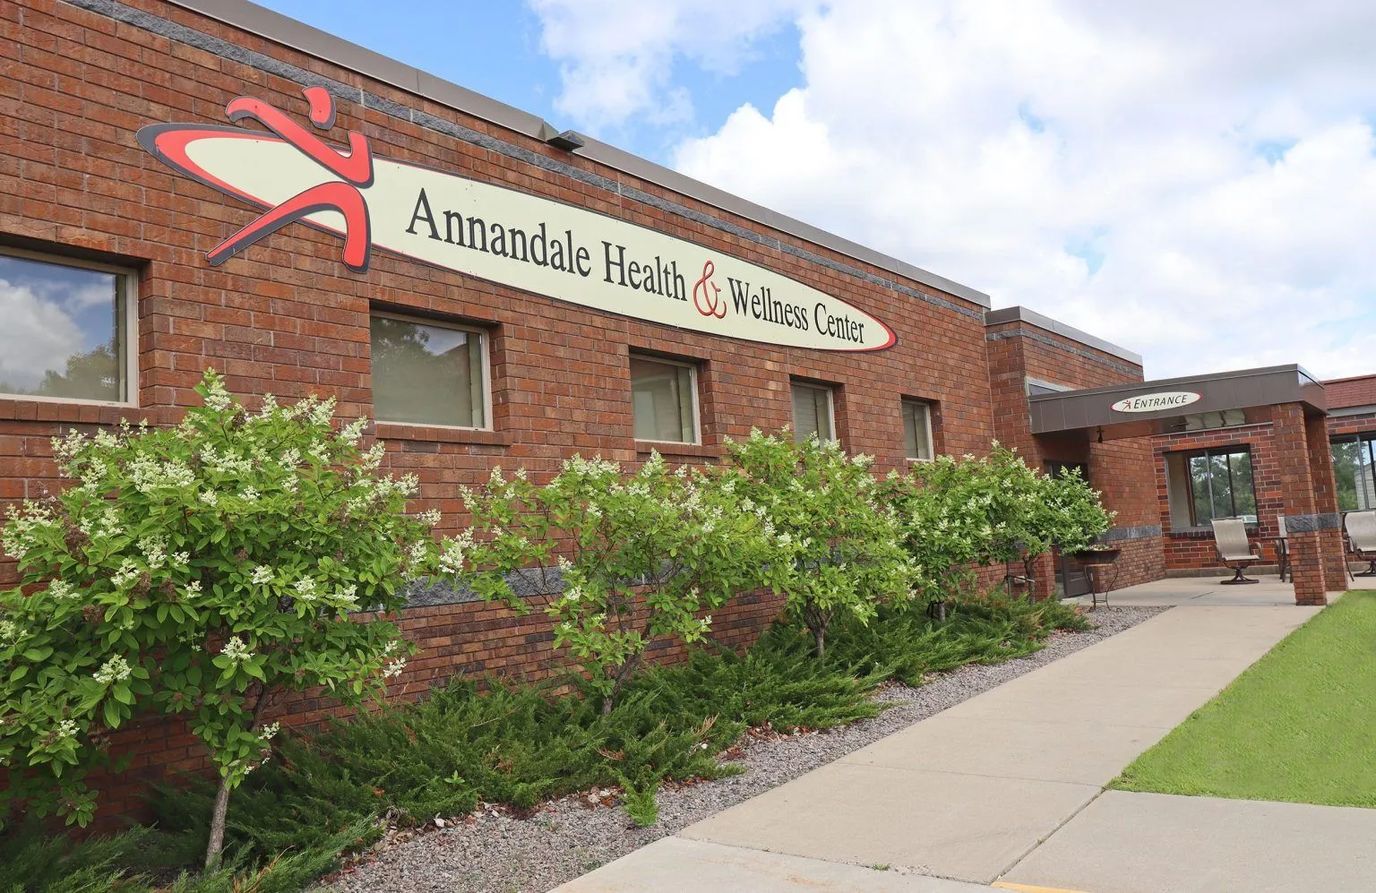
You can find Annandale Care Center over at 500 Park Street East in Annandale, Minnesota, where owner Richard Feeney manages the daily operations. Sorting out the billing is relatively simple since the front office takes Medicare, Medicaid, and private payments. If you’re planning a visit, the neighborhood has a walkability score of 62 out of 100, so while you can walk to a few spots nearby, you’ll still want a car for most errands.

The 120-bed facility runs at a steady 91 percent occupancy, with residents staying an average of 249 days. This timeline shows that the daily routine balances temporary post-hospital rehab tracks with extended residential care. To manage daily medical needs and treatments, the around-the-clock schedule averages 4 hours and 50 minutes of direct nursing care per resident each day, split among a rotation of registered nurses, practical nurses, and nurse aides.

State regulatory safety platforms preserve regular oversight logs that track property compliance during standard public health evaluations. Routine survey cycles document day-to-day employee routines, nursing documentation, and medical protocols to keep consumer informational files updated on public databases.

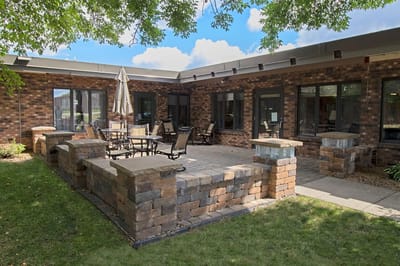
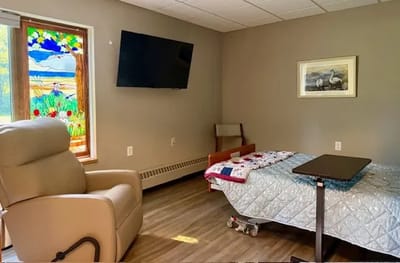
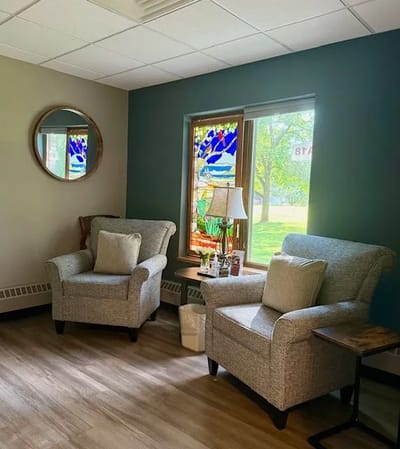
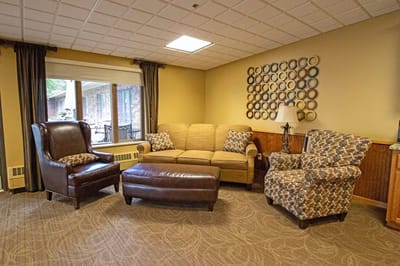
Families can check out the built-in wellness center, physical therapy tracks, and dedicated chapel space. The everyday calendar coordinates these therapeutic recovery goals with fitness classes, community social gatherings, and fresh dining options prepared on-site by Pleasant Vista Bistro.

Quality ratings

Measured by Centers for Medicare & Medicaid Services (CMS)

Overall rating Info The Overall CMS Rating combines results from health inspections, staffing levels and quality measures. Health inspections carry the most weight. Staffing and quality scores can increase or decrease the final rating based on performance compared to state and national standards.
Health Inspection Info Based on the results of the facility's three most recent standard inspections and any complaint investigations. CMS reviews the number, scope, and severity of deficiencies, with more recent findings weighted more heavily.
Staffing Info Measures average nursing staff hours per resident per day, including Registered Nurses (RNs) and total nursing staff. Ratings are adjusted based on the level of care residents require and are compared to state and national benchmarks.
Quality Measures Info Based on clinical and physical health indicators reported to CMS, such as hospital readmissions, falls, pressure ulcers, and improvements in mobility. These measures reflect how well residents' health needs are being managed.

Staffing hours breakdown

Info Daily nursing hours per resident by staff type, reported to CMS. Higher is generally better — compare this facility to state and national averages to see where staffing stands.

Hours per resident per day — compared to state averages

Total nursing care / resident Info Total adjusted nursing hours per resident per day, combining RN, LPN, and aide time. CMS adjusts this for case-mix so facilities can be fairly compared.
4h 50m per day
Rank #36 / 89Nurse hours — State benchmarkedThis home is ranked 36th out of 89 homes in Minnesota. Shows adjusted nurse hours per resident per day benchmarked to the Minnesota average, with a ranking across 89 Minnesota facilities. More hours mean more direct care. The national average is about 3.5 hrs; below 3.0 is a red flag.Rankings are based only on facilities in Minnesota that report data for that category. Facilities without available data are excluded from the ranking.Click the rank badge to see the full State ranking.Click here to see the full State ranking.
vs avg

2 of 6 metrics below state avg

Standout metric LPN / LVN is +42% above state avg
Staff typeHours / Day / Residentvs state avg
Registered Nurse (RN) Info RNs hold the highest nursing license and can assess residents, interpret test results, and direct care plans. More RN hours per day often signals stronger clinical oversight and faster response to health changes. 53m per day ▼ 18% State avg: 1h 4m per day · National avg: 41m per day
LPN / LVN Info Licensed Practical Nurses (LPNs) or Licensed Vocational Nurses (LVNs) deliver routine hands-on care — medication administration, wound dressing, and monitoring vital signs. They work under RN supervision and make up a large share of daily bedside care. 53m per day ▲ 42% State avg: 37m per day · National avg: 52m per day
Nurse Aide Info Certified Nurse Aides (CNAs) provide the most direct day-to-day assistance: bathing, dressing, feeding, and mobility. Nurse aide hours are typically the largest staffing category and directly affect residents' quality of life. 2h 39m per day ▲ 4% State avg: 2h 33m per day · National avg: 2h 20m per day
Weekend Total Nursing Info Combined nursing hours (RN + LPN + Nurse Aide) per resident per day on weekends. Staffing often drops on weekends — this figure reveals whether the facility maintains adequate coverage outside of weekday hours. 3h 44m per day ■ Avg State avg: 3h 41m per day · National avg: 3h 26m per day
Physical Therapist Info Hours per resident per day provided by licensed Physical Therapists (PTs) or PT Assistants. PT services help residents recover mobility after injury or illness and are especially important for post-acute (short-stay) rehabilitation. 5m per day ▲ 34% State avg: 4m per day · National avg: 4m per day
Weekend RN Info Registered nurse hours specifically on weekends. Facilities sometimes reduce RN presence on Saturdays and Sundays — a low weekend RN figure compared to weekday hours can indicate reduced clinical oversight when most administrative staff are absent. 18m per day ▼ 56% State avg: 41m per day · National avg: 28m per day

Capacity and availability

Avg. Length of Stay
249 days
Bed community size
120-bed community Rank #72 / 532Bed count — State benchmarkedThis home is ranked 72nd out of 532 homes in Minnesota. Shows this facility's certified or reported bed count compared to other Minnesota facilities. Larger communities may offer more amenities, programs, and on-site services for residents and families.Rankings are based only on facilities in Minnesota that report data for that category. Facilities without available data are excluded from the ranking.Click the rank badge to see the full State ranking.Click here to see the full State ranking.
A larger shared setting that may offer more common spaces and organized community services.
Walk Score
Walk Score: 62 / 100 Rank #153 / 632Walk Score — State benchmarkedThis home is ranked 153rd out of 632 homes in Minnesota. Shows how walkable this facility's neighborhood is compared to the average Walk Score across Minnesota facilities. Higher scores benefit residents, families, and staff.Rankings are based only on facilities in Minnesota that report data for that category. Facilities without available data are excluded from the ranking.Click the rank badge to see the full State ranking.Click here to see the full State ranking.
Moderately walkable. Some errands can be accomplished on foot, with a mix of nearby amenities.

About this community

Occupancy

Occupancy rate
91%
Rank #67 / 331Occupancy rate — State benchmarkedThis home is ranked 67th out of 331 homes in Minnesota. Shows this facility's occupancy rate versus the Minnesota average, with its Statewide rank out of 331. Higher occupancy signals strong local demand and financial stability.Rankings are based only on facilities in Minnesota that report data for that category. Facilities without available data are excluded from the ranking.Click the rank badge to see the full State ranking.Click here to see the full State ranking.
Higher than the Minnesota average: 79.7%
Occupied beds
109 / 120
Average occupied beds in Minnesota homes 59 beds

License Details

Facility TypeAssisted Living
StatusApproved
CountyWright
CMS Certification Number245364
Accreditations5 Star rating with CMS

Therapy & Rehabilitation

1 service
Rehabilitation Services

Staffing & Medical

1 service
24-Hour Staffing

Amenities & Lifestyle

Beauty Shop
Chapel
Wellness Center
Fitness Programs
Social Events
On-Site Physical Therapy
ActivitiesFull calendar of daily activities, fitness classes, and wellness programs
Specific ProgramsNursing Home, Secured Memory Care, Wellness Center & Therapy, Activities & Programs, Dining Options

Contact Annandale Care Center

Inspection History

In Minnesota, the Department of Health, Health Regulation Division is the primary authority for conducting onsite inspections and reporting on the quality of care in residential facilities.

Since 2023 · 3 years of data 6 deficiencies 6 inspections

Inspection Scorecard Info This scorecard compares key inspection, deficiency, and complaint metrics at this facility against the Minnesota state average. Metrics rated ≥15% worse than average are highlighted in red; those ≥15% better are highlighted in green.

Since 2023 vs. Minnesota state average
Overall vs. MN average 1 Worse Metrics worse than Minnesota average:
• Total inspections (500% above)
3 Better Metrics better than Minnesota average:
• Total deficiencies (40% below)
• Deficiencies per year (39% below)
• Deficiencies per inspection (90% below)
Latest Inspection October 17, 2025

Deficiencies Info Deficiencies are formal regulatory issues recorded during state inspections.

This FacilityMN Averagevs. MN Avg
Total deficiencies Info Formal regulatory issues recorded by inspectors across all inspection types. 610 This facility has 40% fewer total deficiencies than a typical Minnesota assisted living residence (6 vs. MN avg 10).↓ 40% better
Deficiencies per year Info Average deficiencies per year since 2023. 23.3 This facility has 39% fewer deficiencies per year than a typical Minnesota assisted living residence (2 vs. MN avg 3.3).↓ 39% better
Deficiencies per inspection Info Average deficiencies per inspection. 110 This facility has 90% fewer deficiencies per inspection than a typical Minnesota assisted living residence (1 vs. MN avg 10).↓ 90% better

Inspections Info State inspections evaluate whether the facility meets health and safety standards.

This FacilityMN Averagevs. MN Avg
Total inspections Info Combined count of all routine and focused inspections. Excludes complaint investigations. 61 This facility has 500% more total inspections than a typical Minnesota assisted living residence (6 vs. MN avg 1).↑ 500% worse

Health Inspection History

Inspections since 2023
Total health inspections 5

State average N/A


Last Health inspection on Aug 2025

Total health citations
8 Rank #12 / 90Health citations — State benchmarkedThis home is ranked 12th out of 90 homes in Minnesota. Shows this facility's total health deficiency citations benchmarked to the Minnesota State average, with a ranking across all 90 MN facilities. Lower citation counts earn a better rank.Rankings are based only on facilities in Minnesota that report data for that category. Facilities without available data are excluded from the ranking.Click the rank badge to see the full State ranking.Click here to see the full State ranking.

State average N/A

Citations per inspection
1.6 Rank #5 / 90Citations per inspection — State benchmarkedThis home is ranked 5th out of 90 homes in Minnesota. Shows average deficiency citations per CMS inspection for this facility versus the Minnesota mean across 90 facilities with citation data. Lower is better.Rankings are based only on facilities in Minnesota that report data for that category. Facilities without available data are excluded from the ranking.Click the rank badge to see the full State ranking.Click here to see the full State ranking.

State average N/A


Health citations are formal notices following inspections when they fail to comply with safety and care standards.

2 of 8 citations resulted from standard inspections; 5 of 8 resulted from complaint investigations; and 1 of 8 came from combined inspections (standard and complaint).

Breakdown of citation severity (last 3 years)
Critical health citations
0
In line with State average

State average: N/A


Serious health citations
2
In line with State average

State average: N/A

0 critical citations State average: N/A

2 serious citations State average: N/A

6 moderate citations State average: N/A

0 minor citations State average: N/A
Citations history (last 3 years)
Pharmacy moderate citation Aug 13, 2025
Corrected

Quality of Care serious citation Jun 17, 2025
Corrected

Quality of Care moderate citation Oct 23, 2024
Corrected

Infection Control moderate citation Jul 26, 2023
Corrected

Staffing Data

Reporting period: October 1 – December 31, 2025 (Q4 2025). Source: CMS Payroll-Based Journal report.

Total staff 107
Employees 87
Contractors 20
Staff to resident ratio 3.15 : 1
0% compared with State average

State average ratio: 0 : 0

Avg staff/day 29
Average shift 7.3 hours
0% compared with State average

State average: 0 hours

Total staff hours (quarter) 19,449

Nursing staff breakdown

Q4 2025 · Oct 1 – Dec 31 More info This data comes from the CMS Payroll-Based Journal report covering October 1 – December 31, 2025.
Registered Nurse

Manages medical care and health needs.

RN Staff Info 9 total: 6 full-time employees and 3 contractors. 9
Average shift length Info Average shift length. Calculated as total hours divided by days worked and average staff per day. 8.9 hours
Licensed Practical Nurse

Assists with medical care and medications.

LPN Staff Info All 11 LPN Staff are full-time employees. No contractors work on this role. 11
Average shift length Info Average shift length. Calculated as total hours divided by days worked and average staff per day. 8.9 hours
Certified Nursing Assistant

Helps with daily care and mobility.

CNA Staff Info 55 total: 53 full-time employees and 2 contractors. 55
Average shift length Info Average shift length. Calculated as total hours divided by days worked and average staff per day. 7.4 hours

Contractor staffing

Q4 2025 · Oct 1 – Dec 31 More info This data comes from the CMS Payroll-Based Journal report covering October 1 – December 31, 2025.

Total hours from contractors

4.5%

876 contractor hours this quarter

Respiratory Therapy Technician: 4 Registered Nurse: 3 Certified Nursing Assistant: 2 Speech Language Pathologist: 2 Physical Therapy Aide: 2 Qualified Social Worker: 2 Physical Therapy Assistant: 2 Diagnostic X-ray Services Staff: 1 Medical Director: 1 Occupational Therapy Assistant: 1

Staff by category

Q4 2025 · Oct 1 – Dec 31 More info This data comes from the CMS Payroll-Based Journal report covering October 1 – December 31, 2025.
Certified Nursing Assistant532559,01592100%7.4
Licensed Practical Nurse110113,09192100%8.9
Clinical Nurse Specialist5051,8296874%7.6
Other Dietary Services Staff3031,1737784%6.7
Registered Nurse6398947076%8.9
Dietitian1014886166%8
Occupational Therapy Aide1014806065%8
Administrator1014725964%8
Mental Health Service Worker1014645863%8
Nurse Practitioner1013684650%8
Medication Aide/Technician4043385661%4.7
Respiratory Therapy Technician0443145257%5.9
Physical Therapy Aide0222635560%3.7
Qualified Social Worker022932527%3.7
Speech Language Pathologist022793538%2.2
Physical Therapy Assistant022311415%2.2
Occupational Therapy Assistant0112433%8
Diagnostic X-ray Services Staff0112155%4.2
Medical Director0111233%4
55 Certified Nursing Assistant
% of Days 100%
11 Licensed Practical Nurse
% of Days 100%
5 Clinical Nurse Specialist
% of Days 74%
3 Other Dietary Services Staff
% of Days 84%
9 Registered Nurse
% of Days 76%
1 Dietitian
% of Days 66%
1 Occupational Therapy Aide
% of Days 65%
1 Administrator
% of Days 64%
1 Mental Health Service Worker
% of Days 63%
1 Nurse Practitioner
% of Days 50%
4 Medication Aide/Technician
% of Days 61%
4 Respiratory Therapy Technician
% of Days 57%
2 Physical Therapy Aide
% of Days 60%
2 Qualified Social Worker
% of Days 27%
2 Speech Language Pathologist
% of Days 38%
2 Physical Therapy Assistant
% of Days 15%
1 Occupational Therapy Assistant
% of Days 3%
1 Diagnostic X-ray Services Staff
% of Days 5%
1 Medical Director
% of Days 3%

Penalties and fines

Includes penalties issued in 2025

Federal penalties imposed by CMS for regulatory violations, including civil money penalties (fines) and denials of payment for new Medicare/Medicaid admissions.

Source: CMS Penalties Database (Data as of Jan 2026)

Total fines amount $8K Rank #1 / 90Federal fines — State benchmarkedThis home is ranked 1st out of 90 homes in Minnesota. Shows this facility's cumulative CMS federal fine dollars versus the Minnesota average among facilities with fines, and where it ranks among 90 facilities in the pool. Lower total dollars mean a better rank.Rankings are based only on facilities in Minnesota that report data for that category. Facilities without available data are excluded from the ranking.Click the rank badge to see the full State ranking.Click here to see the full State ranking.
82% lower than State average

State average: $44K

Number of fines 1
50% fewer fines than State average

State average: 2.0

Payment Denials Info Serious action where Medicare and/or Medicaid temporarily stops payments for new residents until issues are fixed. 1
130% more payment denials than State average

State average: 0.4

Fines amount comparison
This facility $8K
State average $44K
Penalty History

Penalties are imposed by CMS for violations of federal nursing home regulations.

1 penalty in the past 3 years

Jun 17, 2025 · 6 days

Payment Denial Info Serious action where Medicare and/or Medicaid temporarily stops payments for new residents until issues are fixed. Jun 17, 2025
6 days

Last updated: Jan 2026

Quality of care over time

These measures show how residents usually do over time at this home, based on health outcomes and preventive care.

High-risk clinical events score Info A composite score based on pressure ulcers, falls with injury, weight loss, walking ability decline, and activities of daily living decline. 12.7
14% worse than State average

State average: 11.1

Functional decline score Info A composite score based on activities of daily living decline, walking ability decline, and incontinence. 28.9
28% worse than State average

State average: 22.6

Long-stay resident measures
Significantly above average State avg: 2.6 Info CMS star rating based on long-stay quality measure performance. 5 stars = significantly above average, 1 star = significantly below average.
Need for Help with Daily Activities Increased Info Percent of long-stay residents whose need for help with daily activities has increased 16.7%
12% better than State average

State average: 18.9%

Walking Ability Worsened Info Percent of long-stay residents whose ability to move independently worsened 38.7%
63% worse than State average

State average: 23.8%

Low Risk Residents with Bowel/Bladder Incontinence Info Percent of low risk long-stay residents who lose control of their bowels or bladder 31.3%
25% worse than State average

State average: 25.0%

Falls with Major Injury Info Percent of long-stay residents experiencing one or more falls with major injury 4.9%
32% worse than State average

State average: 3.7%

High Risk Residents with Pressure Ulcers Info Percent of long-stay high risk residents with pressure ulcers 1.9%
65% better than State average

State average: 5.4%

Urinary Tract Infection Info Percent of long-stay residents with a urinary tract infection 1.7%
39% better than State average

State average: 2.7%

Lost Too Much Weight Info Percent of long-stay residents who lose too much weight 1.2%
70% better than State average

State average: 4.1%

Depressive Symptoms Info Percent of long-stay residents who have depressive symptoms 0.9%
78% better than State average

State average: 4.4%

Antipsychotic Use Info Percent of long-stay residents who received an antipsychotic medication 7.3%
58% better than State average

State average: 17.2%

Pneumococcal Vaccine Info Percent of long-stay residents assessed and appropriately given the pneumococcal vaccine 100.0%
In line with State average

State average: 97.3%

Influenza Vaccine Info Percent of long-stay residents assessed and appropriately given the seasonal influenza vaccine 97.1%
In line with State average

State average: 96.0%

Short-stay resident measures
Significantly above average State avg: 3.1 Info CMS star rating based on short-stay quality measure performance. 5 stars = much above average, 1 star = much below average.
Pneumococcal Vaccine Info Percent of short-stay residents assessed and appropriately given the pneumococcal vaccine 95.6%
7% better than State average

State average: 88.9%

Antipsychotic medication increase Info Percent of short-stay residents who newly received an antipsychotic medication 0.0%
100% better than State average

State average: 1.9%

Influenza Vaccine Info Percent of short-stay residents assessed and appropriately given the seasonal influenza vaccine 100.0%
21% better than State average

State average: 82.6%

Re-hospitalized after SNF stay Info Percentage of short-stay residents who were re-hospitalized after their nursing home admission. 36.3%
57% worse than State average

State average: 23.1%

Emergency department visits Info Percentage of short-stay residents who had an outpatient emergency department visit. 6.3%
55% better than State average

State average: 14.0%

Falls with major injury Info Percentage of SNF residents who experience falls with major injury during their stay. 0.0%
100% better than State average

State average: 0.8%

Ability to care for self at discharge Info Percentage of residents at or above expected ability to care for themselves at discharge. 40.0%
25% worse than State average

State average: 53.7%

Successful return to home or community Info Rate of successful return to home or community from a skilled nursing facility. 63.0%
25% better than State average

State average: 50.6%

Breakdown by payment type

Medicare

35% of new residents, usually for short-term rehab.

Typical stay 1 - 2 months

Private pay

63% of new residents, often for short stays.

Typical stay 4 - 5 months

Medicaid

2% of new residents, often for long-term daily care.

Typical stay 18 - 19 years

Facility Characteristics

Source: CMS Long-Term Care Facility Characteristics (Data as of Jan 2026)

Total residents 34
Medicare
3
8.8% of residents
Medicaid
17
50% of residents
Private pay or other
14
41.2% of residents
Programs & Services
Residents Group

Residents meet regularly to discuss policies, care quality, and activities

Family Member Group

Family members meet regularly to discuss policies, care quality, and activities

Active Family Council

Organized group of family members that meets regularly to discuss facility policies, resident care, and activities.

Active Resident Council

Organized group of residents that meets regularly to discuss facility policies, quality of life, and activities.

Finances and operations

Based on CMS SNF Cost Report for fiscal year ending in 09/2023.

Nonprofit
Nonprofit Corporation
Net patient revenue Info Net patient revenue — what the home actually collects for resident care, after contractual allowances, bad debt and discounts are subtracted from its gross charges (CMS cost report, Worksheet G-3). It covers resident care only; money the home earns from other sources is shown separately as "Other income."
$5.8M
Net patient income Info Net patient income: net patient revenue minus the home's total operating expenses. A positive figure means it earns more from resident care than it spends to deliver it; a negative figure means the opposite. It excludes non-operating "other income."
-$6.3M
Nonprofit Nonprofit Corporation
Net patient revenue Info Net patient revenue — what the home actually collects for resident care, after contractual allowances, bad debt and discounts are subtracted from its gross charges (CMS cost report, Worksheet G-3). It covers resident care only; money the home earns from other sources is shown separately as "Other income."
$5.8M Rank #47 / 89Revenue — State benchmarkedThis home is ranked 47th out of 89 homes in Minnesota. Shows this facility's annual revenue compared to the Minnesota average. Higher revenue generally means more resources for staffing and capital — read alongside Payroll %.Rankings are based only on facilities in Minnesota that report data for that category. Facilities without available data are excluded from the ranking.Click the rank badge to see the full State ranking.Click here to see the full State ranking.
Net patient income Info Net patient income: net patient revenue minus the home's total operating expenses. A positive figure means it earns more from resident care than it spends to deliver it; a negative figure means the opposite. It excludes non-operating "other income."
-$6.3M
Other income Info Money the home earns outside of resident care — such as investments, grants, rentals and other non-operating sources (CMS cost report, Worksheet G-3). It is tracked separately from net patient revenue: it is not part of that figure, and it is not included in net patient income.
$5.2M
Payroll costs Info Staff salaries plus wage-related costs — benefits such as payroll taxes, health insurance and retirement — from the home's own accounting records (CMS cost report, Worksheet A). Contract or agency labor is counted separately, under other operating costs. Rank #38 / 89Payroll — State benchmarkedThis home is ranked 38th out of 89 homes in Minnesota. Shows total annual staff payroll benchmarked to the Minnesota average. Higher payroll investment relative to peers often signals better staffing and less reliance on cheaper contract labor.Rankings are based only on facilities in Minnesota that report data for that category. Facilities without available data are excluded from the ranking.Click the rank badge to see the full State ranking.Click here to see the full State ranking.
$7.0M 120.4% of net patient revenue Info Payroll as a share of revenue: staff salaries and wage-related benefits divided by net patient revenue. A higher figure means more of each revenue dollar goes to staff pay. Rank #18 / 89Payroll % — State benchmarkedThis home is ranked 18th out of 89 homes in Minnesota. Shows payroll as a percentage of revenue versus the Minnesota average. Well-run Minnesota facilities typically land around 61–68% — the top third Statewide. Below 25% may signal understaffing or heavy agency use — read with Staffing ratings.Rankings are based only on facilities in Minnesota that report data for that category. Facilities without available data are excluded from the ranking.Click the rank badge to see the full State ranking.Click here to see the full State ranking.
Other operating costs Info Everything it costs to run the home apart from payroll — food, utilities, supplies, maintenance, contract labor and administration. Calculated as total operating expense minus payroll (staff salaries and wage-related benefits).
$5.1M
Total costs Info The home's total operating expense for the year — all the costs of running it, salaries included (CMS cost report, Worksheet G-3).
$12.1M

Who this home usually serves

TYPE OF STAY

Primarily short stays

Residents typically stay for brief periods, with frequent admissions and discharges throughout the year.

Most new residents arrive under private pay (63% of admissions), and a typical private pay stay runs around 4 - 5 months.

Admissions
63 total

Coverage residents most often arrive under.

Medicare 35%
Private pay 63%
Medicaid 2%
Discharges
60 total

Coverage residents most often leave under.

Medicare 25%
Private pay 65%
Medicaid 10%

Places of interest near Annandale Care Center

Address 0.0 miles from city center Info Estimated distance in miles from Annandale's city center to Annandale Care Center's address, calculated via Google Maps.

Calculate Travel Distance to Annandale Care Center

Add your location

Address

Compare Nursing Homes around the area

The information below is reported by the Minnesota Department of Health, Health Regulation Division.

Annandale Care Center
NH
AL
IL
MC
Annandale -120 - 62 -
Meadowood Shores Senior Apartments
NH
IL
New Brighton (Rice Creek) -49 - 66 1 Bed / 2 Bed
Mankato Lodge Senior Living
NH
AL
IL
RC
Mankato -70 - 56 Studio / 1 Bed / 2 Bed
Woodbury Senior Living
NH
AL
IL
MC
Woodbury -155 - 22 -
Pelican Valley Senior Living
NH
AL
HC
MC
RC
Pelican Rapids (East Mill Avenue) -28 - 58 Private Rooms

Frequently Asked Questions about Annandale Care Center

Is Annandale Care Center in a walkable area?

Annandale Care Center has a walk score of 62. Moderately walkable. Some errands can be accomplished on foot, with a mix of nearby amenities.

What is the occupancy rate at Annandale Care Center?

Annandale Care Center's occupancy is 91%.

Does Annandale Care Center operate as a for-profit or non-profit?

Annandale Care Center is registered as a non-profit in MN.

How many beds does Annandale Care Center have?

Annandale Care Center has 120 beds.

Are there photos of Annandale Care Center?

Yes — there are 7 photos of Annandale Care Center in the photo gallery on this page.

What is the address of Annandale Care Center?

Annandale Care Center is located at 600 Park Street East, Annandale, MN 55302.

What is the phone number of Annandale Care Center?

(320) 274-3737 will put you in contact with the team at Annandale Care Center.

Guides for Better Senior Living

Care Cost Calculator: See Prices in Your Area

Nursing Home Data Explorer

Don’t Wait Too Long: 7 Red Flag Signs Your Parent Needs Assisted Living Now

The True Cost of Assisted Living in 2025 – And How Families Are Paying For It

Understanding Senior Living Costs: Pricing Models, Discounts & Financial Assistance