Boundary Waters Care Center
Nursing Home, Hospice Care & Respite Care · Ely, MN
CMS overall rating Info CMS (the Centers for Medicare & Medicaid Services) is the federal agency that rates nursing home quality. Its Overall Rating runs from 1 to 5 stars, combining health inspections, staffing, and quality measures, with inspections weighted most heavily.

Boundary Waters Care Center

Nursing Home, Hospice Care & Respite Care · Ely, MN
CMS overall rating Info CMS (the Centers for Medicare & Medicaid Services) is the federal agency that rates nursing home quality. Its Overall Rating runs from 1 to 5 stars, combining health inspections, staffing, and quality measures, with inspections weighted most heavily.
Calculator: See prices in your area
Boundary Waters Care Center accepts Medicaid, Medicare, and private pay.

Overview of Boundary Waters Care Center

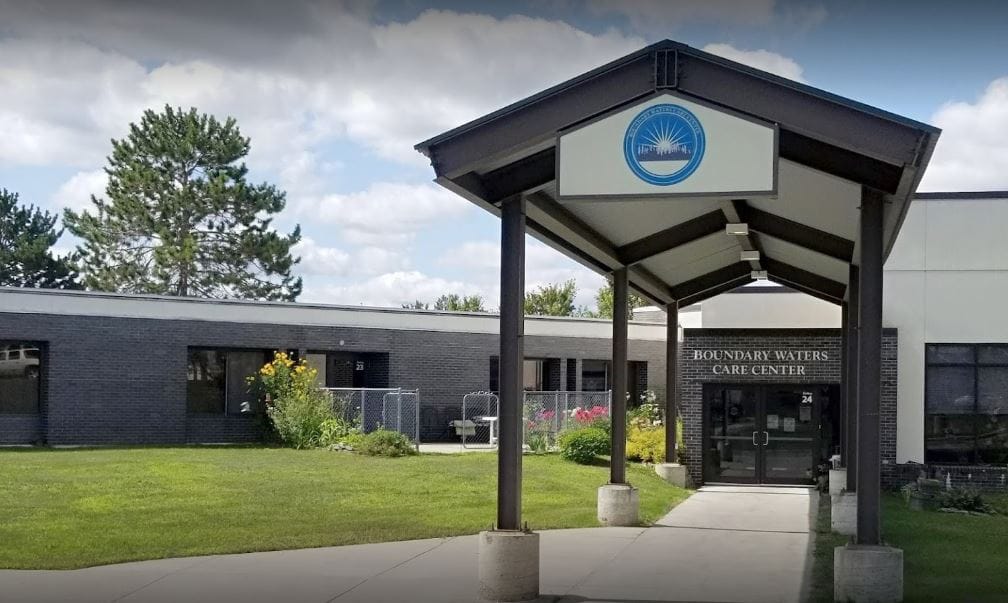
Boundary Waters Care Center (BWCC) is a vibrant nonprofit, 503(c)(3), skilled care and rehabilitative community in Ely, Minnesota where values-driven team members are focused on upholding the well-being, dignity, and individual capabilities of each resident. The community serves older adults and their families with short-term rehabilitation services and long-term care designed to ensure residents may safely lead a lifestyle with as much independence as
possible.

Quality ratings

Measured by Centers for Medicare & Medicaid Services (CMS)

Overall rating Info The Overall CMS Rating combines results from health inspections, staffing levels and quality measures. Health inspections carry the most weight. Staffing and quality scores can increase or decrease the final rating based on performance compared to state and national standards.
Health Inspection Info Based on the results of the facility's three most recent standard inspections and any complaint investigations. CMS reviews the number, scope, and severity of deficiencies, with more recent findings weighted more heavily.
Staffing Info Measures average nursing staff hours per resident per day, including Registered Nurses (RNs) and total nursing staff. Ratings are adjusted based on the level of care residents require and are compared to state and national benchmarks.
Quality Measures Info Based on clinical and physical health indicators reported to CMS, such as hospital readmissions, falls, pressure ulcers, and improvements in mobility. These measures reflect how well residents' health needs are being managed.

Staffing hours breakdown

Info Daily nursing hours per resident by staff type, reported to CMS. Higher is generally better — compare this facility to state and national averages to see where staffing stands.

Hours per resident per day — compared to state averages

Total nursing care / resident Info Total adjusted nursing hours per resident per day, combining RN, LPN, and aide time. CMS adjusts this for case-mix so facilities can be fairly compared.
4h 30m per day
Rank #54 / 89Nurse hours — State benchmarkedThis home is ranked 54th out of 89 homes in Minnesota. Shows adjusted nurse hours per resident per day benchmarked to the Minnesota average, with a ranking across 89 Minnesota facilities. More hours mean more direct care. The national average is about 3.5 hrs; below 3.0 is a red flag.Rankings are based only on facilities in Minnesota that report data for that category. Facilities without available data are excluded from the ranking.Click the rank badge to see the full State ranking.Click here to see the full State ranking.
vs avg

2 of 6 metrics below state avg

Standout metric Registered Nurse (RN) is +18% above state avg
Staff type Hours / Day / Resident vs state avg
Registered Nurse (RN) Info RNs hold the highest nursing license and can assess residents, interpret test results, and direct care plans. More RN hours per day often signals stronger clinical oversight and faster response to health changes. 1h 16m per day ▲ 18% State avg: 1h 4m per day · National avg: 41m per day
LPN / LVN Info Licensed Practical Nurses (LPNs) or Licensed Vocational Nurses (LVNs) deliver routine hands-on care — medication administration, wound dressing, and monitoring vital signs. They work under RN supervision and make up a large share of daily bedside care. 24m per day ▼ 35% State avg: 37m per day · National avg: 52m per day
Nurse Aide Info Certified Nurse Aides (CNAs) provide the most direct day-to-day assistance: bathing, dressing, feeding, and mobility. Nurse aide hours are typically the largest staffing category and directly affect residents' quality of life. 2h 41m per day ▲ 5% State avg: 2h 33m per day · National avg: 2h 21m per day
Weekend Total Nursing Info Combined nursing hours (RN + LPN + Nurse Aide) per resident per day on weekends. Staffing often drops on weekends — this figure reveals whether the facility maintains adequate coverage outside of weekday hours. 3h 47m per day ▲ 3% State avg: 3h 41m per day · National avg: 3h 26m per day
Physical Therapist Info Hours per resident per day provided by licensed Physical Therapists (PTs) or PT Assistants. PT services help residents recover mobility after injury or illness and are especially important for post-acute (short-stay) rehabilitation. 3m per day ▼ 27% State avg: 4m per day · National avg: 4m per day
Weekend RN Info Registered nurse hours specifically on weekends. Facilities sometimes reduce RN presence on Saturdays and Sundays — a low weekend RN figure compared to weekday hours can indicate reduced clinical oversight when most administrative staff are absent. 44m per day ▲ 7% State avg: 41m per day · National avg: 29m per day

Capacity and availability

This home usually has availability

Lower occupancy than the state average
Occupancy rate
77% Rank #179 / 331Occupancy rate — State benchmarkedThis home is ranked 179th out of 331 homes in Minnesota. Shows this facility's occupancy rate versus the Minnesota average, with its Statewide rank out of 331. Higher occupancy signals strong local demand and financial stability.Rankings are based only on facilities in Minnesota that report data for that category. Facilities without available data are excluded from the ranking.Click the rank badge to see the full State ranking.Click here to see the full State ranking.
Avg. Length of Stay
262 days
Bed community size
42-bed community Rank #283 / 532Bed count — State benchmarkedThis home is ranked 283rd out of 532 homes in Minnesota. Shows this facility's certified or reported bed count compared to other Minnesota facilities. Larger communities may offer more amenities, programs, and on-site services for residents and families.Rankings are based only on facilities in Minnesota that report data for that category. Facilities without available data are excluded from the ranking.Click the rank badge to see the full State ranking.Click here to see the full State ranking.
A moderately sized community that may balance personal attention with shared amenities and social activities.
Walk Score
Walk Score: 61 / 100 Rank #159 / 632Walk Score — State benchmarkedThis home is ranked 159th out of 632 homes in Minnesota. Shows how walkable this facility's neighborhood is compared to the average Walk Score across Minnesota facilities. Higher scores benefit residents, families, and staff.Rankings are based only on facilities in Minnesota that report data for that category. Facilities without available data are excluded from the ranking.Click the rank badge to see the full State ranking.Click here to see the full State ranking.
Moderately walkable. Some errands can be accomplished on foot, with a mix of nearby amenities.

About this community

License Details

CMS Certification Number245138
AccreditationsBronze – Commitment to Quality Award

Safety & Compliance

Emergency SystemsYes

Staffing

Key information about the people who lead and staff this community.

Leadership

ContactAdam Masloski, Admissions Director

Payment & Insurance

2 services
Accept Medicaid
Accept Medicare

Therapy & Rehabilitation

2 services
Rehabilitation Services
Respite Care

Staffing & Medical

2 services
Doctor on Staff
24-Hour Staffing

Amenities & Lifestyle

Onsite Barber And Beauty Salon
Scheduled Transportation
Daily Activities
Specific ProgramsHousekeeping, Laundry Service, Barber/Beauty Salon, Short-term Respite Stays, Compassionate Hospice Care

Contact Boundary Waters Care Center

Inspection History

In Minnesota, the Department of Health, Health Regulation Division is the primary authority for conducting onsite inspections and reporting on the quality of care in residential facilities.

Since 2024 · 2 years of data 11 deficiencies

Inspection Scorecard Info This scorecard compares key inspection, deficiency, and complaint metrics at this facility against the Minnesota state average. Metrics rated ≥15% worse than average are highlighted in red; those ≥15% better are highlighted in green.

Since 2024 vs. Minnesota state average
Overall vs. MN average 2 Worse Metrics worse than Minnesota average:
• Total deficiencies (10% above)
• Deficiencies per year (10% above)
0 Better No metrics in this bucket.
Latest Inspection December 11, 2025 Plan Of Correction

Deficiencies Info Deficiencies are formal regulatory issues recorded during state inspections.

This Facility MN Average vs. MN Avg
Total deficiencies Info Formal regulatory issues recorded by inspectors across all inspection types. 11 10 This facility has 10% more total deficiencies than a typical Minnesota assisted living residence (11 vs. MN avg 10).↑ 10% worse
Deficiencies per year Info Average deficiencies per year since 2024. 5.5 5 This facility has 10% more deficiencies per year than a typical Minnesota assisted living residence (5.5 vs. MN avg 5).↑ 10% worse

Inspection Reports Summary Info An editor-reviewed summary of the themes and findings across this facility's recent inspection reports.

  • October 16, 2024 inspection found 5 deficiencies including failure to notify provider of resident condition changes, unsafe respiratory care, missed therapy services, poor nutrition, and lack of range of motion interventions.
  • January 25, 2024 inspection cited 6 deficiencies including unsecured electronic medical records, failure to provide Medicare notices, improper wound care, unsafe mechanical lift use, and no hand sanitization before meals.
  • December 11, 2025 follow-up survey found no health deficiencies and no complaints were reported.

Health Inspection History

Inspections since 2023
Total health inspections 3

State average N/A


Last Health inspection on Oct 2024

Total health citations
21 Rank #36 / 90Health citations — State benchmarkedThis home is ranked 36th out of 90 homes in Minnesota. Shows this facility's total health deficiency citations benchmarked to the Minnesota State average, with a ranking across all 90 MN facilities. Lower citation counts earn a better rank.Rankings are based only on facilities in Minnesota that report data for that category. Facilities without available data are excluded from the ranking.Click the rank badge to see the full State ranking.Click here to see the full State ranking.

State average N/A

Citations per inspection
7 Rank #86 / 90Citations per inspection — State benchmarkedThis home is ranked 86th out of 90 homes in Minnesota. Shows average deficiency citations per CMS inspection for this facility versus the Minnesota mean across 90 facilities with citation data. Lower is better.Rankings are based only on facilities in Minnesota that report data for that category. Facilities without available data are excluded from the ranking.Click the rank badge to see the full State ranking.Click here to see the full State ranking.

State average N/A


Health citations are formal notices following inspections when they fail to comply with safety and care standards.

All 21 citations resulted from standard inspections.

Breakdown of citation severity (last 3 years)
Critical health citations
0
In line with State average

State average: N/A


Serious health citations
1
In line with State average

State average: N/A

0 critical citations State average: N/A

1 serious citation State average: N/A

19 moderate citations State average: N/A

1 minor citation State average: N/A
Citations history (last 3 years)
Nutrition moderate citation Oct 16, 2024
Corrected

Quality of Care moderate citation Oct 16, 2024
Corrected

Quality of Care moderate citation Oct 16, 2024
Corrected

Quality of Care moderate citation Oct 16, 2024
Corrected

Staffing Data

Reporting period: October 1 – December 31, 2025 (Q4 2025). Source: CMS Payroll-Based Journal report.

Total staff 54
Employees 43
Contractors 11
Staff to resident ratio 1.69 : 1
0% compared with State average

State average ratio: 0 : 0

Avg staff/day 19
Average shift 8.4 hours
0% compared with State average

State average: 0 hours

Total staff hours (quarter) 14,651

Nursing staff breakdown

Q4 2025 · Oct 1 – Dec 31 More info This data comes from the CMS Payroll-Based Journal report covering October 1 – December 31, 2025.
Registered Nurse

Manages medical care and health needs.

RN Staff Info 8 total: 7 full-time employees and 1 contractor. 8
Average shift length Info Average shift length. Calculated as total hours divided by days worked and average staff per day. 10.2 hours
Licensed Practical Nurse

Assists with medical care and medications.

LPN Staff Info All 2 LPN Staff are full-time employees. No contractors work on this role. 2
Average shift length Info Average shift length. Calculated as total hours divided by days worked and average staff per day. 11.6 hours
Certified Nursing Assistant

Helps with daily care and mobility.

CNA Staff Info 19 total: 17 full-time employees and 2 contractors. 19
Average shift length Info Average shift length. Calculated as total hours divided by days worked and average staff per day. 8.8 hours

Contractor staffing

Q4 2025 · Oct 1 – Dec 31 More info This data comes from the CMS Payroll-Based Journal report covering October 1 – December 31, 2025.

Total hours from contractors

11.5%

1,679 contractor hours this quarter

Respiratory Therapy Technician: 3 Certified Nursing Assistant: 2 Physical Therapy Assistant: 2 Registered Nurse: 1 Occupational Therapy Assistant: 1 Occupational Therapy Aide: 1 Medical Director: 1

Staff by category

Q4 2025 · Oct 1 – Dec 31 More info This data comes from the CMS Payroll-Based Journal report covering October 1 – December 31, 2025.
Certified Nursing Assistant 17 2 19 6,113 92 100% 8.8
Registered Nurse 7 1 8 2,025 90 98% 10.2
Other Dietary Services Staff 4 0 4 1,423 92 100% 8.1
Licensed Practical Nurse 2 0 2 1,074 76 83% 11.6
Medication Aide/Technician 2 0 2 963 75 82% 9.9
Clinical Nurse Specialist 4 0 4 846 61 66% 7.2
Nurse Practitioner 1 0 1 519 64 70% 8.1
Physical Therapy Aide 1 0 1 474 61 66% 7.8
Dental Services Staff 1 0 1 421 52 57% 8.1
Administrator 1 0 1 392 49 53% 8
Respiratory Therapy Technician 0 3 3 132 38 41% 2.9
Nurse Aide in Training 2 0 2 111 15 16% 7.4
Speech Language Pathologist 1 0 1 87 15 16% 5.8
Physical Therapy Assistant 0 2 2 35 10 11% 3.5
Occupational Therapy Assistant 0 1 1 20 14 15% 1.5
Occupational Therapy Aide 0 1 1 17 4 4% 4.1
Medical Director 0 1 1 2 1 1% 1.5
19 Certified Nursing Assistant
% of Days 100%
8 Registered Nurse
% of Days 98%
4 Other Dietary Services Staff
% of Days 100%
2 Licensed Practical Nurse
% of Days 83%
2 Medication Aide/Technician
% of Days 82%
4 Clinical Nurse Specialist
% of Days 66%
1 Nurse Practitioner
% of Days 70%
1 Physical Therapy Aide
% of Days 66%
1 Dental Services Staff
% of Days 57%
1 Administrator
% of Days 53%
3 Respiratory Therapy Technician
% of Days 41%
2 Nurse Aide in Training
% of Days 16%
1 Speech Language Pathologist
% of Days 16%
2 Physical Therapy Assistant
% of Days 11%
1 Occupational Therapy Assistant
% of Days 15%
1 Occupational Therapy Aide
% of Days 4%
1 Medical Director
% of Days 1%

Penalties and fines

Federal penalties imposed by CMS for regulatory violations, including civil money penalties (fines) and denials of payment for new Medicare/Medicaid admissions.

Source: CMS Penalties Database (Data as of Jan 2026)

Total fines amount $10K Rank #1 / 90Federal fines — State benchmarkedThis home is ranked 1st out of 90 homes in Minnesota. Shows this facility's cumulative CMS federal fine dollars versus the Minnesota average among facilities with fines, and where it ranks among 90 facilities in the pool. Lower total dollars mean a better rank.Rankings are based only on facilities in Minnesota that report data for that category. Facilities without available data are excluded from the ranking.Click the rank badge to see the full State ranking.Click here to see the full State ranking.
77% lower than State average

State average: $44K

Number of fines 1
50% fewer fines than State average

State average: 2.0

Payment Denials Info Serious action where Medicare and/or Medicaid temporarily stops payments for new residents until issues are fixed. 0
100% fewer payment denials than State average

State average: 0.4

Fines amount comparison
This facility $10K
State average $44K

No penalties in the past 3 years

No civil money penalties or payment denials were reported in the last 3 years.

Quality of care over time

These measures show how residents usually do over time at this home, based on health outcomes and preventive care.

High-risk clinical events score Info A composite score based on pressure ulcers, falls with injury, weight loss, walking ability decline, and activities of daily living decline. 6.9
38% better than State average

State average: 11.1

Functional decline score Info A composite score based on activities of daily living decline, walking ability decline, and incontinence. 16.7
26% better than State average

State average: 22.6

Long-stay resident measures
Significantly above average State avg: 2.6 Info CMS star rating based on long-stay quality measure performance. 5 stars = significantly above average, 1 star = significantly below average.
Need for Help with Daily Activities Increased Info Percent of long-stay residents whose need for help with daily activities has increased 8.5%
55% better than State average

State average: 18.9%

Walking Ability Worsened Info Percent of long-stay residents whose ability to move independently worsened 13.1%
45% better than State average

State average: 23.8%

Low Risk Residents with Bowel/Bladder Incontinence Info Percent of low risk long-stay residents who lose control of their bowels or bladder 28.4%
14% worse than State average

State average: 25.0%

Falls with Major Injury Info Percent of long-stay residents experiencing one or more falls with major injury 2.6%
31% better than State average

State average: 3.7%

High Risk Residents with Pressure Ulcers Info Percent of long-stay high risk residents with pressure ulcers 2.3%
59% better than State average

State average: 5.4%

Urinary Tract Infection Info Percent of long-stay residents with a urinary tract infection 0.9%
68% better than State average

State average: 2.7%

Lost Too Much Weight Info Percent of long-stay residents who lose too much weight 8.1%
95% worse than State average

State average: 4.1%

Depressive Symptoms Info Percent of long-stay residents who have depressive symptoms 0.9%
79% better than State average

State average: 4.4%

Antipsychotic Use Info Percent of long-stay residents who received an antipsychotic medication 14.3%
17% better than State average

State average: 17.2%

Pneumococcal Vaccine Info Percent of long-stay residents assessed and appropriately given the pneumococcal vaccine 100.0%
In line with State average

State average: 97.3%

Influenza Vaccine Info Percent of long-stay residents assessed and appropriately given the seasonal influenza vaccine 100.0%
In line with State average

State average: 96.0%

Short-stay resident measures
Pneumococcal Vaccine Info Percent of short-stay residents assessed and appropriately given the pneumococcal vaccine 100.0%
12% better than State average

State average: 88.9%

Antipsychotic medication increase Info Percent of short-stay residents who newly received an antipsychotic medication 5.0%
161% worse than State average

State average: 1.9%

Influenza Vaccine Info Percent of short-stay residents assessed and appropriately given the seasonal influenza vaccine 95.7%
16% better than State average

State average: 82.6%

Breakdown by payment type

Medicare

31% of new residents, usually for short-term rehab.

Typical stay 1 - 2 months

Private pay

61% of new residents, often for short stays.

Typical stay 6 - 7 months

Medicaid

8% of new residents, often for long-term daily care.

Typical stay 4 years

Facility Characteristics

Source: CMS Long-Term Care Facility Characteristics (Data as of Jan 2026)

Total residents 32
Medicare
2
6.3% of residents
Medicaid
22
68.8% of residents
Private pay or other
8
25% of residents
Programs & Services
Residents Group

Residents meet regularly to discuss policies, care quality, and activities

Nurse Aide Training

State-approved Nurse Aide Training and Competency Evaluation Program on-site

Active Resident Council

Organized group of residents that meets regularly to discuss facility policies, quality of life, and activities.

Finances and operations

Based on CMS SNF Cost Report for fiscal year ending in 12/2023.

Nonprofit
Nonprofit Corporation
Net patient revenue Info Net patient revenue — what the home actually collects for resident care, after contractual allowances, bad debt and discounts are subtracted from its gross charges (CMS cost report, Worksheet G-3). It covers resident care only; money the home earns from other sources is shown separately as "Other income."
$4.2M
Net patient income Info Net patient income: net patient revenue minus the home's total operating expenses. A positive figure means it earns more from resident care than it spends to deliver it; a negative figure means the opposite. It excludes non-operating "other income."
-$857.9K
Nonprofit Nonprofit Corporation
Net patient revenue Info Net patient revenue — what the home actually collects for resident care, after contractual allowances, bad debt and discounts are subtracted from its gross charges (CMS cost report, Worksheet G-3). It covers resident care only; money the home earns from other sources is shown separately as "Other income."
$4.2M Rank #78 / 89Revenue — State benchmarkedThis home is ranked 78th out of 89 homes in Minnesota. Shows this facility's annual revenue compared to the Minnesota average. Higher revenue generally means more resources for staffing and capital — read alongside Payroll %.Rankings are based only on facilities in Minnesota that report data for that category. Facilities without available data are excluded from the ranking.Click the rank badge to see the full State ranking.Click here to see the full State ranking.
Net patient income Info Net patient income: net patient revenue minus the home's total operating expenses. A positive figure means it earns more from resident care than it spends to deliver it; a negative figure means the opposite. It excludes non-operating "other income."
-$857.9K
Other income Info Money the home earns outside of resident care — such as investments, grants, rentals and other non-operating sources (CMS cost report, Worksheet G-3). It is tracked separately from net patient revenue: it is not part of that figure, and it is not included in net patient income.
$634.1K
Payroll costs Info Staff salaries plus wage-related costs — benefits such as payroll taxes, health insurance and retirement — from the home's own accounting records (CMS cost report, Worksheet A). Contract or agency labor is counted separately, under other operating costs. Rank #76 / 89Payroll — State benchmarkedThis home is ranked 76th out of 89 homes in Minnesota. Shows total annual staff payroll benchmarked to the Minnesota average. Higher payroll investment relative to peers often signals better staffing and less reliance on cheaper contract labor.Rankings are based only on facilities in Minnesota that report data for that category. Facilities without available data are excluded from the ranking.Click the rank badge to see the full State ranking.Click here to see the full State ranking.
$3.1M 74.6% of net patient revenue Info Payroll as a share of revenue: staff salaries and wage-related benefits divided by net patient revenue. A higher figure means more of each revenue dollar goes to staff pay. Rank #7 / 89Payroll % — State benchmarkedThis home is ranked 7th out of 89 homes in Minnesota. Shows payroll as a percentage of revenue versus the Minnesota average. Well-run Minnesota facilities typically land around 61–68% — the top third Statewide. Below 25% may signal understaffing or heavy agency use — read with Staffing ratings.Rankings are based only on facilities in Minnesota that report data for that category. Facilities without available data are excluded from the ranking.Click the rank badge to see the full State ranking.Click here to see the full State ranking.
Other operating costs Info Everything it costs to run the home apart from payroll — food, utilities, supplies, maintenance, contract labor and administration. Calculated as total operating expense minus payroll (staff salaries and wage-related benefits).
$1.9M
Total costs Info The home's total operating expense for the year — all the costs of running it, salaries included (CMS cost report, Worksheet G-3).
$5.1M

Who this home usually serves

TYPE OF STAY

Primarily short stays

Residents typically stay for brief periods, with frequent admissions and discharges throughout the year.

Most new residents arrive under private pay (61% of admissions), and a typical private pay stay runs around 6 - 7 months.

Admissions
49 total

Coverage residents most often arrive under.

Medicare 31%
Private pay 61%
Medicaid 8%
Discharges
45 total

Coverage residents most often leave under.

Medicare 40%
Private pay 40%
Medicaid 20%

Places of interest near Boundary Waters Care Center

Address 0.3 miles from city center Info Estimated distance in miles from Ely's city center to Boundary Waters Care Center's address, calculated via Google Maps. — 0.05 miles to nearest hospital (Ely-Bloomenson Community Hospital)

Calculate Travel Distance to Boundary Waters Care Center

Add your location

Address

Compare Nursing Homes around the area

The information below is reported by the Minnesota Department of Health, Health Regulation Division.

Boundary Waters Care Center
NH
HC
RC
Ely - 42 - 61 -
Friendship Village of Bloomington
NH
AL
IL
MC
Bloomington (West Bloomington) - 85 - 16 1 Bed / 2 Bed
Walker Methodist – Westwood Ridge
NH
AL
IL
MC
RC
West St Paul (West Saint Paul) - 140 - 63 1 Bed / 2 Bed
Jones-Harrison Senior Living
NH
AL
MC
NC
Minneapolis (Calhoun Isles) - 53 - 56 Studio / 1 Bed / 2 Bed
Trillium Woods
NH
AL
IL
MC
Plymouth (Glacier Vista) - 44 A+ 4 -

Frequently Asked Questions about Boundary Waters Care Center

Is Boundary Waters Care Center in a walkable area?

Boundary Waters Care Center has a walk score of 61. Moderately walkable. Some errands can be accomplished on foot, with a mix of nearby amenities.

What is the occupancy rate at Boundary Waters Care Center?

Boundary Waters Care Center's occupancy is 77.0%.

Does Boundary Waters Care Center operate as a for-profit or non-profit?

Boundary Waters Care Center is registered as a non-profit in MN.

Are there photos of Boundary Waters Care Center?

Yes — there are 2 photos of Boundary Waters Care Center in the photo gallery on this page.

What is the address of Boundary Waters Care Center?

Boundary Waters Care Center is located at 200 W Conan St, Ely, MN 55731.

What is the phone number of Boundary Waters Care Center?

(218) 365-8705 will put you in contact with the team at Boundary Waters Care Center.

Is Boundary Waters Care Center Medicare or Medicaid certified?

Yes — Boundary Waters Care Center is a CMS-certified provider of Medicare and Medicaid.

Guides for Better Senior Living

Care Cost Calculator: See Prices in Your Area

Nursing Home Data Explorer

Don’t Wait Too Long: 7 Red Flag Signs Your Parent Needs Assisted Living Now

The True Cost of Assisted Living in 2025 – And How Families Are Paying For It

Understanding Senior Living Costs: Pricing Models, Discounts & Financial Assistance