Atria Park of Tucker
Nursing Home, Assisted Living, Independent Living & Memory Care · Tucker, GA
CMS overall rating Info CMS (the Centers for Medicare & Medicaid Services) is the federal agency that rates nursing home quality. Its Overall Rating runs from 1 to 5 stars, combining health inspections, staffing, and quality measures, with inspections weighted most heavily.

Atria Park of Tucker

Nursing Home, Assisted Living, Independent Living & Memory Care · Tucker, GA
CMS overall rating Info CMS (the Centers for Medicare & Medicaid Services) is the federal agency that rates nursing home quality. Its Overall Rating runs from 1 to 5 stars, combining health inspections, staffing, and quality measures, with inspections weighted most heavily.
Calculator: See prices in your area
Atria Park of Tucker accepts Medicare, Medicaid, and private pay.

Overview of Atria Park of Tucker

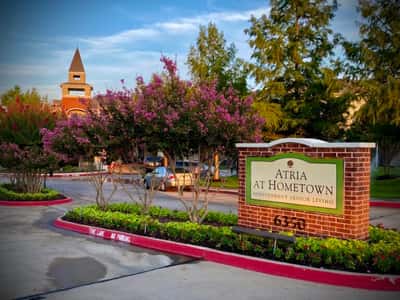
Nestled in the serene Lawrenceville Highway, Tucker, GA, Atria Park of Tucker is a wondrous senior living community that offers independent living, supportive living, and memory care. The community features a wide array of well-designed floor plans including studio, one-bedroom, and two-bedroom apartments. Alongside round-the-clock personalized care and assistance, the community provides in-campus physical therapy and occupational therapy to ensure residents experience a better quality of life.

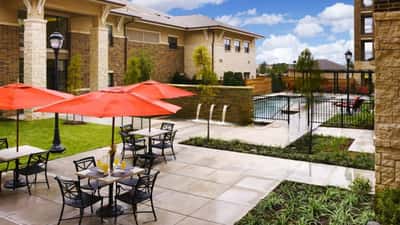
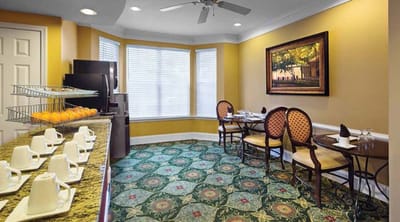
Atria Park of Tucker forges meaningful relations with trusted partners to deliver top-tier care for its residents. With cher-prepared meals served three times a day, residents enjoy dining at multiple dining venues either privately or with wonderful company from other residents. The community fosters a pet-friendly environment and is well-equipped with fabulous amenities including a sports lounge, a game room, a library, a physical therapy center, a salon and spa, a courtyard, a sunlit patio, and walking paths.

Quality ratings

Measured by Centers for Medicare & Medicaid Services (CMS)

Overall rating Info The Overall CMS Rating combines results from health inspections, staffing levels and quality measures. Health inspections carry the most weight. Staffing and quality scores can increase or decrease the final rating based on performance compared to state and national standards.
Health Inspection Info Based on the results of the facility's three most recent standard inspections and any complaint investigations. CMS reviews the number, scope, and severity of deficiencies, with more recent findings weighted more heavily.
Staffing Info Measures average nursing staff hours per resident per day, including Registered Nurses (RNs) and total nursing staff. Ratings are adjusted based on the level of care residents require and are compared to state and national benchmarks.
Quality Measures Info Based on clinical and physical health indicators reported to CMS, such as hospital readmissions, falls, pressure ulcers, and improvements in mobility. These measures reflect how well residents' health needs are being managed.

Staffing hours breakdown

Info Daily nursing hours per resident by staff type, reported to CMS. Higher is generally better — compare this facility to state and national averages to see where staffing stands.

Hours per resident per day — compared to state averages

Total nursing care / resident Info Total adjusted nursing hours per resident per day, combining RN, LPN, and aide time. CMS adjusts this for case-mix so facilities can be fairly compared.
3h 14m per day
Rank #119 / 202Nurse hours — State benchmarkedThis home is ranked 119th out of 202 homes in Georgia. Shows adjusted nurse hours per resident per day benchmarked to the Georgia average, with a ranking across 202 Georgia facilities. More hours mean more direct care. The national average is about 3.5 hrs; below 3.0 is a red flag.Rankings are based only on facilities in Georgia that report data for that category. Facilities without available data are excluded from the ranking.Click the rank badge to see the full State ranking.Click here to see the full State ranking.
vs avg
Staff typeHours / Day / Residentvs state avg
Registered Nurse (RN) Info RNs hold the highest nursing license and can assess residents, interpret test results, and direct care plans. More RN hours per day often signals stronger clinical oversight and faster response to health changes. 16m per day
LPN / LVN Info Licensed Practical Nurses (LPNs) or Licensed Vocational Nurses (LVNs) deliver routine hands-on care — medication administration, wound dressing, and monitoring vital signs. They work under RN supervision and make up a large share of daily bedside care. 1h 0m per day
Nurse Aide Info Certified Nurse Aides (CNAs) provide the most direct day-to-day assistance: bathing, dressing, feeding, and mobility. Nurse aide hours are typically the largest staffing category and directly affect residents' quality of life. 2h 26m per day
Weekend Total Nursing Info Combined nursing hours (RN + LPN + Nurse Aide) per resident per day on weekends. Staffing often drops on weekends — this figure reveals whether the facility maintains adequate coverage outside of weekday hours. 3h 3m per day
Physical Therapist Info Hours per resident per day provided by licensed Physical Therapists (PTs) or PT Assistants. PT services help residents recover mobility after injury or illness and are especially important for post-acute (short-stay) rehabilitation. 5m per day
Weekend RN Info Registered nurse hours specifically on weekends. Facilities sometimes reduce RN presence on Saturdays and Sundays — a low weekend RN figure compared to weekday hours can indicate reduced clinical oversight when most administrative staff are absent. 11m per day

Capacity and availability

Avg. Length of Stay
118 days
Bed community size
75-bed community Rank #357 / 672Bed count — State benchmarkedThis home is ranked 357th out of 672 homes in Georgia. Shows this facility's certified or reported bed count compared to other Georgia facilities. Larger communities may offer more amenities, programs, and on-site services for residents and families.Rankings are based only on facilities in Georgia that report data for that category. Facilities without available data are excluded from the ranking.Click the rank badge to see the full State ranking.Click here to see the full State ranking.
A moderately sized community that may balance personal attention with shared amenities and social activities.
Years in operation
12 years in operation Rank #181 / 670Years in operation — State benchmarkedThis home is ranked 181st out of 670 homes in Georgia. Shows how long this facility has been in operation compared to other Georgia facilities. Longer operating histories may benefit residents, families, and staff.Rankings are based only on facilities in Georgia that report data for that category. Facilities without available data are excluded from the ranking.Click the rank badge to see the full State ranking.Click here to see the full State ranking.
A community with a solid operating history and experience delivering ongoing care.
Walk Score
Walk Score: 35 / 100 Rank #487 / 873Walk Score — State benchmarkedThis home is ranked 487th out of 873 homes in Georgia. Shows how walkable this facility's neighborhood is compared to the average Walk Score across Georgia facilities. Higher scores benefit residents, families, and staff.Rankings are based only on facilities in Georgia that report data for that category. Facilities without available data are excluded from the ranking.Click the rank badge to see the full State ranking.Click here to see the full State ranking.
Somewhat walkable. A few nearby services may be reachable on foot, but most trips require transportation.

About this community

Occupancy

Occupancy rate
74%
Rank #165 / 325Occupancy rate — State benchmarkedThis home is ranked 165th out of 325 homes in Georgia. Shows this facility's occupancy rate versus the Georgia average, with its Statewide rank out of 325. Higher occupancy signals strong local demand and financial stability.Rankings are based only on facilities in Georgia that report data for that category. Facilities without available data are excluded from the ranking.Click the rank badge to see the full State ranking.Click here to see the full State ranking.
Lower than the Georgia average: 78.1%
Occupied beds
55 / 75
Average occupied beds in Georgia homes 88 beds

License Details

Facility TypePersonal Care Home
IssuanceJune 27, 2013
CountyGwinnett

Ownership & Operating Entity

Atria Park of Tucker is administered by Rajae Idir.

Contact Information

Contact Atria Park of Tucker

Inspection History

In Georgia, the Department of Community Health, Healthcare Facility Regulation Division conducts unannounced inspections to ensure facilities adhere to state health and safety requirements.

Since 2018 · 8 years of data 6 deficiencies 7 inspections

Inspection Scorecard Info This scorecard compares key inspection, deficiency, and complaint metrics at this facility against the Georgia state average. Metrics rated ≥15% worse than average are highlighted in red; those ≥15% better are highlighted in green.

Since 2018 vs. Georgia state average
Overall vs. GA average 0 Worse No metrics in this bucket. 4 Better Metrics better than Georgia average:
• Total deficiencies (71% below)
• Deficiencies per year (69% below)
• Deficiencies per inspection (57% below)
• Total inspections (30% below)
Latest Inspection January 9, 2025 Complaint Investigation

Deficiencies Info Deficiencies are formal regulatory issues recorded during state inspections.

This FacilityGA Averagevs. GA Avg
Total deficiencies Info Formal regulatory issues recorded by inspectors across all inspection types. 621 This facility has 71% fewer total deficiencies than a typical Georgia assisted living residence (6 vs. GA avg 21).↓ 71% better
Deficiencies per year Info Average deficiencies per year since 2018. 0.82.6 This facility has 69% fewer deficiencies per year than a typical Georgia assisted living residence (0.8 vs. GA avg 2.6).↓ 69% better
Deficiencies per inspection Info Average deficiencies per inspection. 0.92.1 This facility has 57% fewer deficiencies per inspection than a typical Georgia assisted living residence (0.9 vs. GA avg 2.1).↓ 57% better

Inspections Info State inspections evaluate whether the facility meets health and safety standards.

This FacilityGA Averagevs. GA Avg
Total inspections Info Combined count of all routine and focused inspections. Excludes complaint investigations. 710 This facility has 30% fewer total inspections than a typical Georgia assisted living residence (7 vs. GA avg 10).↓ 30% better

Inspection Reports Summary Info An editor-reviewed summary of the themes and findings across this facility's recent inspection reports.

  • January 9, 2025 complaint investigation found no rule violations or deficiencies after intake #GA00252664 was reviewed.
  • April 17, 2023 complaint investigation cited two medication management deficiencies involving incomplete MAR and improper disposal of unused medications.
  • April 3, 2018 complaint investigation found four deficiencies including staff training failures, missing resident legal documents, and staff exploitation of resident funds totaling $4,000.

Health Inspection History

Inspections since 2023
Total health inspections 7

State average N/A


Last Health inspection on Jul 2025

Total health citations
42 Rank #195 / 203Health citations — State benchmarkedThis home is ranked 195th out of 203 homes in Georgia. Shows this facility's total health deficiency citations benchmarked to the Georgia State average, with a ranking across all 203 GA facilities. Lower citation counts earn a better rank.Rankings are based only on facilities in Georgia that report data for that category. Facilities without available data are excluded from the ranking.Click the rank badge to see the full State ranking.Click here to see the full State ranking.

State average N/A

Citations per inspection
6 Rank #131 / 203Citations per inspection — State benchmarkedThis home is ranked 131st out of 203 homes in Georgia. Shows average deficiency citations per CMS inspection for this facility versus the Georgia mean across 203 facilities with citation data. Lower is better.Rankings are based only on facilities in Georgia that report data for that category. Facilities without available data are excluded from the ranking.Click the rank badge to see the full State ranking.Click here to see the full State ranking.

State average N/A


Health citations are formal notices following inspections when they fail to comply with safety and care standards.

12 of 42 resulted from complaint investigations; and 30 of 42 came from combined inspections (standard and complaint).

Breakdown of citation severity (last 3 years)
Critical health citations
4
In line with State average

State average: N/A


Serious health citations
0
In line with State average

State average: N/A

4 critical citations State average: N/A

0 serious citations State average: N/A

38 moderate citations State average: N/A

0 minor citations State average: N/A
Citations history (last 3 years)
Resident Rights moderate citation Jul 10, 2025
Corrected

Resident Rights moderate citation Jul 10, 2025
Corrected

Resident Rights moderate citation Jul 10, 2025
Corrected

Quality of Care moderate citation Oct 31, 2024
Corrected

Staffing Data

Reporting period: October 1 – December 31, 2025 (Q4 2025). Source: CMS Payroll-Based Journal report.

Total staff 146
Employees 122
Contractors 24
Staff to resident ratio 1.46 : 1
0% compared with State average

State average ratio: 0 : 0

Avg staff/day 58
Average shift 9.3 hours
0% compared with State average

State average: 0 hours

Total staff hours (quarter) 49,746

Nursing staff breakdown

Q4 2025 · Oct 1 – Dec 31 More info This data comes from the CMS Payroll-Based Journal report covering October 1 – December 31, 2025.
Registered Nurse

Manages medical care and health needs.

RN Staff Info 15 total: 14 full-time employees and 1 contractor. 15
Average shift length Info Average shift length. Calculated as total hours divided by days worked and average staff per day. 9.4 hours
Licensed Practical Nurse

Assists with medical care and medications.

LPN Staff Info All 36 LPN Staff are full-time employees. No contractors work on this role. 36
Average shift length Info Average shift length. Calculated as total hours divided by days worked and average staff per day. 10 hours
Certified Nursing Assistant

Helps with daily care and mobility.

CNA Staff Info All 47 CNA Staff are full-time employees. No contractors work on this role. 47
Average shift length Info Average shift length. Calculated as total hours divided by days worked and average staff per day. 9.9 hours

Contractor staffing

Q4 2025 · Oct 1 – Dec 31 More info This data comes from the CMS Payroll-Based Journal report covering October 1 – December 31, 2025.

Total hours from contractors

8.1%

4,040 contractor hours this quarter

Occupational Therapy Assistant: 4 Physical Therapy Aide: 3 Respiratory Therapy Technician: 3 Physical Therapy Assistant: 3 Qualified Social Worker: 3 Speech Language Pathologist: 3 Feeding Assistant: 2 Registered Nurse: 1 Occupational Therapy Aide: 1 Medical Director: 1

Staff by category

Q4 2025 · Oct 1 – Dec 31 More info This data comes from the CMS Payroll-Based Journal report covering October 1 – December 31, 2025.
Certified Nursing Assistant4704720,04592100%9.9
Licensed Practical Nurse3603610,27892100%10
Medication Aide/Technician150157,95692100%10
Registered Nurse141152,5299199%9.4
Other Dietary Services Staff3031,78392100%8.8
RN Director of Nursing2021,1977582%9
Physical Therapy Aide0331,0077582%7.8
Respiratory Therapy Technician0339527076%7.8
Dental Services Staff1015366571%8.2
Mental Health Service Worker1015206470%8.1
Physical Therapy Assistant0335146672%7.6
Administrator1015126470%8
Speech Language Pathologist0335056773%7.3
Qualified Social Worker0334456672%6.6
Clinical Nurse Specialist1013924953%8
Feeding Assistant0223435054%6.1
Occupational Therapy Aide011762527%3
Occupational Therapy Assistant044665155%1.2
Nurse Practitioner1015678%8
Medical Director011351516%2.4
47 Certified Nursing Assistant
% of Days 100%
36 Licensed Practical Nurse
% of Days 100%
15 Medication Aide/Technician
% of Days 100%
15 Registered Nurse
% of Days 99%
3 Other Dietary Services Staff
% of Days 100%
2 RN Director of Nursing
% of Days 82%
3 Physical Therapy Aide
% of Days 82%
3 Respiratory Therapy Technician
% of Days 76%
1 Dental Services Staff
% of Days 71%
1 Mental Health Service Worker
% of Days 70%
3 Physical Therapy Assistant
% of Days 72%
1 Administrator
% of Days 70%
3 Speech Language Pathologist
% of Days 73%
3 Qualified Social Worker
% of Days 72%
1 Clinical Nurse Specialist
% of Days 53%
2 Feeding Assistant
% of Days 54%
1 Occupational Therapy Aide
% of Days 27%
4 Occupational Therapy Assistant
% of Days 55%
1 Nurse Practitioner
% of Days 8%
1 Medical Director
% of Days 16%

Penalties and fines

Includes penalties issued in 2023

Federal penalties imposed by CMS for regulatory violations, including civil money penalties (fines) and denials of payment for new Medicare/Medicaid admissions.

Source: CMS Penalties Database (Data as of Jan 2026)

Total fines amount $115K Rank #182 / 204Federal fines — State benchmarkedThis home is ranked 182nd out of 204 homes in Georgia. Shows this facility's cumulative CMS federal fine dollars versus the Georgia average among facilities with fines, and where it ranks among 204 facilities in the pool. Lower total dollars mean a better rank.Rankings are based only on facilities in Georgia that report data for that category. Facilities without available data are excluded from the ranking.Click the rank badge to see the full State ranking.Click here to see the full State ranking.
187% higher than State average

State average: $40K

Number of fines 2
In line with State average

State average: 2.1

Payment Denials Info Serious action where Medicare and/or Medicaid temporarily stops payments for new residents until issues are fixed. 1
252% more payment denials than State average

State average: 0.3

Fines amount comparison
This facility $115K
State average $40K
Penalty History

Penalties are imposed by CMS for violations of federal nursing home regulations.

1 penalty in the past 3 years

Aug 17, 2023 · $47K

Civil Money Penalty Info Fines imposed for noncompliance, which can be assessed per day or per instance of violation. Aug 17, 2023
$47K

Last updated: Jan 2026

Quality of care over time

These measures show how residents usually do over time at this home, based on health outcomes and preventive care.

High-risk clinical events score Info A composite score based on pressure ulcers, falls with injury, weight loss, walking ability decline, and activities of daily living decline. 3.9
62% better than State average

State average: 10.3

Functional decline score Info A composite score based on activities of daily living decline, walking ability decline, and incontinence. 12.3
29% better than State average

State average: 17.4

Long-stay resident measures
Need for Help with Daily Activities Increased Info Percent of long-stay residents whose need for help with daily activities has increased 4.7%
72% better than State average

State average: 16.8%

Walking Ability Worsened Info Percent of long-stay residents whose ability to move independently worsened 7.6%
61% better than State average

State average: 19.4%

Low Risk Residents with Bowel/Bladder Incontinence Info Percent of low risk long-stay residents who lose control of their bowels or bladder 24.6%
53% worse than State average

State average: 16.1%

Falls with Major Injury Info Percent of long-stay residents experiencing one or more falls with major injury 1.3%
58% better than State average

State average: 3.2%

High Risk Residents with Pressure Ulcers Info Percent of long-stay high risk residents with pressure ulcers 3.5%
44% better than State average

State average: 6.3%

Urinary Tract Infection Info Percent of long-stay residents with a urinary tract infection 1.6%
36% better than State average

State average: 2.5%

Lost Too Much Weight Info Percent of long-stay residents who lose too much weight 2.0%
66% better than State average

State average: 6.0%

Depressive Symptoms Info Percent of long-stay residents who have depressive symptoms 71.9%
722% worse than State average

State average: 8.7%

Antipsychotic Use Info Percent of long-stay residents who received an antipsychotic medication 11.8%
38% better than State average

State average: 19.1%

Pneumococcal Vaccine Info Percent of long-stay residents assessed and appropriately given the pneumococcal vaccine 92.8%
In line with State average

State average: 91.5%

Influenza Vaccine Info Percent of long-stay residents assessed and appropriately given the seasonal influenza vaccine 83.8%
12% worse than State average

State average: 95.0%

Short-stay resident measures
Pneumococcal Vaccine Info Percent of short-stay residents assessed and appropriately given the pneumococcal vaccine 42.8%
47% worse than State average

State average: 80.6%

Antipsychotic medication increase Info Percent of short-stay residents who newly received an antipsychotic medication 1.3%
42% better than State average

State average: 2.2%

Influenza Vaccine Info Percent of short-stay residents assessed and appropriately given the seasonal influenza vaccine 38.5%
51% worse than State average

State average: 78.2%

Breakdown by payment type

Medicare

20% of new residents, usually for short-term rehab.

Typical stay 1 - 2 months

Private pay

41% of new residents, often for short stays.

Typical stay 1 - 2 months

Medicaid

39% of new residents, often for long-term daily care.

Typical stay 8 - 9 months

Facility Characteristics

Source: CMS Long-Term Care Facility Characteristics (Data as of Jan 2026)

Total residents 100
Medicare
6
6% of residents
Medicaid
89
89% of residents
Private pay or other
5
5% of residents
Programs & Services
Residents Group

Residents meet regularly to discuss policies, care quality, and activities

Active Resident Council

Organized group of residents that meets regularly to discuss facility policies, quality of life, and activities.

Finances and operations

Based on CMS SNF Cost Report for fiscal year ending in 12/2023.

For-profit
Operated by a single business entity.
Net patient revenue Info Net patient revenue — what the home actually collects for resident care, after contractual allowances, bad debt and discounts are subtracted from its gross charges (CMS cost report, Worksheet G-3). It covers resident care only; money the home earns from other sources is shown separately as "Other income."
$10.0M
Net patient income Info Net patient income: net patient revenue minus the home's total operating expenses. A positive figure means it earns more from resident care than it spends to deliver it; a negative figure means the opposite. It excludes non-operating "other income."
-$3.4M
For-profit Operated by a single business entity.
Net patient revenue Info Net patient revenue — what the home actually collects for resident care, after contractual allowances, bad debt and discounts are subtracted from its gross charges (CMS cost report, Worksheet G-3). It covers resident care only; money the home earns from other sources is shown separately as "Other income."
$10.0M Rank #99 / 197Revenue — State benchmarkedThis home is ranked 99th out of 197 homes in Georgia. Shows this facility's annual revenue compared to the Georgia average. Higher revenue generally means more resources for staffing and capital — read alongside Payroll %.Rankings are based only on facilities in Georgia that report data for that category. Facilities without available data are excluded from the ranking.Click the rank badge to see the full State ranking.Click here to see the full State ranking.
Net patient income Info Net patient income: net patient revenue minus the home's total operating expenses. A positive figure means it earns more from resident care than it spends to deliver it; a negative figure means the opposite. It excludes non-operating "other income."
-$3.4M
Other income Info Money the home earns outside of resident care — such as investments, grants, rentals and other non-operating sources (CMS cost report, Worksheet G-3). It is tracked separately from net patient revenue: it is not part of that figure, and it is not included in net patient income.
$138.4K
Payroll costs Info Staff salaries plus wage-related costs — benefits such as payroll taxes, health insurance and retirement — from the home's own accounting records (CMS cost report, Worksheet A). Contract or agency labor is counted separately, under other operating costs. Rank #59 / 197Payroll — State benchmarkedThis home is ranked 59th out of 197 homes in Georgia. Shows total annual staff payroll benchmarked to the Georgia average. Higher payroll investment relative to peers often signals better staffing and less reliance on cheaper contract labor.Rankings are based only on facilities in Georgia that report data for that category. Facilities without available data are excluded from the ranking.Click the rank badge to see the full State ranking.Click here to see the full State ranking.
$6.1M 61.5% of net patient revenue Info Payroll as a share of revenue: staff salaries and wage-related benefits divided by net patient revenue. A higher figure means more of each revenue dollar goes to staff pay. Rank #27 / 197Payroll % — State benchmarkedThis home is ranked 27th out of 197 homes in Georgia. Shows payroll as a percentage of revenue versus the Georgia average. Well-run Georgia facilities typically land around 50–62% — the top third Statewide. Below 25% may signal understaffing or heavy agency use — read with Staffing ratings.Rankings are based only on facilities in Georgia that report data for that category. Facilities without available data are excluded from the ranking.Click the rank badge to see the full State ranking.Click here to see the full State ranking.
Other operating costs Info Everything it costs to run the home apart from payroll — food, utilities, supplies, maintenance, contract labor and administration. Calculated as total operating expense minus payroll (staff salaries and wage-related benefits).
$7.3M
Total costs Info The home's total operating expense for the year — all the costs of running it, salaries included (CMS cost report, Worksheet G-3).
$13.4M

What does this home offer?

Room sizes icon
Room sizes icon

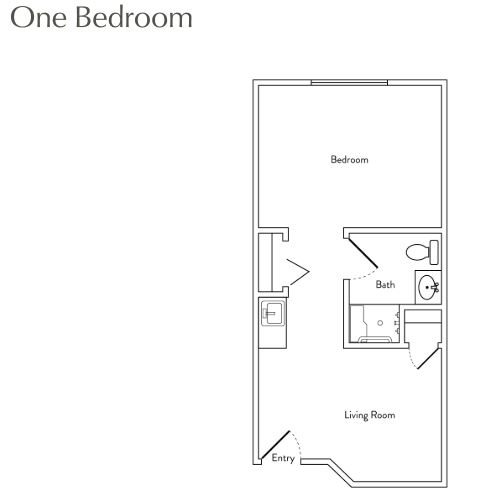
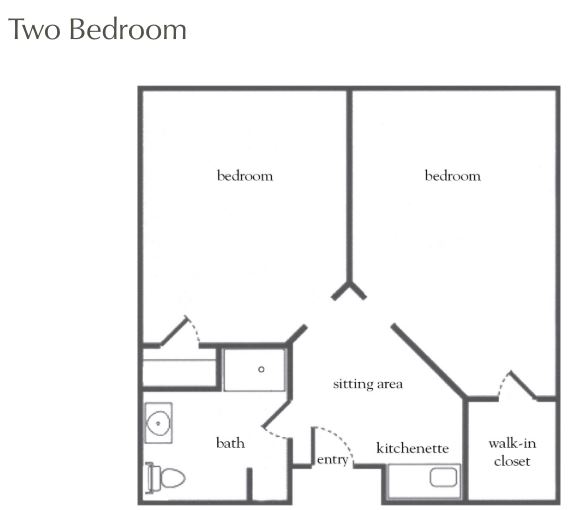
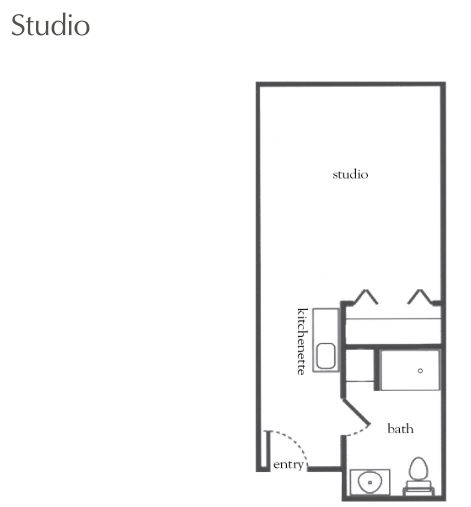
Room Sizes: 343 / 443 / 543 sq. ft.

Housing options icon

Housing Options: Studio / 1 Bed / 2 Bed

Building type icon
Building type icon

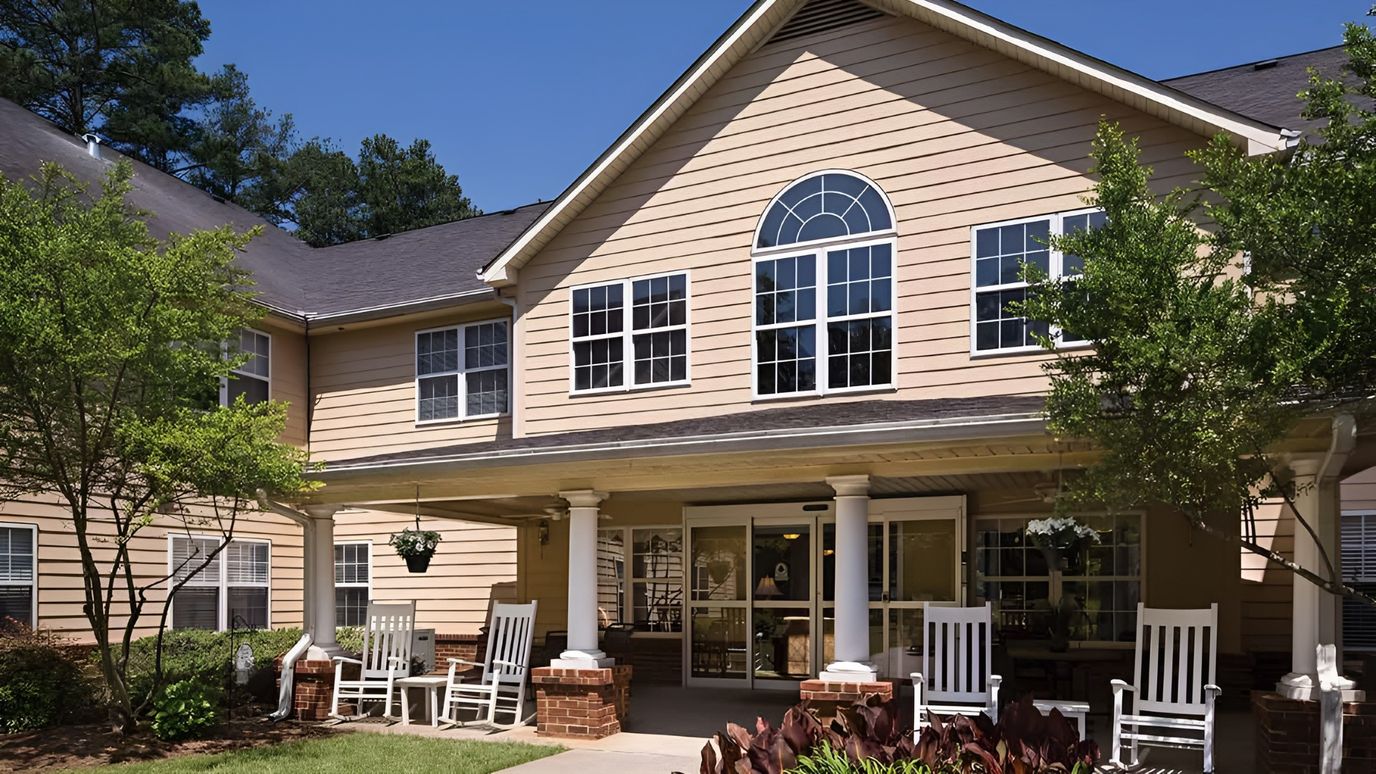
Building Type: 2-story

Transportation services icon

Transportation Services

Fitness and recreation icon

Fitness and Recreation

Type of Rooms Available

1 Bed
1 Bed
1 / 4
1 Bed
1
443 sq. ft

Who this home usually serves

TYPE OF STAY

Mix of rehab and long-term care

This home supports both short-term rehab and long-term care, with residents staying for a wide range of durations.

New residents most often arrive under private pay (41% of admissions), and a typical private pay stay runs around 1 - 2 months.

Admissions
301 total

Coverage residents most often arrive under.

Medicare 20%
Private pay 41%
Medicaid 39%
Discharges
328 total

Coverage residents most often leave under.

Medicare 7%
Private pay 34%
Medicaid 59%

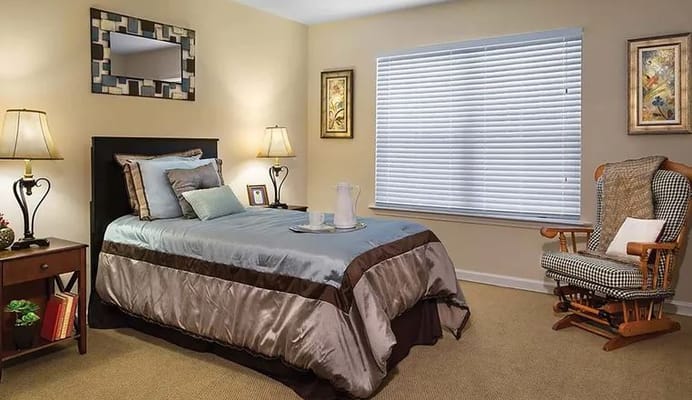
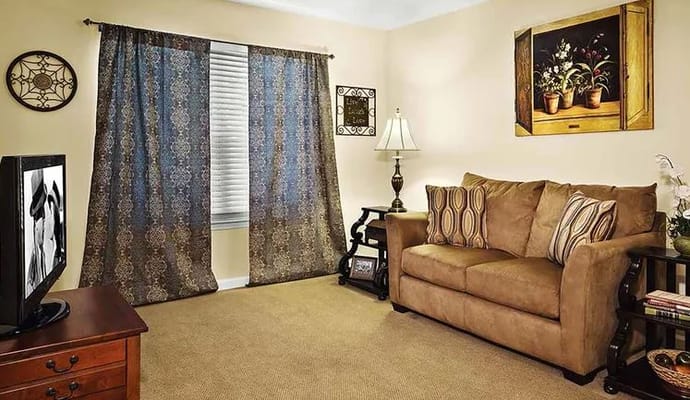
Living Spaces & Floor Plans for Atria Park of Tucker

Places of interest near Atria Park of Tucker

Address 3.3 miles from city center Info Estimated distance in miles from Tucker's city center to Atria Park of Tucker's address, calculated via Google Maps. — 8.59 miles to nearest hospital (Piedmont Eastside Medical Center)

Calculate Travel Distance to Atria Park of Tucker

Add your location

Address

Frequently Asked Questions about Atria Park of Tucker

Is Atria Park of Tucker in a walkable area?

Atria Park of Tucker has a walk score of 35. Somewhat walkable. A few nearby services may be reachable on foot, but most trips require transportation.

What is the occupancy rate at Atria Park of Tucker?

Atria Park of Tucker's occupancy is 74%.

What is the best email address for Atria Park of Tucker?

The team at Atria Park of Tucker can be reached at rajae.idir@atriaseniorliving.com.

Does Atria Park of Tucker operate as a for-profit or non-profit?

Atria Park of Tucker is registered as a for-profit in GA.

Who is the administrator of Atria Park of Tucker?

Rajae Idir is the administrator of Atria Park of Tucker.

How many beds does Atria Park of Tucker have?

Atria Park of Tucker has 75 beds.

Are there photos of Atria Park of Tucker?

Yes — there are 4 photos of Atria Park of Tucker in the photo gallery on this page.

Guides for Better Senior Living

Care Cost Calculator: See Prices in Your Area

Nursing Home Data Explorer

Don’t Wait Too Long: 7 Red Flag Signs Your Parent Needs Assisted Living Now

The True Cost of Assisted Living in 2025 – And How Families Are Paying For It

Understanding Senior Living Costs: Pricing Models, Discounts & Financial Assistance