Resorts of Augsburg
Nursing Home, Assisted Living & Independent Living · Baltimore, MD
CMS overall rating Info The Overall CMS Rating is scored from 1 to 5 stars and combines results from health inspections, staffing levels, and quality measures. Health inspections carry the most weight. Staffing and quality scores can increase or decrease the final rating based on performance compared to state and national standards.

Resorts of Augsburg

Nursing Home, Assisted Living & Independent Living · Baltimore, MD
CMS overall rating Info The Overall CMS Rating is scored from 1 to 5 stars and combines results from health inspections, staffing levels, and quality measures. Health inspections carry the most weight. Staffing and quality scores can increase or decrease the final rating based on performance compared to state and national standards.
Calculator: See prices in your area
Resorts of Augsburg accepts Medicare, Medicaid, and private pay.

Overview of Resorts of Augsburg

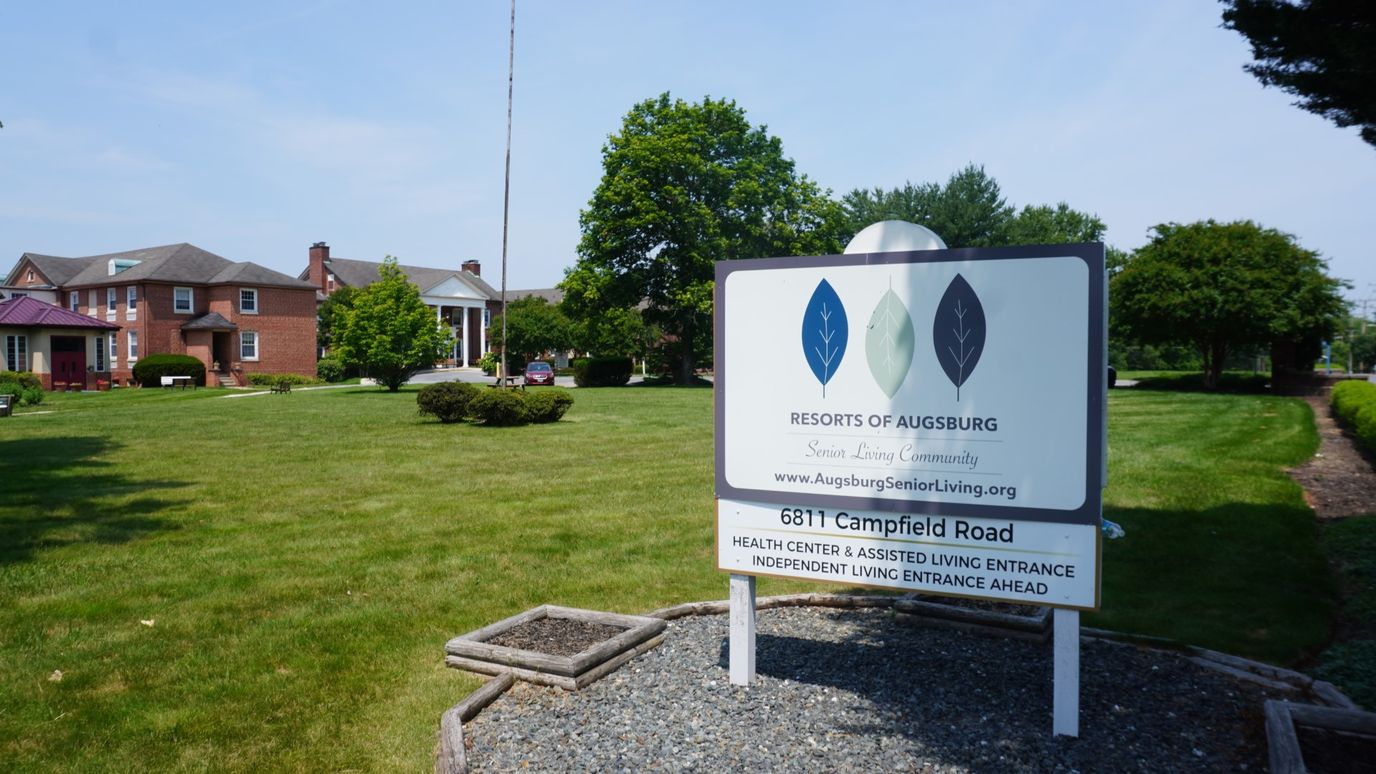
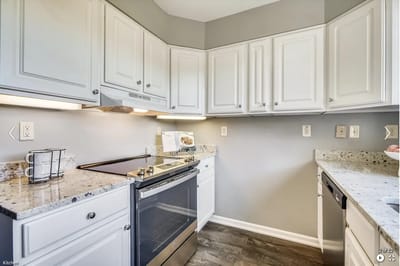
Augsburg Senior Living, located in the Baltimore, Maryland area, has been serving older adults for over 100 years. The community offers a range of living options, including independent living, assisted living, skilled nursing, and short-term rehabilitation, providing a seamless continuum of care as residents’ needs change. Augsburg’s mission is centered on cultivating a vibrant and caring environment where seniors can age gracefully. The community prioritizes respect, independence, compassion, and quality of life, fostering an inclusive atmosphere where residents feel valued, secure, and at home.

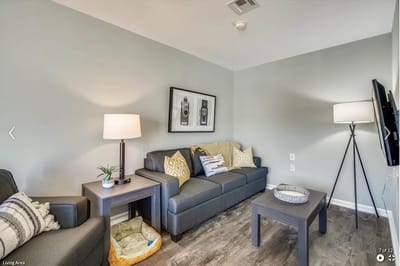
Augsburg’s comprehensive services and amenities are designed to enhance the overall living experience, with features like restaurant-style dining, fitness facilities, outdoor courtyards, and a variety of social and recreational activities. Whether residents require independent living, assisted living, or skilled nursing care, Augsburg is committed to delivering exceptional, personalized care that adapts to their changing needs. The community’s dedicated team works to create a supportive, nurturing environment that promotes the well-being, dignity, and satisfaction of every resident.

(410) 486-4573

Quality ratings

Measured by Centers for Medicare & Medicaid Services (CMS)

Overall rating Info The Overall CMS Rating combines results from health inspections, staffing levels and quality measures. Health inspections carry the most weight. Staffing and quality scores can increase or decrease the final rating based on performance compared to state and national standards.
▼ 34.2% Below MD avg. ▼ 34.2% Below MD avg.Click the badge to see the full State ranking.Click here to see the full State ranking.
Health Inspection Info Based on the results of the facility's three most recent standard inspections and any complaint investigations. CMS reviews the number, scope, and severity of deficiencies, with more recent findings weighted more heavily.
▼ 29.0% Below MD avg. ▼ 29.0% Below MD avg.Click the badge to see the full State ranking.Click here to see the full State ranking.
Staffing Info Measures average nursing staff hours per resident per day, including Registered Nurses (RNs) and total nursing staff. Ratings are adjusted based on the level of care residents require and are compared to state and national benchmarks.
▲ 31.3% Above MD avg. ▲ 31.3% Above MD avg.Click the badge to see the full State ranking.Click here to see the full State ranking.
Quality Measures Info Based on clinical and physical health indicators reported to CMS, such as hospital readmissions, falls, pressure ulcers, and improvements in mobility. These measures reflect how well residents' health needs are being managed.
▲ 8.2% Above MD avg. ▲ 8.2% Above MD avg.Click the badge to see the full State ranking.Click here to see the full State ranking.

Staffing hours breakdown

Info Daily nursing hours per resident by staff type, reported to CMS. Higher is generally better — compare this facility to state and national averages to see where staffing stands.

Hours per resident per day — compared to Maryland state averages

Total nursing care / resident Info This home is ranked 28th out of 144 homes in Maryland. Total adjusted nursing hours per resident per day, combining RN, LPN, and aide time. CMS adjusts this for case-mix so facilities can be fairly compared.
4h 10m per day
Rank #28 / 144Nurse hours — State benchmarkedThis home is ranked 28th out of 144 homes in Maryland. Shows adjusted nurse hours per resident per day benchmarked to the Maryland average, with a ranking across 144 Maryland SNFs. More hours mean more direct care. The national average is about 3.5 hrs; below 3.0 is a red flag.Click the rank badge to see the full State ranking.Click here to see the full State ranking.
This facility Maryland avg (3h 46m per day)
vs Maryland avg
+11%

1 of 6 metrics below state avg

Standout metric Physical Therapist is +40% above state avg
Staff typeHours / Day / Residentvs state avg
Registered Nurse (RN) Info RNs hold the highest nursing license and can assess residents, interpret test results, and direct care plans. More RN hours per day often signals stronger clinical oversight and faster response to health changes. 51m per day ▲ 4% State avg: 49m per day · National avg: 41m per day
LPN / LVN Info Licensed Practical Nurses (LPNs) or Licensed Vocational Nurses (LVNs) deliver routine hands-on care — medication administration, wound dressing, and monitoring vital signs. They work under RN supervision and make up a large share of daily bedside care. 51m per day ▼ 7% State avg: 55m per day · National avg: 52m per day
Nurse Aide Info Certified Nurse Aides (CNAs) provide the most direct day-to-day assistance: bathing, dressing, feeding, and mobility. Nurse aide hours are typically the largest staffing category and directly affect residents' quality of life. 2h 23m per day ▲ 11% State avg: 2h 9m per day · National avg: 2h 20m per day
Weekend Total Nursing Info Combined nursing hours (RN + LPN + Nurse Aide) per resident per day on weekends. Staffing often drops on weekends — this figure reveals whether the facility maintains adequate coverage outside of weekday hours. 4h 3m per day ▲ 17% State avg: 3h 28m per day · National avg: 3h 26m per day
Physical Therapist Info Hours per resident per day provided by licensed Physical Therapists (PTs) or PT Assistants. PT services help residents recover mobility after injury or illness and are especially important for post-acute (short-stay) rehabilitation. 7m per day ▲ 40% State avg: 5m per day · National avg: 4m per day
Weekend RN Info Registered nurse hours specifically on weekends. Facilities sometimes reduce RN presence on Saturdays and Sundays — a low weekend RN figure compared to weekday hours can indicate reduced clinical oversight when most administrative staff are absent. 42m per day ▲ 14% State avg: 37m per day · National avg: 28m per day

Types of Care at Resorts of Augsburg

Assisted Living Independent Living Nursing Home

Capacity and availability

This home usually has limited availability

Occupancy between 85% and 95% suggests balanced demand.

Higher occupancy than the Maryland average: 82.4%
Occupancy rate 89.4% Rank #40 / 146Occupancy rate — State benchmarkedThis home is ranked 40th out of 146 homes in Maryland. Shows this facility's occupancy rate versus the Maryland average, with its Statewide rank out of 146. Higher occupancy signals strong local demand and financial stability.Click the rank badge to see the full State ranking.Click here to see the full State ranking.
Avg. Length of Stay 231 days
Occupancy rate
89.4% Rank #40 / 146Occupancy rate — State benchmarkedThis home is ranked 40th out of 146 homes in Maryland. Shows this facility's occupancy rate versus the Maryland average, with its Statewide rank out of 146. Higher occupancy signals strong local demand and financial stability.Click the rank badge to see the full State ranking.Click here to see the full State ranking.
Avg. Length of Stay
231 days
Walk Score
Walk Score: 18 / 100 Rank #757 / 986Walk Score — State benchmarkedThis home is ranked 757th out of 986 homes in Maryland. Shows how walkable this facility's neighborhood is compared to the average Walk Score across Maryland SNFs. Higher scores benefit residents, families, and staff.Click the rank badge to see the full State ranking.Click here to see the full State ranking.
Car-dependent. Most errands require a car, with limited nearby walkable options.

Contact Resorts of Augsburg

Staffing Data

Reporting period: October 1 – December 31, 2025 (Q4 2025). Source: CMS Payroll-Based Journal report.

Total staff 246
Employees 140
Contractors 106
Staff to resident ratio 2.51:1
38% better than Maryland average
Maryland average ratio: 1.81:1 Maryland average ratio: 1.81:1See full Maryland ranking
Avg staff/day 70
Average shift 8.8 hours
10% better than Maryland average
Maryland average: 8 hours Maryland average shift: 8 hoursSee full Maryland ranking
Total staff hours (quarter) 56,846

Nursing staff breakdown

Q4 2025 · Oct 1 – Dec 31 More info This data comes from the CMS Payroll-Based Journal report covering October 1 – December 31, 2025.
Registered Nurse

Manages medical care and health needs.

RN Staff 30
Average shift length Info Average shift length. Calculated as total hours divided by days worked and average staff per day. 9.5 hours

This role is partially covered by contractors.

Licensed Practical Nurse

Assists with medical care and medications.

LPN Staff 42
Average shift length Info Average shift length. Calculated as total hours divided by days worked and average staff per day. 9.7 hours

This role is partially covered by contractors.

Certified Nursing Assistant

Helps with daily care and mobility.

CNA Staff 117
Average shift length Info Average shift length. Calculated as total hours divided by days worked and average staff per day. 9.6 hours

This role is partially covered by contractors.

Contractor staffing

Q4 2025 · Oct 1 – Dec 31 More info This data comes from the CMS Payroll-Based Journal report covering October 1 – December 31, 2025.

Total hours from contractors

12.7%

7,215 contractor hours this quarter

Certified Nursing Assistant: 74 Licensed Practical Nurse: 17 Registered Nurse: 13 Medical Director: 1 Feeding Assistant: 1

Staff by category

Q4 2025 · Oct 1 – Dec 31 More info This data comes from the CMS Payroll-Based Journal report covering October 1 – December 31, 2025.
Certified Nursing Assistant437411726,07892100%9.6
Licensed Practical Nurse25174210,50492100%9.7
Registered Nurse1713306,51192100%9.5
Medication Aide/Technician8082,96892100%8.9
Other Dietary Services Staff150152,6719199%6.3
Clinical Nurse Specialist7072,3419199%7.9
Speech Language Pathologist5051,4027480%7.1
Physical Therapy Aide4041,0817480%7.2
Respiratory Therapy Technician5051,0558087%6.2
Physical Therapy Assistant4046447177%6.4
Administrator1014245358%8
Nurse Practitioner2023956065%6.6
Dental Services Staff1013886166%6.4
Qualified Social Worker3032004347%4.6
Feeding Assistant0111562628%6
Medical Director011281415%2
117 Certified Nursing Assistant
% of Days 100%
42 Licensed Practical Nurse
% of Days 100%
30 Registered Nurse
% of Days 100%
8 Medication Aide/Technician
% of Days 100%
15 Other Dietary Services Staff
% of Days 99%
7 Clinical Nurse Specialist
% of Days 99%
5 Speech Language Pathologist
% of Days 80%
4 Physical Therapy Aide
% of Days 80%
5 Respiratory Therapy Technician
% of Days 87%
4 Physical Therapy Assistant
% of Days 77%
1 Administrator
% of Days 58%
2 Nurse Practitioner
% of Days 65%
1 Dental Services Staff
% of Days 66%
3 Qualified Social Worker
% of Days 47%
1 Feeding Assistant
% of Days 28%
1 Medical Director
% of Days 15%

Penalties and fines

Includes penalties issued in 2024

Federal penalties imposed by CMS for regulatory violations, including civil money penalties (fines) and denials of payment for new Medicare/Medicaid admissions.

Source: CMS Penalties Database (Data as of Jan 2026)

Total fines amount $24K Rank #114 / 146Federal fines — State benchmarkedThis home is ranked 114th out of 146 homes in Maryland. Shows this facility's cumulative CMS federal fine dollars versus the Maryland average among facilities with fines, and where it ranks among 146 skilled nursing facilities in the pool. Lower total dollars mean a better rank.Click the rank badge to see the full State ranking.Click here to see the full State ranking.
61% lower than Maryland average

Maryland average: $61K

Number of fines 4
169% more fines than Maryland average

Maryland average: 1.5

Payment Denials Info Serious action where Medicare and/or Medicaid temporarily stops payments for new residents until issues are fixed. 0
100% fewer payment denials than Maryland average

Maryland average: 0.1

Fines amount comparison
This facility $24K
Maryland average $61K
Penalty History

Penalties are imposed by CMS for violations of federal nursing home regulations.

4 penalties in the past 3 years

Multiple penalties were reported in the last 3 years.

Civil Money Penalty Info Fines imposed for noncompliance, which can be assessed per day or per instance of violation. Apr 18, 2024
$16K
Civil Money Penalty Info Fines imposed for noncompliance, which can be assessed per day or per instance of violation. Feb 20, 2024
$2K
Civil Money Penalty Info Fines imposed for noncompliance, which can be assessed per day or per instance of violation. Feb 12, 2024
$2K
Civil Money Penalty Info Fines imposed for noncompliance, which can be assessed per day or per instance of violation. Jan 22, 2024
$3K

Last updated: Jan 2026

Quality of care over time

These measures show how residents usually do over time at this home, based on health outcomes and preventive care.

High-risk clinical events score Info A composite score based on pressure ulcers, falls with injury, weight loss, walking ability decline, and activities of daily living decline. 12.3
5% better than Maryland average

Maryland average: 12.9

Functional decline score Info A composite score based on activities of daily living decline, walking ability decline, and incontinence. 22.1
14% better than Maryland average

Maryland average: 25.7

Long-stay resident measures
Above average Maryland avg: 3.7 Info CMS star rating based on long-stay quality measure performance. 5 stars = significantly above average, 1 star = significantly below average.
Need for Help with Daily Activities Increased Info Percent of long-stay residents whose need for help with daily activities has increased 26.1%
10% worse than Maryland average

Maryland average: 23.7%

Walking Ability Worsened Info Percent of long-stay residents whose ability to move independently worsened 16.8%
39% better than Maryland average

Maryland average: 27.7%

Low Risk Residents with Bowel/Bladder Incontinence Info Percent of low risk long-stay residents who lose control of their bowels or bladder 23.2%
10% better than Maryland average

Maryland average: 25.9%

Falls with Major Injury Info Percent of long-stay residents experiencing one or more falls with major injury 1.9%
16% better than Maryland average

Maryland average: 2.3%

High Risk Residents with Pressure Ulcers Info Percent of long-stay high risk residents with pressure ulcers 8.1%
24% worse than Maryland average

Maryland average: 6.5%

Urinary Tract Infection Info Percent of long-stay residents with a urinary tract infection 0.6%
66% better than Maryland average

Maryland average: 1.6%

Lost Too Much Weight Info Percent of long-stay residents who lose too much weight 8.6%
48% worse than Maryland average

Maryland average: 5.8%

Depressive Symptoms Info Percent of long-stay residents who have depressive symptoms 31.4%
55% worse than Maryland average

Maryland average: 20.2%

Antipsychotic Use Info Percent of long-stay residents who received an antipsychotic medication 11.3%
13% better than Maryland average

Maryland average: 12.9%

Pneumococcal Vaccine Info Percent of long-stay residents assessed and appropriately given the pneumococcal vaccine 79.5%
14% worse than Maryland average

Maryland average: 92.0%

Influenza Vaccine Info Percent of long-stay residents assessed and appropriately given the seasonal influenza vaccine 79.8%
17% worse than Maryland average

Maryland average: 96.6%

Hospitalizations per 1,000 days Info Number of hospitalizations per 1,000 long-stay resident days. 1.27
In line with Maryland average

Maryland average: 1.32

ED visits per 1,000 days Info Number of outpatient emergency department visits per 1,000 long-stay resident days. 0.84
31% better than Maryland average

Maryland average: 1.21

Short-stay resident measures
Average Maryland avg: 3.7 Info CMS star rating based on short-stay quality measure performance. 5 stars = much above average, 1 star = much below average.
Pneumococcal Vaccine Info Percent of short-stay residents assessed and appropriately given the pneumococcal vaccine 78.6%
In line with Maryland average

Maryland average: 78.4%

Antipsychotic medication increase Info Percent of short-stay residents who newly received an antipsychotic medication 2.9%
109% worse than Maryland average

Maryland average: 1.4%

Influenza Vaccine Info Percent of short-stay residents assessed and appropriately given the seasonal influenza vaccine 71.9%
11% worse than Maryland average

Maryland average: 80.6%

Re-hospitalized after SNF stay Info Percentage of short-stay residents who were re-hospitalized after their nursing home admission. 21.7%
In line with Maryland average

Maryland average: 21.2%

Emergency department visits Info Percentage of short-stay residents who had an outpatient emergency department visit. 10.3%
In line with Maryland average

Maryland average: 9.9%

Falls with major injury Info Percentage of SNF residents who experience falls with major injury during their stay. 0.6%
26% better than Maryland average

Maryland average: 0.8%

Ability to care for self at discharge Info Percentage of residents at or above expected ability to care for themselves at discharge. 50.0%
7% worse than Maryland average

Maryland average: 53.7%

Successful return to home or community Info Rate of successful return to home or community from a skilled nursing facility. 59.0%
17% better than Maryland average

Maryland average: 50.6%

Breakdown by payment type

Medicare

64% of new residents, usually for short-term rehab.

Typical stay 1 - 2 months

Private pay

35% of new residents, often for short stays.

Typical stay 4 months

Medicaid

1% of new residents, often for long-term daily care.

Typical stay 47 years

Facility Characteristics

Source: CMS Long-Term Care Facility Characteristics (Data as of Jan 2026)

Total residents 98
Medicare
8
8.2% of residents
Medicaid
72
73.5% of residents
Private pay or other
18
18.4% of residents
Programs & Services
Residents Group

Residents meet regularly to discuss policies, care quality, and activities

Family Member Group

Family members meet regularly to discuss policies, care quality, and activities

Active Family Council

Organized group of family members that meets regularly to discuss facility policies, resident care, and activities.

Active Resident Council

Organized group of residents that meets regularly to discuss facility policies, quality of life, and activities.

Finances and operations

Voluntary non-profit community
Home revenue
$22.6M
Operating deficit
-$7.3M
Voluntary non-profit community
Home revenue
$22.6M Rank #48 / 145Revenue — State benchmarkedThis home is ranked 48th out of 145 homes in Maryland. Shows this facility's annual revenue compared to the Maryland SNF average. Higher revenue generally means more resources for staffing and capital — read alongside Payroll %.Click the rank badge to see the full State ranking.Click here to see the full State ranking.
Operating deficit
-$7.3M
Payroll costs Info The portion of the home's budget spent on staff, including nurses, caregivers, and other employees who support care and operations. Rank #25 / 145Payroll — State benchmarkedThis home is ranked 25th out of 145 homes in Maryland. Shows total annual staff payroll benchmarked to the Maryland average. Higher payroll investment relative to peers often signals better staffing and less reliance on cheaper contract labor.Click the rank badge to see the full State ranking.Click here to see the full State ranking.
$13.6M
60.2% of revenue Rank #10 / 145Payroll % — State benchmarkedThis home is ranked 10th out of 145 homes in Maryland. Shows payroll as a percentage of revenue versus the Maryland average. Well-run Maryland SNFs typically land around 49–57% — the top third Statewide. Below 25% may signal understaffing or heavy agency use — read with Staffing ratings.Click the rank badge to see the full State ranking.Click here to see the full State ranking.
Other operating costs Info All remaining costs needed to run the home, such as food, utilities, building maintenance, supplies and administrative expenses.
$16.3M
Total costs $29.9M

What does this home offer?

Housing options icon

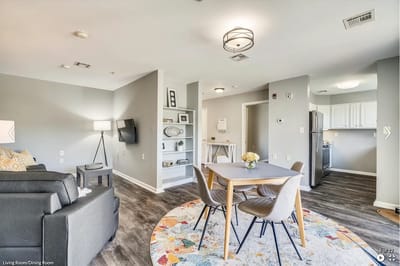
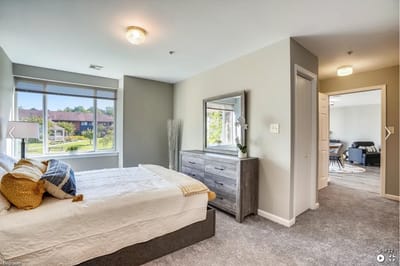
Housing Options: Studio / 1 Bed / 2 Bed

Building type icon
Building type icon

Building Type: 3-story

Dining services icon

Dining Services

Beauty services icon

Beauty Services

Transportation services icon

Transportation Services

Social and recreational activities icon

Social and Recreational Activities

Exercise program icon

Exercise Programs

Who this home usually serves

TYPE OF STAY

Mostly short-term rehab stays

Most residents typically stay for a few weeks or months before returning home or moving on.

Places of interest near Resorts of Augsburg

Address 11.7 miles from city center Info Estimated distance in miles from Baltimore's city center to Resorts of Augsburg's address, calculated via Google Maps. — 3.46 miles to nearest hospital (Dhaval Aghera, MD)

Calculate Travel Distance to Resorts of Augsburg

Add your location

Address

Financial Assistance for
Nursing Home in Maryland

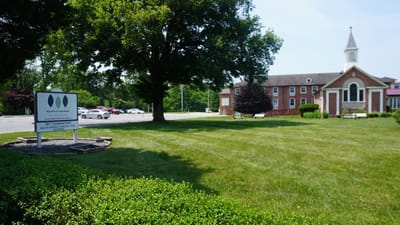
Resorts of Augsburg is located in Baltimore, Maryland.
Here are the financial assistance programs available to residents in Maryland.

Get Financial aid guidance

Community Options Waiver

Maryland Medicaid Community Options Waiver

Age 65+ or disabled
General Maryland resident, Medicaid- eligible, nursing home-level care need.
Income Limits (2025) ~$2,829/month 300% FBR, individual
Asset Limits $2,000 (individual), $3,000 (couple) (excludes home, car).
MD

High urban demand; rural outreach efforts.

Benefits
Personal care (5-7 hours/day, e.g., bathing, dressing) Respite care (up to 240 hours/year) Adult day care ($70/day) Home modifications ($1,500 avg.)

Senior Care Program

Maryland Senior Care

Age 65+
General Maryland resident, at risk of nursing home placement.
Income Limits ~$2,000/month individual, varies by county
Asset Limits $11,000 individual
MD

Limited funding; waitlists common in high-demand areas.

Benefits
In-home care (3-5 hours/week) Respite care (up to 10 days/year) Meals (~$6/meal) Transportation (~5 trips/month) Case management

Maryland Nursing Home Medicaid

Maryland Medical Assistance (Medicaid) Nursing Home Program

Age 65+
General Maryland resident, Medicaid-eligible, requires nursing home-level care.
Income Limits (2025) $943/month (individual); most income applied to care costs.
Asset Limits $2,500 (individual), $3,000 (couple); spousal protections up to $155,356.
MD

Home equity limit $636,000; estate recovery applies post-55.

Benefits
24/7 nursing care Meals Therapy Medications (unlimited per medical need)

Senior Assisted Living Subsidy Program

Maryland Senior Assisted Living Group Home Subsidy

Age 62+
General Maryland resident, in or moving to approved assisted living, low/moderate income.
Income Limits (2025) ~$34,000/year individual, varies by county
Asset Limits Not strict; prioritizes low-income.
MD

Not available statewide; facility must be licensed by MDH.

Benefits
Personal care Meals 24-hour supervision (up to $1,500/month subsidy typical)

Veterans Aid and Attendance (A&A) Benefit

Maryland VA Aid and Attendance

Age
General Wartime veteran/spouse, age 65+ or disabled, needs ADL help, Maryland resident.
Income Limits (2025) Net income minus medical expenses < $1,984/month individual with A&A
Asset Limits $155,356 net worth limit
MD

High veteran population in suburban/rural areas.

Benefits
Cash benefit ($1,478-$2,471/month, varies by status) for care costs

Senior Prescription Drug Assistance Program (SPDAP)

Maryland Senior Prescription Drug Assistance Program

Age 65+
General Maryland resident (6+ months), Medicare Part D enrolled.
Income Limits (2025) $48,560/year individual, 300% FPL
Asset Limits None specified.
MD

Supplements Medicare Part D; annual enrollment required.

Benefits
Up to $40/month premium subsidy Reducing drug costs

Medicare Savings Programs (MSP)

Maryland Medicare Savings Programs

Age 65+
General Maryland resident, Medicare Part A/B enrollee.
Income Limits (2025) $2,014/month (QMB), $2,706/month (SLMB/QI, individual).
Asset Limits $9,090 (individual), $13,630 (couple).
MD

Includes QMB, SLMB, QI categories.

Benefits
Covers premiums (up to $174.70/month Part B) Co-pays Deductibles

Community Personal Assistance Services (CPAS)

Maryland Medicaid Community Personal Assistance Services

Age 65+
General Maryland resident, Medicaid-eligible, needs ADL assistance.
Income Limits (2025) $943/month (individual); spend-down available.
Asset Limits $2,500 (individual), $3,000 (couple).
MD

Consumer-directed option allows hiring family caregivers.

Benefits
Personal care (hours vary, typically 20-30/week) Chores Nurse supervision

Compare Nursing Home around Baltimore

The information below is reported by the Maryland Department of Health, Office of Health Care Quality.

5 facilities compared · CMS & MD Dept. of Health data

Filter by care type
Sunrise of Pikesville
NH

Nursing Home Licensed facility providing 24/7 skilled nursing care for residents with complex, ongoing medical needs. Staffed by RNs, LPNs, and CNAs. Inspected and star-rated annually by CMS. Accepts Medicare (short-term rehab) and Medicaid (long-term care).

AL

Assisted Living A licensed, long-term care setting for seniors or individuals with disabilities who need help with daily activities — like bathing, dressing, and medication management — but not 24-hour skilled nursing. Offers housing, meals, and around-the-clock support while aiming to maximize resident independence.

MC

Memory Care Secured, specialized care for people living with Alzheimer's or dementia. Staff trained in cognitive impairment, with higher staff-to-resident ratios and an environment designed to reduce confusion and wandering risk.

Pikesville (Old Court Road)96 85.9% +4%3.10 -36%-18%$02121.0-88A- 75 -$18.9M$5.2M27.8%215107
Evangeline Love and Care
NH

Nursing Home Licensed facility providing 24/7 skilled nursing care for residents with complex, ongoing medical needs. Staffed by RNs, LPNs, and CNAs. Inspected and star-rated annually by CMS. Accepts Medicare (short-term rehab) and Medicaid (long-term care).

AL

Assisted Living A licensed, long-term care setting for seniors or individuals with disabilities who need help with daily activities — like bathing, dressing, and medication management — but not 24-hour skilled nursing. Offers housing, meals, and around-the-clock support while aiming to maximize resident independence.

Baltimore127 85.5% +4%3.23 -18%-14%$4.2k328.0-108- 68 Ro Holdings, LLC$27.6M$7.7M28%215233
Resorts of Augsburg
NH

Nursing Home Licensed facility providing 24/7 skilled nursing care for residents with complex, ongoing medical needs. Staffed by RNs, LPNs, and CNAs. Inspected and star-rated annually by CMS. Accepts Medicare (short-term rehab) and Medicaid (long-term care).

AL

Assisted Living A licensed, long-term care setting for seniors or individuals with disabilities who need help with daily activities — like bathing, dressing, and medication management — but not 24-hour skilled nursing. Offers housing, meals, and around-the-clock support while aiming to maximize resident independence.

IL

Independent Living Lifestyle-focused communities for older adults offering dining, activities, and transportation with minimal personal care. Best for active, independent seniors who want community without medical support.

Baltimore (Gwynn Oak)107 89.4% +9%4.17 -11%+11%$23.9k3712.3-119- 18 -$22.6M$13.6M60.2%215193
Caritas House Assisted Living
NH

Nursing Home Licensed facility providing 24/7 skilled nursing care for residents with complex, ongoing medical needs. Staffed by RNs, LPNs, and CNAs. Inspected and star-rated annually by CMS. Accepts Medicare (short-term rehab) and Medicaid (long-term care).

AL

Assisted Living A licensed, long-term care setting for seniors or individuals with disabilities who need help with daily activities — like bathing, dressing, and medication management — but not 24-hour skilled nursing. Offers housing, meals, and around-the-clock support while aiming to maximize resident independence.

Baltimore (Violetville)60 87.7% +6%3.14 +9%-17%$16.3k389.53151A- 50 Associated Catholic Charities Inc$24.8M$16.1M64.8%215044
Destiny’s Place
NH

Nursing Home Licensed facility providing 24/7 skilled nursing care for residents with complex, ongoing medical needs. Staffed by RNs, LPNs, and CNAs. Inspected and star-rated annually by CMS. Accepts Medicare (short-term rehab) and Medicaid (long-term care).

AL

Assisted Living A licensed, long-term care setting for seniors or individuals with disabilities who need help with daily activities — like bathing, dressing, and medication management — but not 24-hour skilled nursing. Offers housing, meals, and around-the-clock support while aiming to maximize resident independence.

Baltimore (Kernewood)3--4.89 +91%+30%$24.1k3511.7248- 75 ----215110

Frequently Asked Questions about Resorts of Augsburg

What neighborhood is Resorts of Augsburg in?

Resorts of Augsburg is in the Gwynn Oak neighborhood.

Is Resorts of Augsburg in a walkable area?

Resorts of Augsburg has a walk score of 18. Car-dependent. Most errands require a car, with limited nearby walkable options.

What is the address of Resorts of Augsburg?

Resorts of Augsburg is located at 6825 Campfield Rd, Baltimore, MD 21207, United States.

What is the phone number of Resorts of Augsburg?

(410) 486-4573 will put you in contact with the team at Resorts of Augsburg.

Is Resorts of Augsburg Medicare or Medicaid certified?

Yes — Resorts of Augsburg is a CMS-certified provider of Medicare and Medicaid.

Guides for Better Senior Living

Care Cost Calculator: See Prices in Your Area

Nursing Home Data Explorer

Don’t Wait Too Long: 7 Red Flag Signs Your Parent Needs Assisted Living Now

The True Cost of Assisted Living in 2025 – And How Families Are Paying For It

Understanding Senior Living Costs: Pricing Models, Discounts & Financial Assistance

Explore Open Rooms
1 Contact details
2 What type of senior care service are you looking for?
3 What budget do you have in mind for senior care?
4 How soon do you need to find care?
5 Additional details

Thank you for your interest!

Our team will be in touch shortly to help with next steps.