Explore Open Rooms
1 Contact details
2 What type of senior care service are you looking for?
3 What budget do you have in mind for senior care?
4 How soon do you need to find care?
5 Additional details

Thank you for your interest!

Our team will be in touch shortly to help with next steps.

Nursing Home in Hennepin County

CMS overall rating Info The Overall CMS Rating combines results from health inspections, staffing levels and quality measures. Health inspections carry the most weight. Staffing and quality scores can increase or decrease the final rating based on performance compared to state and national standards.

The Villas at Bryn Mawr

Overview of The Villas at Bryn Mawr

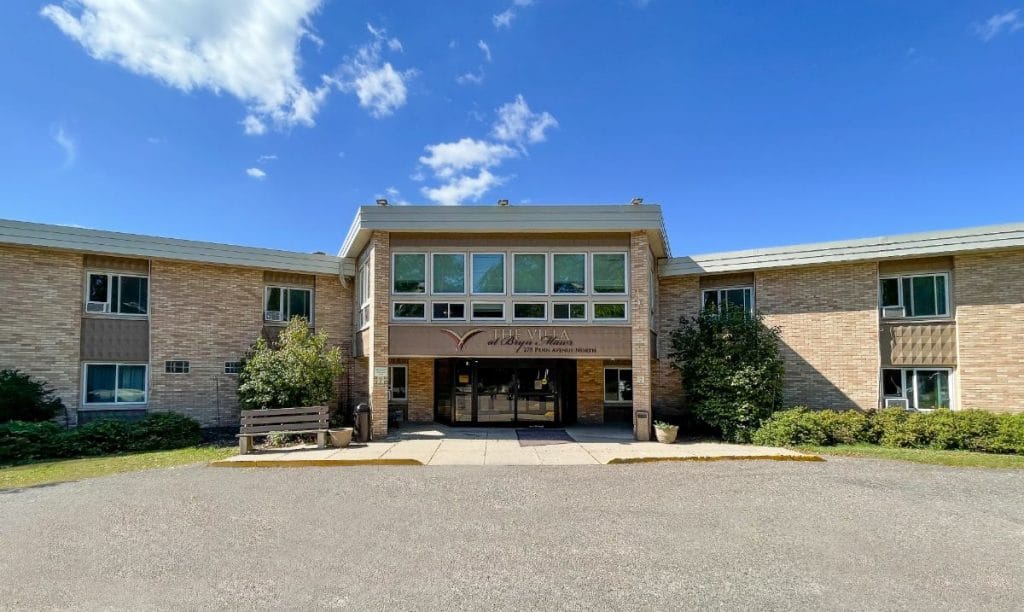
The Villas at Bryn Mawr is a leading community in Minneapolis, MN, dedicated to offering exceptional skilled nursing care and short-term rehabilitation services. They help residents living with an illness or recovering from hospitalization or injury recover their strengths and overall function to continue living their best lives. The community features a team of kind and reliable care professionals to oversee residents’ personalized care plans and ensure they are receiving daily living assistance and 24/7 supervision to maintain their comfort and well-being.

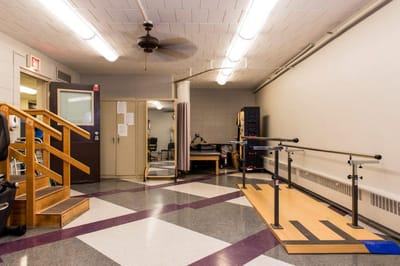
With access to physical, speech, and occupational therapy, residents here can successfully recover their strength, mobility, and skills to get back to doing the things they love. The community also partners with trusted hospice care providers to ensure residents receive compassionate end-of-life care when the time comes. At The Villas at Bryn Mawr, they strive to create a warm and welcoming environment tailored for comfort.

(484) 383-3770

Quality ratings

Measured by Centers for Medicare & Medicaid Services (CMS)

Overall rating Info The Overall CMS Rating combines results from health inspections, staffing levels and quality measures. Health inspections carry the most weight. Staffing and quality scores can increase or decrease the final rating based on performance compared to state and national standards.
1/5
Minnesota average: 3.2/5
Health Inspection Info Based on the results of the facility's three most recent standard inspections and any complaint investigations. CMS reviews the number, scope, and severity of deficiencies, with more recent findings weighted more heavily.
1/5
Minnesota average: 2.8/5
Staffing Info Measures average nursing staff hours per resident per day, including Registered Nurses (RNs) and total nursing staff. Ratings are adjusted based on the level of care residents require and are compared to state and national benchmarks.
4/5
Minnesota average: 4.1/5
Quality Measures Info Based on clinical and physical health indicators reported to CMS, such as hospital readmissions, falls, pressure ulcers, and improvements in mobility. These measures reflect how well residents' health needs are being managed.
3/5
Minnesota average: 3.1/5

Nursing care per resident

Info This shows how many total hours of nursing staff time are available per resident each day. Higher numbers usually mean more staff support.
3h 44m per day

This home provides 22% less nursing time per resident than the Minnesota average.

Minnesota average: 4h 46m per day

Staffing hours breakdown

Info Hours of care per resident per day, broken down by staff type. Data from CMS Medicare.
Staff type Facility State avg National avg
Registered Nurse (RN) Info Registered nurse hours per resident per day. 40m per day 1h 4m per day 41m per day
Nurse Aide Info Nurse aide hours per resident per day. 1h 27m per day 2h 33m per day 2h 21m per day
Total Nursing (Weekend) Info Total number of nurse staff hours per resident per day on weekends. 2h 25m per day 3h 41m per day 3h 26m per day
Physical Therapist Info Physical therapist staff hours per resident per day. 1m per day 4m per day 4m per day
RN (Weekend) Info Registered nurse hours per resident per day on weekends. 26m per day 41m per day 29m per day

Capacity and availability

Medium-capacity home

Offers a balance of services and community atmosphere.

Total beds 105

This home usually has availability

Lower occupancy suggests more openings may be available.

Lower demand than the Minnesota average
Occupancy rate 75%
Residents per day (avg) 104
Occupancy rate
75%
Residents per day (avg)
104

Who this home usually serves

TYPE OF STAY

Mix of rehab and long-term care

This home supports both short-term rehab and long-term care, with residents staying for a wide range of durations.

Breakdown by payment type

Medicare

10% of new residents, usually for short-term rehab.

Typical stay 26 days

Private pay

46% of new residents, often for short stays.

Typical stay 2 - 3 months

Medicaid

44% of new residents, often for long-term daily care.

Typical stay 9 - 10 months

Finances and operations

Privately-owned community
Home revenue
$9.8M
Operating loss
-$467.0K
Privately-owned community
Home revenue
$9.8M
Operating loss
-$467.0K
Payroll costs Info The portion of the home's budget spent on staff, including nurses, caregivers, and other employees who support care and operations.
$4.3M
43.3% of revenue
Other operating costs Info All remaining costs needed to run the home, such as food, utilities, building maintenance, supplies and administrative expenses.
$6.0M
Total costs $10.3M

What does this home offer?

Accepts Medicaid icon

Accept Medicaid: Yes

Housing options icon

Housing Options: Semi-Private Rooms

Building type icon
Building type icon

Building Type: 2-story

Dining services icon

Dining Services

Transportation services icon

Transportation Services

Housekeeping icon
Housekeeping icon

Housekeeping Services

Recreational activities icon

Recreational Activities

Types of Care at The Villas at Bryn Mawr

Nursing Home Assisted Living

Contact The Villas at Bryn Mawr

Health Inspection History

Inspections
Total health inspections 11

Minnesota average 6


Last Health inspection on Sep 2025

Total health citations 58

Minnesota average 23.2

Citations per inspection
5.27

Minnesota average 3.76


Health citations are formal notices following inspections when they fail to comply with safety and care standards.

41 of 58 citations resulted from standard inspections; 16 of 58 resulted from complaint investigations; and 1 of 58 came from combined inspections (standard and complaint).

Breakdown of citation severity (last 3 years)
Critical Health citations More info 4
471% worse than Minnesota average

Minnesota average: 0.7


Serious Health citations More info 0
100% better than Minnesota average

Minnesota average: 0.5

4 critical citations More info Minnesota average: 0.7

0 serious citations More info Minnesota average: 0.5

50 moderate citations More info Minnesota average: 21.2

4 minor citations More info Minnesota average: 0.8
Citations history (last 3 years)
Abuse/Neglect critical citation Info Issues related to protecting resident's from harm, including abuse, neglect, or mistreatment. Sep 29, 2025
Corrected

Resident Rights critical citation Info Issues related to resident's rights, including dignity, privacy, and the ability to make decisions about their care. Sep 11, 2025

Abuse/Neglect moderate citation Info Issues related to protecting resident's from harm, including abuse, neglect, or mistreatment. Jun 24, 2025
Corrected

Pharmacy moderate citation Info Issues related to medication management, including how drugs are stored, administered, and monitored. Jun 24, 2025
Corrected

Compare Nursing Homes around Hennepin County The information below is reported by the Minnesota Department of Health, Health Regulation Division.

5 facilities compared · CMS & MN Dept. of Health data · Updated Apr 2026

Filter by care type
The Villas at Robbinsdale
AL

Assisted Living A licensed, long-term care setting for seniors or individuals with disabilities who need help with daily activities — like bathing, dressing, and medication management — but not 24-hour skilled nursing. Offers housing, meals, and around-the-clock support while aiming to maximize resident independence.

NH

Nursing Home Licensed facility providing 24/7 skilled nursing care for residents with complex, ongoing medical needs. Staffed by RNs, LPNs, and CNAs. Inspected and star-rated annually by CMS. Accepts Medicare (short-term rehab) and Medicaid (long-term care).

Robbinsdale
75
88.0%
+10%
3.94
+52%
-17%
2
37
3.7
2
69
-
41
-
$9.1M
$3.6M
39.9%
245417
Lakehouse Healthcare and Rehabilitation Center
HC

Home Care Professional care delivered in the person's own home — from companionship and errands to skilled nursing and therapy. Allows seniors to age in place. Medicare covers skilled home health when medically necessary.

MC

Memory Care Secured, specialized care for people living with Alzheimer's or dementia. Staff trained in cognitive impairment, with higher staff-to-resident ratios and an environment designed to reduce confusion and wandering risk.

NH

Nursing Home Licensed facility providing 24/7 skilled nursing care for residents with complex, ongoing medical needs. Staffed by RNs, LPNs, and CNAs. Inspected and star-rated annually by CMS. Accepts Medicare (short-term rehab) and Medicaid (long-term care).

RC

Respite Care Short-term temporary care — days to weeks — to give family caregivers a break. Full care provided during the stay. Often used after hospitalization or to trial a facility before a permanent placement decision.

Minneapolis (Southwest Minneapolis)
260
80.9%
+2%
3.91
-25%
-18%
0
76
5.1
1
224
-
81
Lake Harriet Operator Holdings Llc
$22.1M
$8.9M
40.2%
245055
The Villas at Bryn Mawr
AL

Assisted Living A licensed, long-term care setting for seniors or individuals with disabilities who need help with daily activities — like bathing, dressing, and medication management — but not 24-hour skilled nursing. Offers housing, meals, and around-the-clock support while aiming to maximize resident independence.

NH

Nursing Home Licensed facility providing 24/7 skilled nursing care for residents with complex, ongoing medical needs. Staffed by RNs, LPNs, and CNAs. Inspected and star-rated annually by CMS. Accepts Medicare (short-term rehab) and Medicaid (long-term care).

Minneapolis (Harrison)
105
75.0%
-6%
3.73
-25%
-22%
1
58
5.3
4
104
-
55
-
$9.2M
$4.3M
46.2%
245203
Centennial Gardens for Nursing and Rehabilitation
-
NH

Nursing Home Licensed facility providing 24/7 skilled nursing care for residents with complex, ongoing medical needs. Staffed by RNs, LPNs, and CNAs. Inspected and star-rated annually by CMS. Accepts Medicare (short-term rehab) and Medicaid (long-term care).

Minneapolis (Bassett Creek)
85
-
-
-
-
-
-
-
-
0
0
0.0
0
-
-
32
-
-
-
-
-
Covenant Living of Golden Valley
-
AL

Assisted Living A licensed, long-term care setting for seniors or individuals with disabilities who need help with daily activities — like bathing, dressing, and medication management — but not 24-hour skilled nursing. Offers housing, meals, and around-the-clock support while aiming to maximize resident independence.

MC

Memory Care Secured, specialized care for people living with Alzheimer's or dementia. Staff trained in cognitive impairment, with higher staff-to-resident ratios and an environment designed to reduce confusion and wandering risk.

NH

Nursing Home Licensed facility providing 24/7 skilled nursing care for residents with complex, ongoing medical needs. Staffed by RNs, LPNs, and CNAs. Inspected and star-rated annually by CMS. Accepts Medicare (short-term rehab) and Medicaid (long-term care).

Golden Valley
-
-
-
-
-
-
-
-
-
0
0
0.0
0
-
-
48
-
-
-
-
-

The Villas at Bryn Mawr Reviews

Share your thoughts and experiences about The Villas at Bryn Mawr. Let’s celebrate the stories that make a difference!
Reviewer avatar
Mae Sutter
Worst place ever! I just got out of there being a patient and they only gave me a week of medications and now that we can medications is up and they are responsible for giving me more than that until a physician can go ahead and actually write scripts and if they actually have filled out the paperwork that was sent over to them to give my doctor the list of the list of pills I wouldn't be writing this review I went in there for a five toe amputation for recovery in June 29th 2024 and I got out May 29th 2025 one week's worth of medications and no other place to go except to go back there and ask them to help the men used terrible the food is repetitive the replacement meals are worse the lack of staff support is disgusting they don't answer buzzers when rooms buzzed for them they don't stop alcohol from coming into the premises they don't allow or stop cigarette smoking in rooms it just seems to be that the place really doesn't care about anything but the money and even that's not worth while paying for this place the rooms are ancient and literally run down there were no TV sets in any of the rooms unless you ask for one or you bring one in on your own you have nurses there at night who act like the gestapo and basically tell people that they have to stay in their rooms after hours after 8:00 p.m. if they can't sleep and those long as that patient isn't making any noise and isn't a problem there shouldn't be a problem but they don't care I would not recommend anybody to come to this place find something better because they will shaft you when you leave and that's what they did with me one week's worth of medications and I needed all of it and by the way they have given other people's medications to other people and literally have kept some of it not even reported to Polaris pharmacy when just continuation of a drug to a patient has stopped. The only person that actually is worthy there who does her job is Lynda social worker.What do you like most about living here? Answer: Nothing Are there enough caregivers to handle the residents' needs, especially during emergencies? Answer: No 
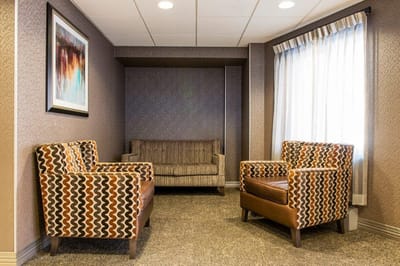
Are the common areas pleasant and comfortable for socializing or relaxing? Answer: No How would you rate the quality and variety of the meals? (1-5) Answer: 3 Are special diets handled well? Answer: No Is the dining schedule flexible enough to meet your preferences? Answer: No How do you feel about the level of social interaction available with other residents? Answer: Women are not allowed in men's rooms and men are not allowed in women's rooms and literally the socialization is cut short at 8:00 at night depending on the nurse and most of the time you really can't socialize after that hour outside your room because people are trying to sleep the nurses are lazy and into their phones and watching shows on their phones and literally locking down doors too soon and don't accept food deliveries after 7:00 p.m. and literally kick out any visitors before dinner How was the units offered in this community? Answer: Too many patients are not able to be psychologically sound Do you feel safe living in this community? Answer: No How well do you think the community handles emergencies or unexpected events? Answer: Fire alarms go off nobody gets basically to practice the exit routine Are there any hidden fees or unexpected charges? Answer: I wouldn't be surprised if there are Would you recommend this community to others looking for senior living options? Answer: No put your loved ones someplace else Is there anything you wish you knew before moving in? Answer: Yeah wished I never saw the place

Places of interest near The Villas at Bryn Mawr

Address 3.3 miles from city center

Calculate Travel Distance to The Villas at Bryn Mawr

Add your location

Address

Staffing Data (Q2 2025)

This data corresponds to Q2 2025 and is based on CMS Payroll-Based Journal.

Total staff 108
Employees 84
Contractors 24
Staff to resident ratio 1.05:1
53% worse than Minnesota average

Minnesota average ratio: 2.22:1

Avg staff/day 36
Average shift 8.7 hours
16% better than Minnesota average

Minnesota average: 7.5 hours

Total staff hours (quarter) 28,585
Nursing staff breakdown
Registered Nurse

Manages medical care and health needs.

Total count 11
Average shift length Info Average shift length. Calculated as total hours divided by days worked and average staff per day. 10.9 hours

This role is partially covered by contractors.

Licensed Practical Nurse

Assists with medical care and medications.

Total count 11
Average shift length Info Average shift length. Calculated as total hours divided by days worked and average staff per day. 10.8 hours

No contractors work on this role.

Certified Nursing Assistant

Helps with daily care and mobility.

Total count 26
Average shift length Info Average shift length. Calculated as total hours divided by days worked and average staff per day. 9 hours

No contractors work on this role.

Contractor staffing

Total hours from contractors

5.5%

1,576 contractor hours this quarter

Physical Therapy Aide: 5 Qualified Social Worker: 4 Physical Therapy Assistant: 4 RN Director of Nursing: 3 Respiratory Therapy Technician: 3 Registered Nurse: 1 Clinical Nurse Specialist: 1 Speech Language Pathologist: 1 Occupational Therapy Assistant: 1 Medical Director: 1
Staff by category
Certified Nursing Assistant260268,49991100%9
Registered Nurse101114,86191100%10.9
Licensed Practical Nurse110114,68891100%10.8
Medication Aide/Technician8083,88991100%9.7
Other Dietary Services Staff4041,0036774%5.4
Clinical Nurse Specialist5169296673%7.9
Diagnostic X-ray Services Staff5058896875%7.6
Nurse Practitioner2026456066%7.7
RN Director of Nursing1345497077%7.8
Dental Services Staff3034895965%7.7
Administrator1014806470%7.5
Respiratory Therapy Technician0334436268%7.1
Speech Language Pathologist0113536268%5.7
Physical Therapy Assistant0442654752%5.5
Occupational Therapy Aide2021914549%4.2
Nurse Aide in Training6061722224%6.6
Qualified Social Worker0441553943%3.8
Occupational Therapy Assistant0113578%5
Medical Director0112733%9
Physical Therapy Aide055241112%2
26 Certified Nursing Assistant
% of Days 100%
11 Registered Nurse
% of Days 100%
11 Licensed Practical Nurse
% of Days 100%
8 Medication Aide/Technician
% of Days 100%
4 Other Dietary Services Staff
% of Days 74%
6 Clinical Nurse Specialist
% of Days 73%
5 Diagnostic X-ray Services Staff
% of Days 75%
2 Nurse Practitioner
% of Days 66%
4 RN Director of Nursing
% of Days 77%
3 Dental Services Staff
% of Days 65%
1 Administrator
% of Days 70%
3 Respiratory Therapy Technician
% of Days 68%
1 Speech Language Pathologist
% of Days 68%
4 Physical Therapy Assistant
% of Days 52%
2 Occupational Therapy Aide
% of Days 49%
6 Nurse Aide in Training
% of Days 24%
4 Qualified Social Worker
% of Days 43%
1 Occupational Therapy Assistant
% of Days 8%
1 Medical Director
% of Days 3%
5 Physical Therapy Aide
% of Days 12%

Facility Characteristics

Source: CMS Long-Term Care Facility Characteristics (Data as of Jan 2026)

Total census
103 residents
Residents by payment source
Medicare
1 resident (1%)
Medicaid
94 residents (91.3%)
Private pay or other
8 residents (7.8%)
Programs & Services
Residents' Group

Residents meet regularly to discuss policies, care quality, and activities

Nurse Aide Training

State-approved Nurse Aide Training and Competency Evaluation Program on-site

Active Resident Council

Organized group of residents that meets regularly to discuss facility policies, quality of life, and activities.

Quality of care over time

These measures show how residents usually do over time at this home, based on health outcomes and preventive care.

High-risk clinical events score Info A composite score based on pressure ulcers, falls with injury, weight loss, walking ability decline, and activities of daily living decline. 5.5
50% better than Minnesota average

Minnesota average: 11.1

Functional decline score Info A composite score based on activities of daily living decline, walking ability decline, and incontinence. 8.5
62% better than Minnesota average

Minnesota average: 22.6

Long-stay resident measures
Above average Minnesota avg: 2.9 Info CMS star rating based on long-stay quality measure performance. 5 stars = significantly above average, 1 star = significantly below average.
Need for Help with Daily Activities Increased Info Percent of long-stay residents whose need for help with daily activities has increased 12.5%
34% better than Minnesota average

Minnesota average: 18.9%

Walking Ability Worsened Info Percent of long-stay residents whose ability to move independently worsened 5.4%
77% better than Minnesota average

Minnesota average: 23.8%

Low Risk Residents with Bowel/Bladder Incontinence Info Percent of low risk long-stay residents who lose control of their bowels or bladder 7.6%
70% better than Minnesota average

Minnesota average: 25.0%

Falls with Major Injury Info Percent of long-stay residents experiencing one or more falls with major injury 3.8%
In line with Minnesota average

Minnesota average: 3.7%

High Risk Residents with Pressure Ulcers Info Percent of long-stay high risk residents with pressure ulcers 2.3%
57% better than Minnesota average

Minnesota average: 5.4%

Urinary Tract Infection Info Percent of long-stay residents with a urinary tract infection 0.9%
65% better than Minnesota average

Minnesota average: 2.7%

Lost Too Much Weight Info Percent of long-stay residents who lose too much weight 3.7%
11% better than Minnesota average

Minnesota average: 4.1%

Depressive Symptoms Info Percent of long-stay residents who have depressive symptoms 15.6%
259% worse than Minnesota average

Minnesota average: 4.4%

Antipsychotic Use Info Percent of long-stay residents who received an antipsychotic medication 26.0%
51% worse than Minnesota average

Minnesota average: 17.2%

Pneumococcal Vaccine Info Percent of long-stay residents assessed and appropriately given the pneumococcal vaccine 95.3%
In line with Minnesota average

Minnesota average: 97.3%

Influenza Vaccine Info Percent of long-stay residents assessed and appropriately given the seasonal influenza vaccine 95.4%
In line with Minnesota average

Minnesota average: 96.0%

Hospitalizations per 1,000 days Info Number of hospitalizations per 1,000 long-stay resident days. 1.65
In line with Minnesota average

Minnesota average: 1.67

ED visits per 1,000 days Info Number of outpatient emergency department visits per 1,000 long-stay resident days. 2.33
17% worse than Minnesota average

Minnesota average: 1.99

Short-stay resident measures
Pneumococcal Vaccine Info Percent of short-stay residents assessed and appropriately given the pneumococcal vaccine 73.7%
17% worse than Minnesota average

Minnesota average: 88.9%

Antipsychotic medication increase Info Percent of short-stay residents who newly received an antipsychotic medication 5.5%
186% worse than Minnesota average

Minnesota average: 1.9%

Influenza Vaccine Info Percent of short-stay residents assessed and appropriately given the seasonal influenza vaccine 57.1%
31% worse than Minnesota average

Minnesota average: 82.6%

Successful return to home or community Info Rate of successful return to home or community from a skilled nursing facility. 41.2%
18% worse than Minnesota average

Minnesota average: 50.6%

Penalties and fines

Federal penalties imposed by CMS for regulatory violations, including civil money penalties (fines) and denials of payment for new Medicare/Medicaid admissions.

Source: CMS Penalties Database (Data as of Jan 2026)

Total fines amount $35K
21% lower than Minnesota average

Minnesota average: $44K

Number of fines 1
50% fewer fines than Minnesota average

Minnesota average: 2.0

Payment Denials Info Serious action where Medicare and/or Medicaid temporarily stops payments for new residents until issues are fixed. 0
100% fewer payment denials than Minnesota average

Minnesota average: 0.4

Fines amount comparison
This facility $35K
Minnesota average $44K
Penalty History

Penalties are imposed by CMS for violations of federal nursing home regulations.

Civil Money Penalty Info Fines imposed for noncompliance, which can be assessed per day or per instance of violation. Aug 12, 2024
$35K

Last updated: Jan 2026

Guides for Better Senior Living

Care Cost Calculator: See Prices in Your Area

Nursing Home Data Explorer

Don’t Wait Too Long: 7 Red Flag Signs Your Parent Needs Assisted Living Now

The True Cost of Assisted Living in 2025 – And How Families Are Paying For It

Understanding Senior Living Costs: Pricing Models, Discounts & Financial Assistance

Financial Aid for Minnesota Seniors

Get financial aid guidance

Elderly Waiver

Minnesota Medicaid EW

Age 65+, Minnesota resident, Medicaid-eligible, nursing home-level care need.

~$2,829/month (300% FBR, individual).

$3,000 (individual, higher than most states).

Higher asset limit; rural access focus.

Essential Community Supports (ECS)

Minnesota ECS

Age 65+, Minnesota resident, at risk of decline but not nursing home level.

~$1,732/month (individual, varies).

$3,000 (individual).

Bridges gap for those ineligible for waivers.

Alternative Care (AC) Program

Minnesota Alternative Care Program

Age 65+, Minnesota resident, NFLOC, not MA-eligible.

~$1,255-$2,829/month (100%-300% FPL); sliding scale copays.

$3,000 (individual); home equity limit $713,000.

CDCS option; statewide via counties.

Minnesota Senior Health Options (MSHO)

Minnesota Senior Health Options

Age 65+, Minnesota resident, eligible for MA and Medicare Parts A/B.

~$1,255/month (100% FPL for MA); spenddown allowed.

$3,000 (individual), $6,000 (couple).

7 health plans (e.g., UCare, HealthPartners); care coordinator assigned.

Minnesota Senior Care Plus (MSC+)

Minnesota Senior Care Plus

Age 65+, Minnesota resident, MA-eligible, not on Medicare.

~$1,255/month (100% FPL); spenddown allowed.

$3,000 (individual), $6,000 (couple).

Includes EW services; 7 health plans available.

Consumer Support Grant (CSG)

Minnesota Consumer Support Grant

Age 65+ or disabled, Minnesota resident, eligible for MA personal care but opts for grant.

~$1,255/month (MA-eligible); spenddown allowed.

$3,000 (individual).

Can hire family; statewide via counties.

Medicare Savings Program (MSP)

Minnesota Medicare Savings Program

Age 65+ or disabled, Minnesota resident, Medicare Part A/B.

~$2,510/month (QMB), ~$3,380/month (SLMB), ~$3,598/month (QI)—individual.

$9,430 (individual), $14,130 (couple).

Three tiers; no waitlist; includes Extra Help for Part D.

VA Aid and Attendance (A&A) and Housebound Benefits

Minnesota VA Aid and Attendance/Housebound

Age 65+ or disabled veteran/spouse, Minnesota resident, wartime service, need for ADL help (A&A) or homebound.

Net income < ~$1,984/month (veteran with dependent, A&A); pension offsets income.

~$155,356 (net worth limit).

High veteran demand in rural/urban areas.

Tour Icon
Planning a tour? Check our touring checklist.
Chat Icon
Thinking of living here? We can help you speak to a current resident