Brookdale Denton North
Nursing Home & Assisted Living · Texas, TX
CMS overall rating Info CMS (the Centers for Medicare & Medicaid Services) is the federal agency that rates nursing home quality. Its Overall Rating runs from 1 to 5 stars, combining health inspections, staffing, and quality measures, with inspections weighted most heavily.

Brookdale Denton North

Nursing Home & Assisted Living · Texas, TX
CMS overall rating Info CMS (the Centers for Medicare & Medicaid Services) is the federal agency that rates nursing home quality. Its Overall Rating runs from 1 to 5 stars, combining health inspections, staffing, and quality measures, with inspections weighted most heavily.
Calculator: See prices in your area
Brookdale Denton North accepts Medicare, Medicaid, and private pay.

Overview of Brookdale Denton North

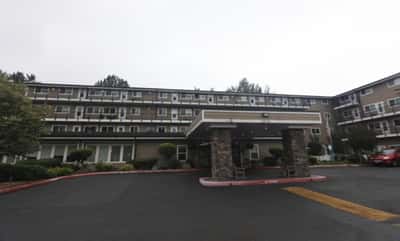
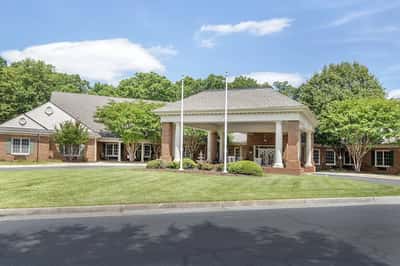
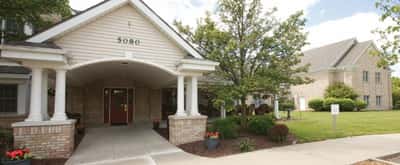
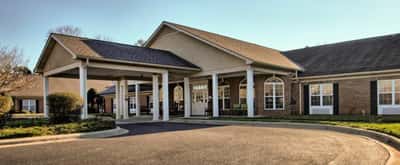
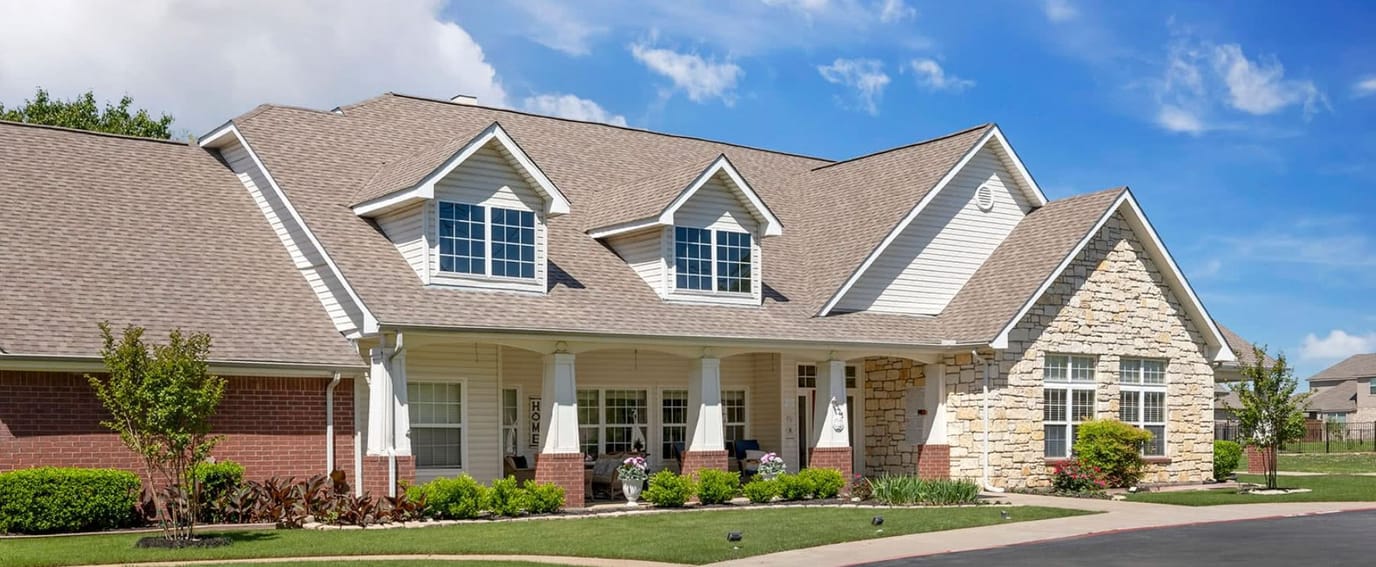
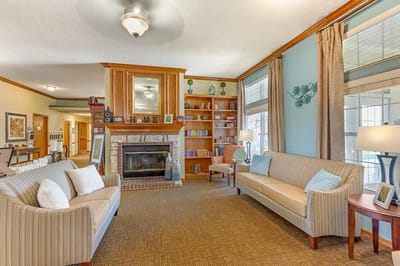
Brookdale Denton North on Hinkle Drive provides an exceptional assisted senior living experience. The home strives to enhance the quality of life of seniors who need quality assistance. It offers options that cater to each individual’s needs. Brookdale Denton North guarantees a resident-centered atmosphere for seniors, promoting a comfortable living situation.

The lifestyle at Brookdale is designed to make life safe and convenient for everyone. Its all-inclusive amenities and services include spacious common areas, recreational rooms, housekeeping, and transportation services. Management prides itself on its approach to modern assisted living care, which is unparalleled thanks to its remarkable care staff, which never fails to offer compassionate care.

(940) 566-7054

Quality ratings

Measured by Centers for Medicare & Medicaid Services (CMS)

Overall rating Info The Overall CMS Rating combines results from health inspections, staffing levels and quality measures. Health inspections carry the most weight. Staffing and quality scores can increase or decrease the final rating based on performance compared to state and national standards.
▼ 28.4% Below TX avg. ▼ 28.4% Below TX avg.TX average: 2.8Click the badge to see the full State ranking.Click here to see the full State ranking.
Health Inspection Info Based on the results of the facility's three most recent standard inspections and any complaint investigations. CMS reviews the number, scope, and severity of deficiencies, with more recent findings weighted more heavily.
▼ 27.6% Below TX avg. ▼ 27.6% Below TX avg.TX average: 2.8Click the badge to see the full State ranking.Click here to see the full State ranking.
Staffing Info Measures average nursing staff hours per resident per day, including Registered Nurses (RNs) and total nursing staff. Ratings are adjusted based on the level of care residents require and are compared to state and national benchmarks.
▲ 88.5% Above TX avg. ▲ 88.5% Above TX avg.TX average: 2.1Click the badge to see the full State ranking.Click here to see the full State ranking.
Quality Measures Info Based on clinical and physical health indicators reported to CMS, such as hospital readmissions, falls, pressure ulcers, and improvements in mobility. These measures reflect how well residents' health needs are being managed.
▲ 6.5% Above TX avg. ▲ 6.5% Above TX avg.TX average: 3.8Click the badge to see the full State ranking.Click here to see the full State ranking.

Staffing hours breakdown

Info Daily nursing hours per resident by staff type, reported to CMS. Higher is generally better — compare this facility to state and national averages to see where staffing stands.

Hours per resident per day — compared to Texas state averages

Total nursing care / resident Info This home is ranked 56th out of 296 homes in Texas for nurse hours. Total adjusted nursing hours per resident per day, combining RN, LPN, and aide time. CMS adjusts this for case-mix so facilities can be fairly compared.
4h 20m per day
Rank #56 / 296Nurse hours — State benchmarkedThis home is ranked 56th out of 296 homes in Texas. Shows adjusted nurse hours per resident per day benchmarked to the Texas average, with a ranking across 296 Texas facilities. More hours mean more direct care. The national average is about 3.5 hrs; below 3.0 is a red flag.Rankings are based only on facilities in Texas that report data for that category. Facilities without available data are excluded from the ranking.Click the rank badge to see the full State ranking.Click here to see the full State ranking.
This facility Texas avg (3h 38m per day)
vs Texas avg
+19%

1 of 6 metrics below state avg

Standout metric Weekend RN is +196% above state avg
Staff typeHours / Day / Residentvs state avg
Registered Nurse (RN) Info RNs hold the highest nursing license and can assess residents, interpret test results, and direct care plans. More RN hours per day often signals stronger clinical oversight and faster response to health changes. 51m per day ▲ 99% State avg: 25m per day · National avg: 41m per day
LPN / LVN Info Licensed Practical Nurses (LPNs) or Licensed Vocational Nurses (LVNs) deliver routine hands-on care — medication administration, wound dressing, and monitoring vital signs. They work under RN supervision and make up a large share of daily bedside care. 1h 9m per day ▲ 21% State avg: 57m per day · National avg: 52m per day
Nurse Aide Info Certified Nurse Aides (CNAs) provide the most direct day-to-day assistance: bathing, dressing, feeding, and mobility. Nurse aide hours are typically the largest staffing category and directly affect residents' quality of life. 1h 51m per day ▼ 9% State avg: 2h 1m per day · National avg: 2h 20m per day
Weekend Total Nursing Info Combined nursing hours (RN + LPN + Nurse Aide) per resident per day on weekends. Staffing often drops on weekends — this figure reveals whether the facility maintains adequate coverage outside of weekday hours. 3h 38m per day ▲ 21% State avg: 3h 0m per day · National avg: 3h 27m per day
Physical Therapist Info Hours per resident per day provided by licensed Physical Therapists (PTs) or PT Assistants. PT services help residents recover mobility after injury or illness and are especially important for post-acute (short-stay) rehabilitation. 7m per day ▲ 81% State avg: 4m per day · National avg: 4m per day
Weekend RN Info Registered nurse hours specifically on weekends. Facilities sometimes reduce RN presence on Saturdays and Sundays — a low weekend RN figure compared to weekday hours can indicate reduced clinical oversight when most administrative staff are absent. 59m per day ▲ 196% State avg: 20m per day · National avg: 29m per day

Capacity and availability

Avg. Length of Stay
49 days
Bed community size
60-bed community Rank #583 / 988Bed count — State benchmarkedThis home is ranked 583rd out of 988 homes in Texas. Shows this facility's certified or reported bed count compared to other Texas facilities. Larger communities may offer more amenities, programs, and on-site services for residents and families.Rankings are based only on facilities in Texas that report data for that category. Facilities without available data are excluded from the ranking.Click the rank badge to see the full State ranking.Click here to see the full State ranking.
A moderately sized community that may balance personal attention with shared amenities and social activities.
Years in operation
48 years in operation Rank #46 / 583Years in operation — State benchmarkedThis home is ranked 46th out of 583 homes in Texas. Shows how long this facility has been in operation compared to other Texas facilities. Longer operating histories may benefit residents, families, and staff.Rankings are based only on facilities in Texas that report data for that category. Facilities without available data are excluded from the ranking.Click the rank badge to see the full State ranking.Click here to see the full State ranking.
A longer operating history, which may indicate experience navigating regulations and delivering ongoing care.
Walk Score
Walk Score: 44 / 100 Rank #647 / 1391Walk Score — State benchmarkedThis home is ranked 647th out of 1391 homes in Texas. Shows how walkable this facility's neighborhood is compared to the average Walk Score across Texas facilities. Higher scores benefit residents, families, and staff.Rankings are based only on facilities in Texas that report data for that category. Facilities without available data are excluded from the ranking.Click the rank badge to see the full State ranking.Click here to see the full State ranking.
Somewhat walkable. A few nearby services may be reachable on foot, but most trips require transportation.
BBB Rating
BBB Rating: A+ (Not Accredited)
An independent rating from the Better Business Bureau based on factors such as complaint history, transparency, and business practices.
How BBB ratings work

About this community

Occupancy

Occupancy rate
80%
Rank #75 / 304Occupancy rate — State benchmarkedThis home is ranked 75th out of 304 homes in Texas. Shows this facility's occupancy rate versus the Texas average, with its Statewide rank out of 304. Higher occupancy signals strong local demand and financial stability.Rankings are based only on facilities in Texas that report data for that category. Facilities without available data are excluded from the ranking.Click the rank badge to see the full State ranking.Click here to see the full State ranking.
Higher than the Texas average: 63.5%
Occupied beds
48 / 60
Average occupied beds in Texas homes 75 beds

License Details

Facility TypeType B
StatusLicensed
ExpirationJanuary 12, 2026 Expired
CountyDenton
License Number146573
Year Opened4/13/2018

Ownership & Operating Entity

Brookdale Denton North is legally operated by Febc-alt Holdings, Inc., and administered by Kathy Hamilton.

OwnerFEBCALT HOLDINGS, INC
Ownership TypeFOR-PROFIT CORPORATION

Safety & Compliance

Wheelchair Accessible
Emergency SystemsYes
Safety FeaturesEmergency Alert System

Staffing

Key information about the people who lead and staff this community.

Leadership

ContactMs. Denise Warren, Interim CEO
Administrator Email[email protected]

Therapy & Rehabilitation

1 service
Respite Care

Staffing & Medical

2 services
Licensed Nurses/CNAs
24-Hour Staffing

Memory & Specialized Care

1 service
No Alzheimer's certification

Additional Policies & Features

HousekeepingYes

Amenities & Lifestyle

Pet Friendly
Library
Beauty/Barber Shop
Courtyard And Garden
Gardening / Greenhouse
Private Dining Room
Landscaped Grounds
Whirlpool
Meeting Rooms
Pharmacy
Piano
Activitiesfitness classes, trivia nights, group outings
Specific ProgramsContinuing Care Retirement Communities, At Home Care
Touring HoursMon - Fri: 8am - 9pm CT / Sat: 9am - 5:30pm CT

Pricing & Financial Information

Starting Price$4,150 per month

Dining & Nutrition

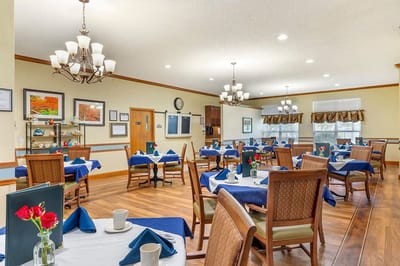
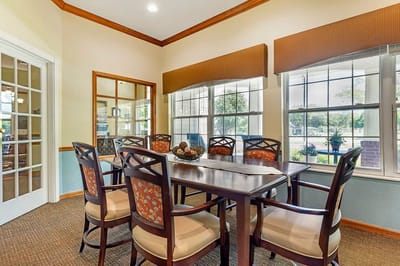
Food DescriptionThree restaurant-style meals are prepared each day and shared in the group dining room.
Brookdale Denton North – Menu
Download Menu PDF

Contact Brookdale Denton North

Inspection History

In Texas, the Health and Human Services Commission (HHSC) is the primary regulatory body that conducts unannounced inspections and publishes quality reports for all long-term care homes.

Since 2022 · 4 years of data 16 citations 2 inspections

Inspection Scorecard Info This scorecard compares key inspection, citation, and complaint metrics at this facility against the Texas state average. Metrics rated ≥15% worse than average are highlighted in red; those ≥15% better are highlighted in green.

Since 2022 vs. Texas state average
Overall vs. TX average 5 Worse Metrics worse than Texas average:
• Total citations (167% above)
• Health citations (50% above)
• Life safety citations (117% above)
• Citations per year (167% above)
• Inspections with citations (100% above)
0 Better No metrics in this bucket.
Latest Inspection September 9, 2022 Other An inspection that falls outside standard annual surveys and formal complaint investigations. May include administrative compliance checks, documentation reviews, focused surveys on specific concerns, or revisit surveys to verify prior corrections.

Citations Info Citations are formal regulatory issues recorded during state inspections.

This FacilityTX Averagevs. TX Avg
Total citations Info Formal regulatory issues recorded by inspectors across all inspection types. 166 This facility has 167% more total citations than a typical Texas assisted living residence (16 vs. TX avg 6).↑ 167% worse
Health citations Info Violations related to resident care, clinical practices, and day-to-day operations. 32 This facility has 50% more health citations than a typical Texas assisted living residence (3 vs. TX avg 2).↑ 50% worse
Life safety citations Info Violations related to building safety — fire prevention, emergency egress, and similar. 136 This facility has 117% more life safety citations than a typical Texas assisted living residence (13 vs. TX avg 6).↑ 117% worse
Citations per year Info Average citations per year since 2022. 41.5 This facility has 167% more citations per year than a typical Texas assisted living residence (4 vs. TX avg 1.5).↑ 167% worse

Inspections Info State inspections evaluate whether the facility meets health and safety standards.

This FacilityTX Averagevs. TX Avg
Inspections with citations Info Inspections that resulted in at least one regulatory citation. 21 This facility has 100% more inspections with citations than a typical Texas assisted living residence (2 vs. TX avg 1).↑ 100% worse

Inspection Reports Summary Info An editor-reviewed summary of the themes and findings across this facility's recent inspection reports.

  • BROOKDALE DENTON NORTH underwent a comprehensive inspection on September 09, 2022, resulting in 16 state standard violations. The Health Code deficiencies included failing to search the National Accreditation Recognition (NAR) and Electronic Medical Record (EMR) annually, as well as procuring food from unacceptable sources or mishandling spoiled food. These issues were corrected by October 15, 2022. The Life Safety Code deficiencies, which spanned multiple inspections between August 26, 2019, and September 09, 2022, pertained to fire safety, building maintenance, and resident care. Issues included non-compliance with NFPA 101, smoking regulations, hazardous area construction, exit signs, fire alarm systems, sprinkler system inspection, lighting levels, portable fire extinguishers, and commercial range hood installation. No enforcement actions were found in relation to these violations.

Health Inspection History

Inspections since 2023
Total health inspections 3

State average 7.4


Last Health inspection on Sep 2025

Total health citations
23 Rank #172 / 299Health citations — State benchmarkedThis home is ranked 172nd out of 299 homes in Texas. Shows this facility's total health deficiency citations benchmarked to the Texas State average, with a ranking across all 299 TX facilities. Lower citation counts earn a better rank.Rankings are based only on facilities in Texas that report data for that category. Facilities without available data are excluded from the ranking.Click the rank badge to see the full State ranking.Click here to see the full State ranking.

State average 25.9

Citations per inspection
7.67 Rank #297 / 299Citations per inspection — State benchmarkedThis home is ranked 297th out of 299 homes in Texas. Shows average deficiency citations per CMS inspection for this facility versus the Texas mean across 299 facilities with citation data. Lower is better.Rankings are based only on facilities in Texas that report data for that category. Facilities without available data are excluded from the ranking.Click the rank badge to see the full State ranking.Click here to see the full State ranking.

State average 3.67


Health citations are formal notices following inspections when they fail to comply with safety and care standards.

15 of 23 citations resulted from standard inspections; and 8 of 23 came from combined inspections (standard and complaint).

Breakdown of citation severity (last 3 years)
Critical health citations
0
100% better than State average

State average: 2


Serious health citations
0
100% better than State average

State average: 0.4

0 critical citations State average: 2

0 serious citations State average: 0.4

23 moderate citations State average: 23

0 minor citations State average: 0.4
Citations history (last 3 years)
Infection Control moderate citation Sep 19, 2025

Nutrition moderate citation Sep 19, 2025

Pharmacy moderate citation Sep 19, 2025

Pharmacy moderate citation Sep 19, 2025

Staffing Data

Reporting period: October 1 – December 31, 2025 (Q4 2025). Source: CMS Payroll-Based Journal report.

Total staff 85
Employees 81
Contractors 4
Staff to resident ratio 1.27 : 1
14% fewer staff per resident than Texas average
Texas average ratio: 1.48 : 1 Texas average ratio: 1.48 : 1See full Texas ranking
Avg staff/day 35
Average shift 7.9 hours
0% compared with Texas average
Texas average: 8.1 hours Texas average shift: 8.1 hoursSee full Texas ranking
Total staff hours (quarter) 25,580

Nursing staff breakdown

Q4 2025 · Oct 1 – Dec 31 More info This data comes from the CMS Payroll-Based Journal report covering October 1 – December 31, 2025.
Registered Nurse

Manages medical care and health needs.

RN Staff Info All 14 RN Staff are full-time employees. No contractors work on this role. 14
Average shift length Info Average shift length. Calculated as total hours divided by days worked and average staff per day. 9.3 hours
Licensed Practical Nurse

Assists with medical care and medications.

LPN Staff Info All 13 LPN Staff are full-time employees. No contractors work on this role. 13
Average shift length Info Average shift length. Calculated as total hours divided by days worked and average staff per day. 8.3 hours
Certified Nursing Assistant

Helps with daily care and mobility.

CNA Staff Info All 26 CNA Staff are full-time employees. No contractors work on this role. 26
Average shift length Info Average shift length. Calculated as total hours divided by days worked and average staff per day. 8 hours

Contractor staffing

Q4 2025 · Oct 1 – Dec 31 More info This data comes from the CMS Payroll-Based Journal report covering October 1 – December 31, 2025.

Total hours from contractors

0.5%

130 contractor hours this quarter

Feeding Assistant: 2 Medical Director: 1 Occupational Therapy Assistant: 1

Staff by category

Q4 2025 · Oct 1 – Dec 31 More info This data comes from the CMS Payroll-Based Journal report covering October 1 – December 31, 2025.
Certified Nursing Assistant260268,35092100%8
Licensed Practical Nurse130134,47392100%8.3
Registered Nurse140144,02992100%9.3
RN Director of Nursing4041,6187986%8
Medication Aide/Technician5051,4439199%8.6
Physical Therapy Aide2028816975%7.5
Respiratory Therapy Technician3036427582%7
Speech Language Pathologist2025196773%7.7
Mental Health Service Worker1014966267%8
Qualified Social Worker2024796368%7.5
Nurse Practitioner1014565762%8
Dietitian1014335661%7.7
Administrator1014165257%8
Dental Services Staff1013896166%6.4
Other Dietary Services Staff1013075358%5.8
Physical Therapy Assistant3032655257%4.5
Occupational Therapy Aide1012566470%4
Feeding Assistant022782628%2
Medical Director011281415%2
Occupational Therapy Assistant0112433%8
26 Certified Nursing Assistant
% of Days 100%
13 Licensed Practical Nurse
% of Days 100%
14 Registered Nurse
% of Days 100%
4 RN Director of Nursing
% of Days 86%
5 Medication Aide/Technician
% of Days 99%
2 Physical Therapy Aide
% of Days 75%
3 Respiratory Therapy Technician
% of Days 82%
2 Speech Language Pathologist
% of Days 73%
1 Mental Health Service Worker
% of Days 67%
2 Qualified Social Worker
% of Days 68%
1 Nurse Practitioner
% of Days 62%
1 Dietitian
% of Days 61%
1 Administrator
% of Days 57%
1 Dental Services Staff
% of Days 66%
1 Other Dietary Services Staff
% of Days 58%
3 Physical Therapy Assistant
% of Days 57%
1 Occupational Therapy Aide
% of Days 70%
2 Feeding Assistant
% of Days 28%
1 Medical Director
% of Days 15%
1 Occupational Therapy Assistant
% of Days 3%

Penalties and fines

Federal penalties imposed by CMS for regulatory violations, including civil money penalties (fines) and denials of payment for new Medicare/Medicaid admissions.

Source: CMS Penalties Database

No penalties in the past 3 years

No civil money penalties or payment denials were reported in the last 3 years.

Quality of care over time

These measures show how residents usually do over time at this home, based on health outcomes and preventive care.

High-risk clinical events score Info A composite score based on pressure ulcers, falls with injury, weight loss, walking ability decline, and activities of daily living decline. 10.4
21% worse than Texas average

Texas average: 8.6

Functional decline score Info A composite score based on activities of daily living decline, walking ability decline, and incontinence. 22.6
41% worse than Texas average

Texas average: 16.0

Long-stay resident measures
Need for Help with Daily Activities Increased Info Percent of long-stay residents whose need for help with daily activities has increased 17.6%
9% worse than Texas average

Texas average: 16.2%

Walking Ability Worsened Info Percent of long-stay residents whose ability to move independently worsened 24.8%
53% worse than Texas average

Texas average: 16.2%

Low Risk Residents with Bowel/Bladder Incontinence Info Percent of low risk long-stay residents who lose control of their bowels or bladder 25.5%
63% worse than Texas average

Texas average: 15.7%

Falls with Major Injury Info Percent of long-stay residents experiencing one or more falls with major injury 3.6%
11% worse than Texas average

Texas average: 3.2%

High Risk Residents with Pressure Ulcers Info Percent of long-stay high risk residents with pressure ulcers 3.5%
22% better than Texas average

Texas average: 4.4%

Urinary Tract Infection Info Percent of long-stay residents with a urinary tract infection 1.5%
84% worse than Texas average

Texas average: 0.8%

Lost Too Much Weight Info Percent of long-stay residents who lose too much weight 2.7%
21% better than Texas average

Texas average: 3.5%

Depressive Symptoms Info Percent of long-stay residents who have depressive symptoms 0.0%
100% better than Texas average

Texas average: 2.9%

Antipsychotic Use Info Percent of long-stay residents who received an antipsychotic medication 3.6%
55% better than Texas average

Texas average: 7.9%

Pneumococcal Vaccine Info Percent of long-stay residents assessed and appropriately given the pneumococcal vaccine 100.0%
In line with Texas average

Texas average: 97.3%

Influenza Vaccine Info Percent of long-stay residents assessed and appropriately given the seasonal influenza vaccine 100.0%
In line with Texas average

Texas average: 97.9%

Short-stay resident measures
Pneumococcal Vaccine Info Percent of short-stay residents assessed and appropriately given the pneumococcal vaccine 95.1%
5% better than Texas average

Texas average: 90.4%

Antipsychotic medication increase Info Percent of short-stay residents who newly received an antipsychotic medication 1.3%
12% better than Texas average

Texas average: 1.4%

Influenza Vaccine Info Percent of short-stay residents assessed and appropriately given the seasonal influenza vaccine 88.0%
In line with Texas average

Texas average: 88.0%

Breakdown by payment type

Medicare

33% of new residents, usually for short-term rehab.

Typical stay 25 days

Private pay

65% of new residents, often for short stays.

Typical stay 2 - 3 months

Medicaid

2% of new residents, often for long-term daily care.

Typical stay 2 - 3 years

Facility Characteristics

Source: CMS Long-Term Care Facility Characteristics (Data as of Jan 2026)

Total residents 67
Medicare
29
43.3% of residents
Medicaid
24
35.8% of residents
Private pay or other
14
20.9% of residents
Programs & Services
Residents Group

Residents meet regularly to discuss policies, care quality, and activities

CCRC

Part of a Continuing Care Retirement Community offering multiple care levels

Active Resident Council

Organized group of residents that meets regularly to discuss facility policies, quality of life, and activities.

Finances and operations

Based on CMS SNF Cost Report for fiscal year ending in 12/2023.

Privately-owned community
Operated by a single business entity.
Net patient revenue Info Net patient revenue — what the home actually collects for resident care, after contractual allowances, bad debt and discounts are subtracted from its gross charges (CMS cost report, Worksheet G-3). It covers resident care only; money the home earns from other sources is shown separately as "Other income."
$9.0M
Net patient income Info Net patient income: net patient revenue minus the home's total operating expenses. A positive figure means it earns more from resident care than it spends to deliver it; a negative figure means the opposite. It excludes non-operating "other income."
-$4.1M
Privately-owned community Operated by a single business entity.
Net patient revenue Info Net patient revenue — what the home actually collects for resident care, after contractual allowances, bad debt and discounts are subtracted from its gross charges (CMS cost report, Worksheet G-3). It covers resident care only; money the home earns from other sources is shown separately as "Other income."
$9.0M Rank #33 / 304Revenue — State benchmarkedThis home is ranked 33rd out of 304 homes in Texas. Shows this facility's annual revenue compared to the Texas average. Higher revenue generally means more resources for staffing and capital — read alongside Payroll %.Rankings are based only on facilities in Texas that report data for that category. Facilities without available data are excluded from the ranking.Click the rank badge to see the full State ranking.Click here to see the full State ranking.
Net patient income Info Net patient income: net patient revenue minus the home's total operating expenses. A positive figure means it earns more from resident care than it spends to deliver it; a negative figure means the opposite. It excludes non-operating "other income."
-$4.1M
Other income Info Money the home earns outside of resident care — such as investments, grants, rentals and other non-operating sources (CMS cost report, Worksheet G-3). It is tracked separately from net patient revenue: it is not part of that figure, and it is not included in net patient income.
$5.7M
Payroll costs Info Staff salaries plus wage-related costs — benefits such as payroll taxes, health insurance and retirement — from the home's own accounting records (CMS cost report, Worksheet A). Contract or agency labor is counted separately, under other operating costs. Rank #61 / 304Payroll — State benchmarkedThis home is ranked 61st out of 304 homes in Texas. Shows total annual staff payroll benchmarked to the Texas average. Higher payroll investment relative to peers often signals better staffing and less reliance on cheaper contract labor.Rankings are based only on facilities in Texas that report data for that category. Facilities without available data are excluded from the ranking.Click the rank badge to see the full State ranking.Click here to see the full State ranking.
$7.0M 76.9% of net patient revenue Info Payroll as a share of revenue: staff salaries and wage-related benefits divided by net patient revenue. A higher figure means more of each revenue dollar goes to staff pay. Rank #276 / 304Payroll % — State benchmarkedThis home is ranked 276th out of 304 homes in Texas. Shows payroll as a percentage of revenue versus the Texas average. Well-run Texas facilities typically land around 51–63% — the top third Statewide. Below 25% may signal understaffing or heavy agency use — read with Staffing ratings.Rankings are based only on facilities in Texas that report data for that category. Facilities without available data are excluded from the ranking.Click the rank badge to see the full State ranking.Click here to see the full State ranking.
Other operating costs Info Everything it costs to run the home apart from payroll — food, utilities, supplies, maintenance, contract labor and administration. Calculated as total operating expense minus payroll (staff salaries and wage-related benefits).
$6.2M
Total costs Info The home's total operating expense for the year — all the costs of running it, salaries included (CMS cost report, Worksheet G-3).
$13.2M

What does this home offer?

Pets allowed icon
Pets allowed icon

Pets Allowed

Room sizes icon
Room sizes icon

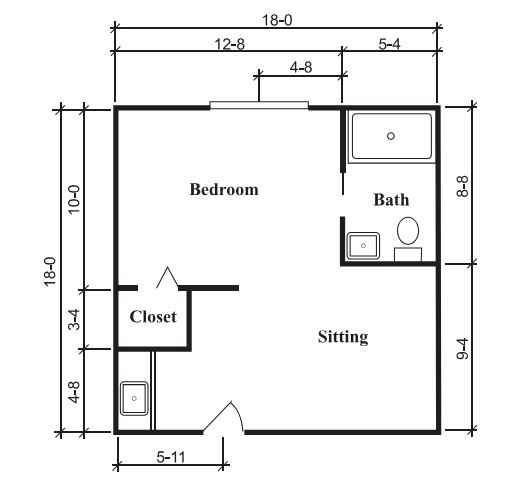
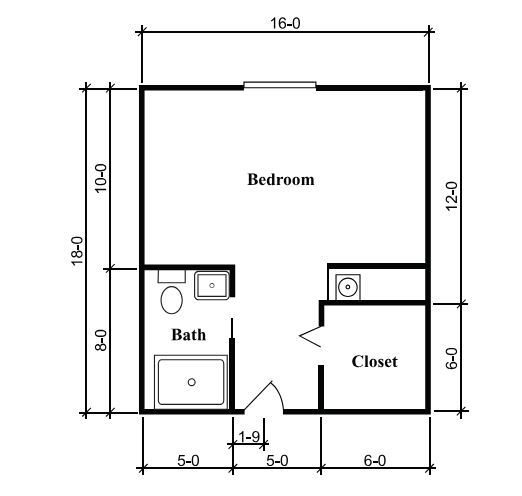
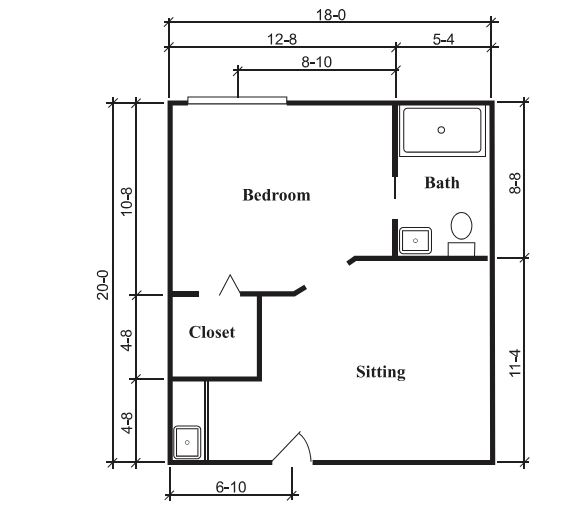
Room Sizes: 288 / 324 / 360 sq. ft

Housing options icon

Housing Options: Suite

Building type icon
Building type icon

Building Type: Single-story

Transportation services icon

Transportation Services

Fitness and recreation icon

Fitness and Recreation

Who this home usually serves

TYPE OF STAY

Primarily short stays

Residents typically stay for brief periods, with frequent admissions and discharges throughout the year.

Most new residents arrive under private pay (65% of admissions), and a typical private pay stay runs around 2 - 3 months.

Admissions
491 total

Coverage residents most often arrive under.

Medicare 33%
Private pay 65%
Medicaid 2%
Discharges
506 total

Coverage residents most often leave under.

Medicare 30%
Private pay 66%
Medicaid 4%

Living Spaces & Floor Plans for Brookdale Denton North

Brookdale Denton North Suite 1
Brookdale Denton North Suite
Brookdale Denton North Suite 2
Floor Plan
Download PDF

Places of interest near Brookdale Denton North

Address 2.5 miles from city center Info Estimated distance in miles from Denton's city center to Brookdale Denton North's address, calculated via Google Maps. — 5.1 miles to nearest hospital (Medical City Denton)

Calculate Travel Distance to Brookdale Denton North

Add your location

Address

Compare Assisted Living around Texas

The information below is reported by the Texas Health and Human Services Commission.

Brookdale Denton North
AL
NH
Denton (Northridge) -
60
Facility 60
TX AVG 80
Rank #583 / 988
A+
44
Facility 44
TX AVG 41
Rank #647 / 1391
Suite
Parkwood Assisted Living
AL
IL
MC
NH
Bedford -
84
Facility 84
TX AVG 80
Rank #465 / 988
-
34
Facility 34
TX AVG 41
Rank #865 / 1391
Studio / Suite / 1 Bed

Financial Assistance for
Assisted Living in Texas

Brookdale Denton North is located in Denton, Texas.
Here are the financial assistance programs available to residents in Texas.

Get Financial aid guidance

Community Care for the Aged and Disabled (CCAD)

TX Medicaid CCAD

Age 65+ or disabled
General Texas resident, Medicaid-eligible, care need (not always nursing home level).
Income Limits (2025) ~$2,829/month 300% FBR, individual
Asset Limits $2,000 (individual), $3,000 (couple).
TX

Large state; rural access challenges.

Benefits
Personal care (5-7 hours/day) Respite (240 hours/year) Adult day care (~$60/day) Home aides

Texas Community Care Services

TX CCS

Age 60+
General Texas resident, at risk of decline.
Income Limits ~$2,000/month individual, varies
Asset Limits $5,000 individual
TX

Limited funding; high demand in urban areas.

Benefits
In-home care (3-5 hours/week) Respite (up to 10 days/year) Transportation (~5 trips/month)

Area Agency on Aging (AAA) Services

Texas AAA Services

Age 60+
General TX resident; no income/asset limits.
Income Limits (2025) None; donations encouraged.
Asset Limits Not assessed.
TX

28 AAAs; includes Meals on Wheels in some areas.

Benefits
Meals (~$5-$7/meal) Transportation Homemaker services (~4 hours/week) Respite (~5 days/year) Legal aid

Medicare Savings Program (MSP)

Texas Medicare Savings Program

Age 65+ or disabled
General TX resident, Medicare Part A/B.
Income Limits (2025) ~$2,510/month (QMB), ~$3,380/month (SLMB), ~$3,598/month (QI)—individual.
Asset Limits $9,430 (individual), $14,130 (couple).
TX

Includes Extra Help for Part D; no waitlist.

Benefits
Covers Part B premiums ($174.70/month) Deductibles ($240/year) Copays (~20%)

Family Caregiver Support Program (FCSP)

Texas Family Caregiver Support Program

Age
General Caregivers of 60+ needing care or 55+ caregivers of others; TX resident; 2+ ADLs.
Income Limits (2025) No strict cap; prioritizes low-income ~$24,980/year
Asset Limits Not assessed.
TX

High rural demand; includes grandparent caregivers.

Benefits
Respite (4-6 hours/week or 5 days/year) Adult day care ($60/day) Training Supplies (~$500/year)

VA Aid and Attendance (A&A) and Housebound Benefits

Texas VA Aid and Attendance/Housebound

Age 65+ or disabled veteran/spouse
General TX resident, wartime service, ADL help (A&A) or homebound.
Income Limits (2025) Net income < ~$1,984/month (veteran with dependent, A&A); pension offsets income.
Asset Limits ~$155,356 net worth
TX

High veteran population; supports rural/urban needs.

Benefits
Cash (~$1,433-$2,642/month veteran, ~$951-$1,318 spouse) for care costs

Property Tax Exemption for Seniors

Texas Senior Property Tax Exemption

Age 65+
General TX resident, homeowner (homestead).
Income Limits (2025) None; tax-based eligibility.
Asset Limits Not assessed.
TX

$25,000+ exemption; optional freeze in some counties; saves ~$500-$1,000/year.

Benefits
Tax exemption or freeze (~$500-$1,000/year savings)

Senior Farmers’ Market Nutrition Program (SFMNP)

Texas SFMNP

Age 60+
General TX resident, low-income.
Income Limits (2025) ~$2,322/month 185% FPL
Asset Limits Not assessed.
TX

Vouchers (~$50/season); serves ~20,000 via 28 AAAs.

Benefits
Vouchers (~$50/season) for produce at farmers’ markets

More homes from the same operator

Operated by Brookdale

Frequently Asked Questions about Brookdale Denton North

What neighborhood is Brookdale Denton North in?

Brookdale Denton North is in the Northridge neighborhood of Denton.

Who is the owner of Brookdale Denton North?

The legal owner and operator of Brookdale Denton North is Febc-Alt Holdings, Inc..

Is Brookdale Denton North in a walkable area?

Brookdale Denton North has a walk score of 44. Somewhat walkable. A few nearby services may be reachable on foot, but most trips require transportation.

What is the license number of Brookdale Denton North?

According to TX state health department records, Brookdale Denton North's license number is 146573.

When does Brookdale Denton North's license expire?

According to TX state health department records, Brookdale Denton North's license expires on January 12, 2026.

What is the occupancy rate at Brookdale Denton North?

Brookdale Denton North's occupancy is 80%.

Does Brookdale Denton North have different floorplan options?

Yes — see the floorplan options available at Brookdale Denton North on this page.

Guides for Better Senior Living

Care Cost Calculator: See Prices in Your Area

Nursing Home Data Explorer

Don’t Wait Too Long: 7 Red Flag Signs Your Parent Needs Assisted Living Now

The True Cost of Assisted Living in 2025 – And How Families Are Paying For It

Understanding Senior Living Costs: Pricing Models, Discounts & Financial Assistance