Buckner Calder Woods
Nursing Home, Assisted Living, Independent Living, Memory Care & Respite Care · Texas, TX
CMS overall rating Info CMS (the Centers for Medicare & Medicaid Services) is the federal agency that rates nursing home quality. Its Overall Rating runs from 1 to 5 stars, combining health inspections, staffing, and quality measures, with inspections weighted most heavily.

Buckner Calder Woods

Nursing Home, Assisted Living, Independent Living, Memory Care & Respite Care · Texas, TX
CMS overall rating Info CMS (the Centers for Medicare & Medicaid Services) is the federal agency that rates nursing home quality. Its Overall Rating runs from 1 to 5 stars, combining health inspections, staffing, and quality measures, with inspections weighted most heavily.
Calculator: See prices in your area
Buckner Calder Woods accepts Medicare and private pay.

Overview of Buckner Calder Woods

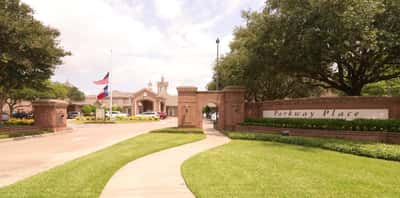
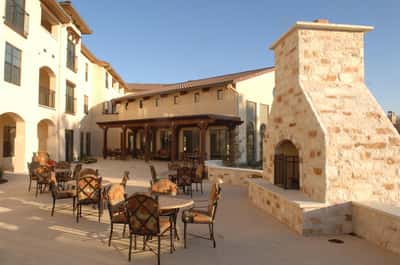
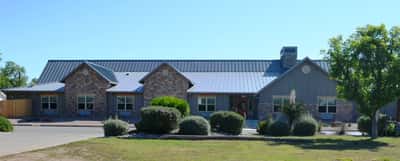
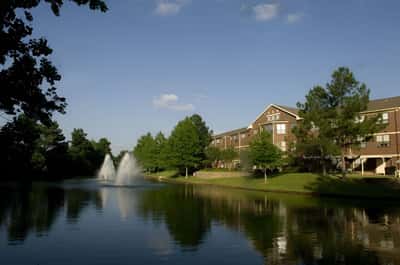
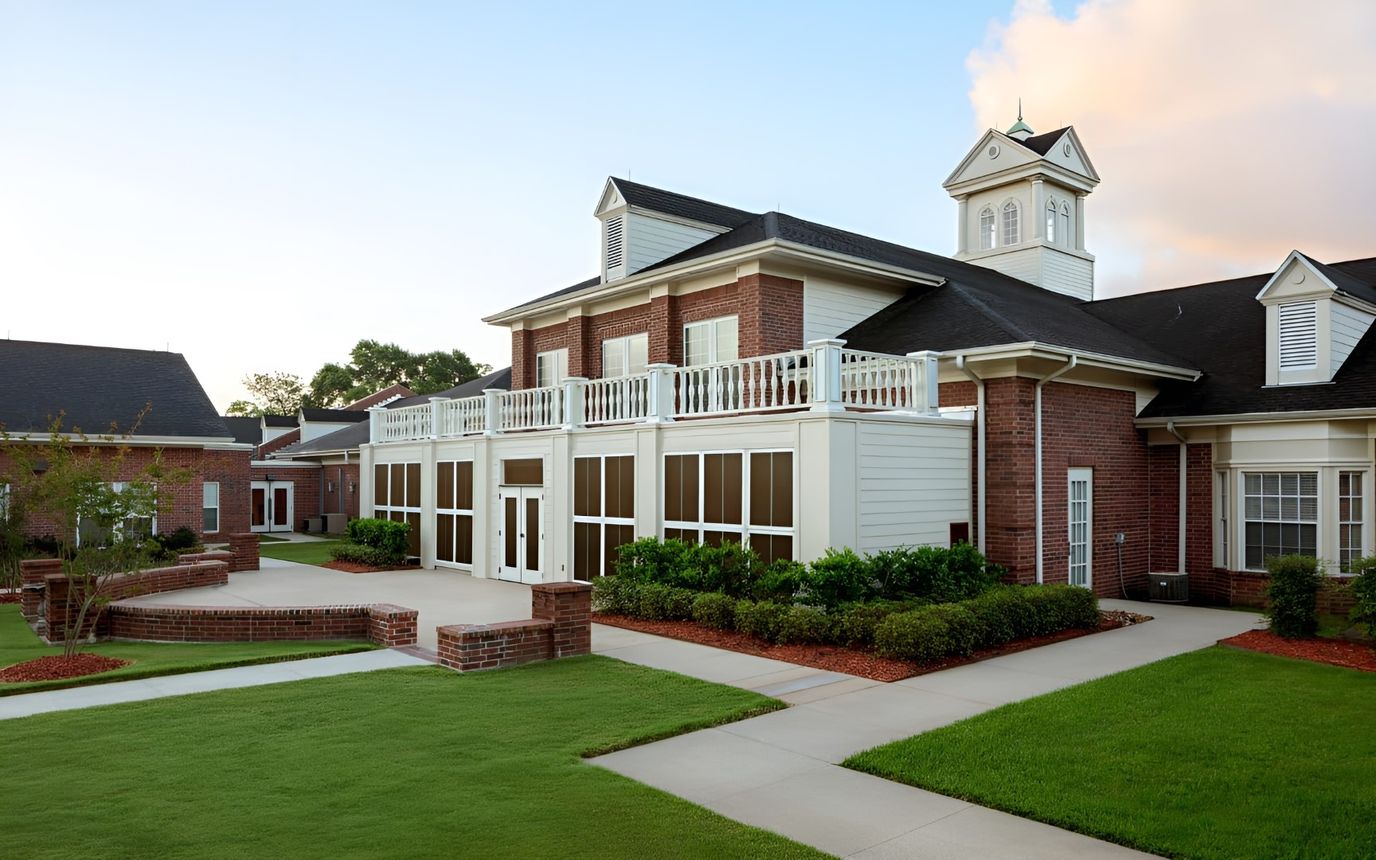
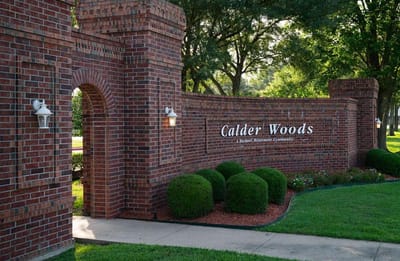
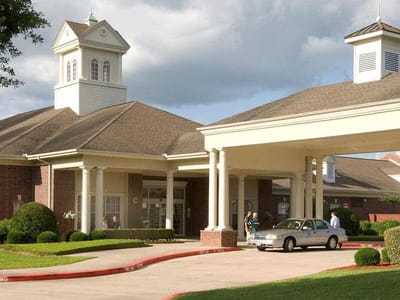
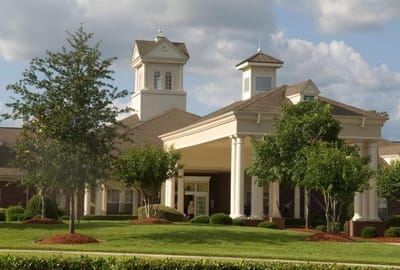
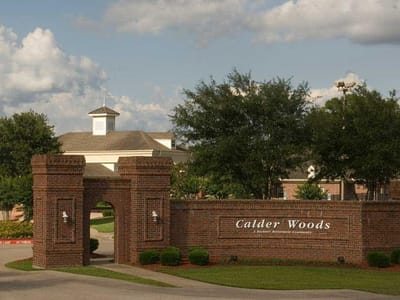
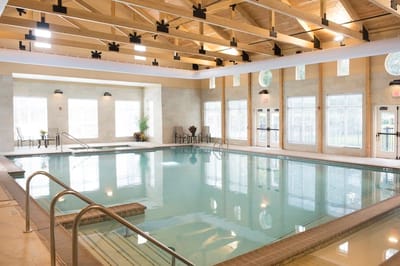
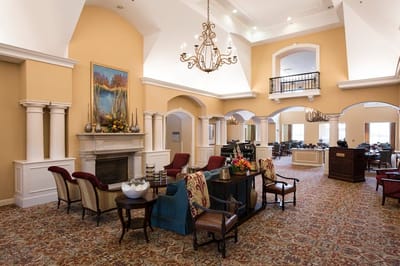
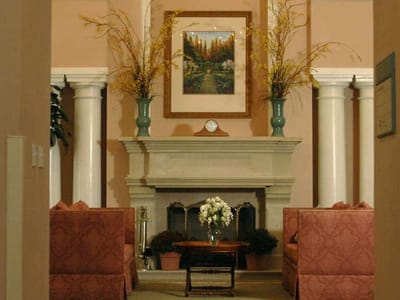
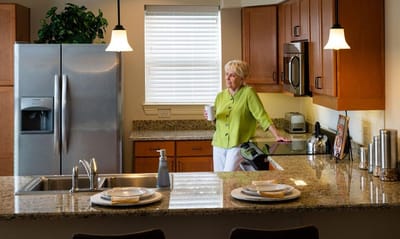
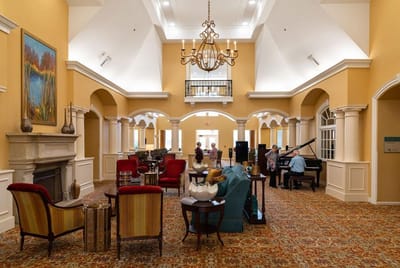
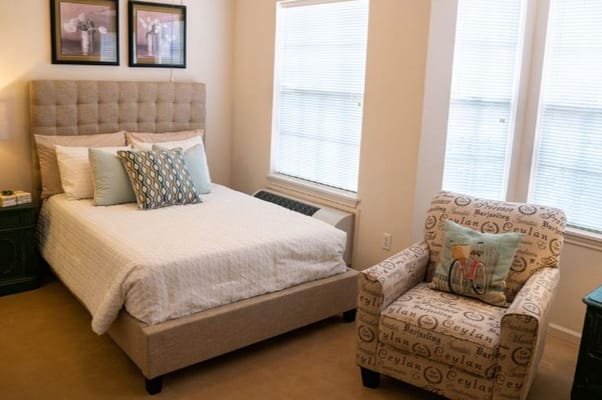
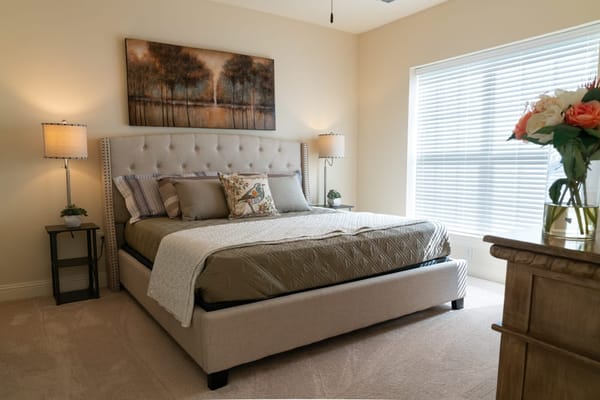
Nestled in the heart of Beaumont, Texas, Calder Woods is a dynamic senior living community offering a warm and welcoming atmosphere. Surrounded by lush landscapes and serene views, our community provides residents with a fulfilling and engaging retirement lifestyle. From spacious and comfortable residences to a wide range of amenities and activities, Buckner Calder Woods caters to the diverse interests and preferences of our residents. With a focus on personalized care and support, our compassionate team ensures that each individual receives the attention they need to thrive. Come experience the vibrant community spirit and exceptional quality of life at Buckner Calder Woods.

(409) 407-7636

Quality ratings

Measured by Centers for Medicare & Medicaid Services (CMS)

Overall rating Info The Overall CMS Rating combines results from health inspections, staffing levels and quality measures. Health inspections carry the most weight. Staffing and quality scores can increase or decrease the final rating based on performance compared to state and national standards.
▲ 7.4% Above TX avg. ▲ 7.4% Above TX avg.TX average: 2.8Click the badge to see the full State ranking.Click here to see the full State ranking.
Health Inspection Info Based on the results of the facility's three most recent standard inspections and any complaint investigations. CMS reviews the number, scope, and severity of deficiencies, with more recent findings weighted more heavily.
▲ 8.6% Above TX avg. ▲ 8.6% Above TX avg.TX average: 2.8Click the badge to see the full State ranking.Click here to see the full State ranking.
Staffing Info Measures average nursing staff hours per resident per day, including Registered Nurses (RNs) and total nursing staff. Ratings are adjusted based on the level of care residents require and are compared to state and national benchmarks.
▲ 41.4% Above TX avg. ▲ 41.4% Above TX avg.TX average: 2.1Click the badge to see the full State ranking.Click here to see the full State ranking.
Quality Measures Info Based on clinical and physical health indicators reported to CMS, such as hospital readmissions, falls, pressure ulcers, and improvements in mobility. These measures reflect how well residents' health needs are being managed.
▲ 6.5% Above TX avg. ▲ 6.5% Above TX avg.TX average: 3.8Click the badge to see the full State ranking.Click here to see the full State ranking.

Staffing hours breakdown

Info Daily nursing hours per resident by staff type, reported to CMS. Higher is generally better — compare this facility to state and national averages to see where staffing stands.

Hours per resident per day — compared to Texas state averages

Total nursing care / resident Info This home is ranked 2nd out of 296 homes in Texas for nurse hours. Total adjusted nursing hours per resident per day, combining RN, LPN, and aide time. CMS adjusts this for case-mix so facilities can be fairly compared.
6h 45m per day
Rank #2 / 296Nurse hours — State benchmarkedThis home is ranked 2nd out of 296 homes in Texas. Shows adjusted nurse hours per resident per day benchmarked to the Texas average, with a ranking across 296 Texas facilities. More hours mean more direct care. The national average is about 3.5 hrs; below 3.0 is a red flag.Rankings are based only on facilities in Texas that report data for that category. Facilities without available data are excluded from the ranking.Click the rank badge to see the full State ranking.Click here to see the full State ranking.
This facility Texas avg (3h 38m per day)
vs Texas avg
+86%

0 of 6 metrics below state avg

Standout metric Weekend Total Nursing is +72% above state avg
Staff type Hours / Day / Resident vs state avg
Registered Nurse (RN) Info RNs hold the highest nursing license and can assess residents, interpret test results, and direct care plans. More RN hours per day often signals stronger clinical oversight and faster response to health changes. 43m per day ▲ 67% State avg: 25m per day · National avg: 41m per day
LPN / LVN Info Licensed Practical Nurses (LPNs) or Licensed Vocational Nurses (LVNs) deliver routine hands-on care — medication administration, wound dressing, and monitoring vital signs. They work under RN supervision and make up a large share of daily bedside care. 1h 30m per day ▲ 58% State avg: 57m per day · National avg: 52m per day
Nurse Aide Info Certified Nurse Aides (CNAs) provide the most direct day-to-day assistance: bathing, dressing, feeding, and mobility. Nurse aide hours are typically the largest staffing category and directly affect residents' quality of life. 3h 27m per day ▲ 71% State avg: 2h 1m per day · National avg: 2h 20m per day
Weekend Total Nursing Info Combined nursing hours (RN + LPN + Nurse Aide) per resident per day on weekends. Staffing often drops on weekends — this figure reveals whether the facility maintains adequate coverage outside of weekday hours. 5h 10m per day ▲ 72% State avg: 3h 0m per day · National avg: 3h 27m per day
Physical Therapist Info Hours per resident per day provided by licensed Physical Therapists (PTs) or PT Assistants. PT services help residents recover mobility after injury or illness and are especially important for post-acute (short-stay) rehabilitation. 4m per day ▲ 3% State avg: 4m per day · National avg: 4m per day
Weekend RN Info Registered nurse hours specifically on weekends. Facilities sometimes reduce RN presence on Saturdays and Sundays — a low weekend RN figure compared to weekday hours can indicate reduced clinical oversight when most administrative staff are absent. 27m per day ▲ 34% State avg: 20m per day · National avg: 29m per day

Capacity and availability

Avg. Length of Stay
33 days
Bed community size
46-bed community Rank #715 / 988Bed count — State benchmarkedThis home is ranked 715th out of 988 homes in Texas. Shows this facility's certified or reported bed count compared to other Texas facilities. Larger communities may offer more amenities, programs, and on-site services for residents and families.Rankings are based only on facilities in Texas that report data for that category. Facilities without available data are excluded from the ranking.Click the rank badge to see the full State ranking.Click here to see the full State ranking.
A moderately sized community that may balance personal attention with shared amenities and social activities.
Walk Score
Walk Score: 70 / 100 Rank #138 / 1391Walk Score — State benchmarkedThis home is ranked 138th out of 1391 homes in Texas. Shows how walkable this facility's neighborhood is compared to the average Walk Score across Texas facilities. Higher scores benefit residents, families, and staff.Rankings are based only on facilities in Texas that report data for that category. Facilities without available data are excluded from the ranking.Click the rank badge to see the full State ranking.Click here to see the full State ranking.
Very walkable. Most errands can be accomplished on foot, and many essentials are within a short walk.
BBB Rating
BBB Rating: A+ (Accredited)
An independent rating from the Better Business Bureau based on factors such as complaint history, transparency, and business practices.
How BBB ratings work

About this community

Occupancy

Occupancy rate
35%
Rank #278 / 304Occupancy rate — State benchmarkedThis home is ranked 278th out of 304 homes in Texas. Shows this facility's occupancy rate versus the Texas average, with its Statewide rank out of 304. Higher occupancy signals strong local demand and financial stability.Rankings are based only on facilities in Texas that report data for that category. Facilities without available data are excluded from the ranking.Click the rank badge to see the full State ranking.Click here to see the full State ranking.
Lower than the Texas average: 63.5%
Occupied beds
16 / 46
Average occupied beds in Texas homes 75 beds

License Details

Facility TypeAssisted Living
StatusLicensed
ExpirationFebruary 27, 2026 Expired
CountyJefferson
License Number148866
CMS Certification Number676109
QualificationNursing
RCFE NumberAL#100189

Ownership & Operating Entity

Buckner Calder Woods is legally operated by Buckner Retirement Services, Inc., and administered by Latesha Hunter.

OwnerBuckner Retirement Services, Inc.
Ownership TypeNonprofit Organization
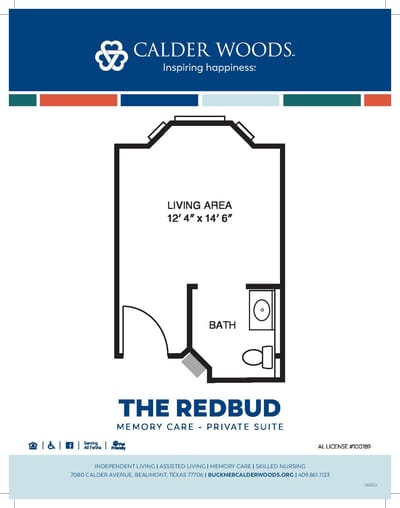
Type Of Units

Alzheimer's Units
16 units
Total beds
46 units

Staffing

Key information about the people who lead and staff this community.

Leadership

ContactMs. Latesha Hunter, Executive Director

Therapy & Rehabilitation

1 service
Respite Care

Memory & Specialized Care

1 service
No Alzheimer's certification

Contact Buckner Calder Woods

Inspection History

In Texas, the Health and Human Services Commission (HHSC) is the primary regulatory body that conducts unannounced inspections and publishes quality reports for all long-term care homes.

Since 2024 · 2 years of data 1 citation 2 inspections

Inspection Scorecard Info This scorecard compares key inspection, citation, and complaint metrics at this facility against the Texas state average. Metrics rated ≥15% worse than average are highlighted in red; those ≥15% better are highlighted in green.

Since 2024 vs. Texas state average
Overall vs. TX average 1 Worse Metrics worse than Texas average:
• Inspections with citations (100% above)
4 Better Metrics better than Texas average:
• Total citations (83% below)
• Health citations (50% below)
• Life safety citations (83% below)
• Citations per year (83% below)
Latest Inspection August 22, 2024 Other An inspection that falls outside standard annual surveys and formal complaint investigations. May include administrative compliance checks, documentation reviews, focused surveys on specific concerns, or revisit surveys to verify prior corrections.

Citations Info Citations are formal regulatory issues recorded during state inspections.

This Facility TX Average vs. TX Avg
Total citations Info Formal regulatory issues recorded by inspectors across all inspection types. 1 6 This facility has 83% fewer total citations than a typical Texas assisted living residence (1 vs. TX avg 6).↓ 83% better
Health citations Info Violations related to resident care, clinical practices, and day-to-day operations. 1 2 This facility has 50% fewer health citations than a typical Texas assisted living residence (1 vs. TX avg 2).↓ 50% better
Life safety citations Info Violations related to building safety — fire prevention, emergency egress, and similar. 1 6 This facility has 83% fewer life safety citations than a typical Texas assisted living residence (1 vs. TX avg 6).↓ 83% better
Citations per year Info Average citations per year since 2024. 0.5 3 This facility has 83% fewer citations per year than a typical Texas assisted living residence (0.5 vs. TX avg 3).↓ 83% better

Inspections Info State inspections evaluate whether the facility meets health and safety standards.

This Facility TX Average vs. TX Avg
Inspections with citations Info Inspections that resulted in at least one regulatory citation. 2 1 This facility has 100% more inspections with citations than a typical Texas assisted living residence (2 vs. TX avg 1).↑ 100% worse

Inspection Reports Summary Info An editor-reviewed summary of the themes and findings across this facility's recent inspection reports.

  • August 22, 2024 inspection cited two deficiencies for failing to ensure air conditioners shut off to prevent smoke spread during fire alarms, violating both health and life safety codes.
  • No complaints were substantiated or investigated in the most recent inspection period.
  • Deficiency themes have consistently involved fire safety system failures, showing a recurring issue with smoke control during alarms.

Health Inspection History

Inspections since 2022
Total health inspections 8

State average 7.4


Last Health inspection on Oct 2025

Total health citations
17 Rank #91 / 299Health citations — State benchmarkedThis home is ranked 91st out of 299 homes in Texas. Shows this facility's total health deficiency citations benchmarked to the Texas State average, with a ranking across all 299 TX facilities. Lower citation counts earn a better rank.Rankings are based only on facilities in Texas that report data for that category. Facilities without available data are excluded from the ranking.Click the rank badge to see the full State ranking.Click here to see the full State ranking.

State average 25.9

Citations per inspection
2.12 Rank #35 / 299Citations per inspection — State benchmarkedThis home is ranked 35th out of 299 homes in Texas. Shows average deficiency citations per CMS inspection for this facility versus the Texas mean across 299 facilities with citation data. Lower is better.Rankings are based only on facilities in Texas that report data for that category. Facilities without available data are excluded from the ranking.Click the rank badge to see the full State ranking.Click here to see the full State ranking.

State average 3.67


Health citations are formal notices following inspections when they fail to comply with safety and care standards.

6 of 17 citations resulted from standard inspections; and 11 of 17 resulted from complaint investigations.

Breakdown of citation severity (last 4 years)
Critical health citations
1
50% better than State average

State average: 2


Serious health citations
0
100% better than State average

State average: 0.4

1 critical citation State average: 2

0 serious citations State average: 0.4

16 moderate citations State average: 23

0 minor citations State average: 0.4
Citations history (last 4 years)
Quality of Care critical citation Oct 07, 2025

Infection Control moderate citation Aug 11, 2025
Corrected

Quality of Care moderate citation Aug 11, 2025
Corrected

Care Planning moderate citation Aug 11, 2025
Corrected

Staffing Data

Reporting period: October 1 – December 31, 2025 (Q4 2025). Source: CMS Payroll-Based Journal report.

Total staff 135
Employees 45
Contractors 90
Staff to resident ratio 4.35 : 1
195% more staff per resident than Texas average
Texas average ratio: 1.48 : 1 Texas average ratio: 1.48 : 1See full Texas ranking
Avg staff/day 26
Average shift 9.5 hours
17% better than Texas average
Texas average: 8.1 hours Texas average shift: 8.1 hoursSee full Texas ranking
Total staff hours (quarter) 22,676

Nursing staff breakdown

Q4 2025 · Oct 1 – Dec 31 More info This data comes from the CMS Payroll-Based Journal report covering October 1 – December 31, 2025.
Registered Nurse

Manages medical care and health needs.

RN Staff Info 5 total: 4 full-time employees and 1 contractor. 5
Average shift length Info Average shift length. Calculated as total hours divided by days worked and average staff per day. 9.2 hours
Licensed Practical Nurse

Assists with medical care and medications.

LPN Staff Info 39 total: 8 full-time employees and 31 contractors. 39
Average shift length Info Average shift length. Calculated as total hours divided by days worked and average staff per day. 9.9 hours
Certified Nursing Assistant

Helps with daily care and mobility.

CNA Staff Info 57 total: 21 full-time employees and 36 contractors. 57
Average shift length Info Average shift length. Calculated as total hours divided by days worked and average staff per day. 10 hours

Contractor staffing

Q4 2025 · Oct 1 – Dec 31 More info This data comes from the CMS Payroll-Based Journal report covering October 1 – December 31, 2025.

Total hours from contractors

23.6%

5,352 contractor hours this quarter

Certified Nursing Assistant: 36 Licensed Practical Nurse: 31 Medication Aide/Technician: 7 Qualified Social Worker: 4 Physical Therapy Aide: 2 Respiratory Therapy Technician: 2 Speech Language Pathologist: 2 Physical Therapy Assistant: 2 Registered Nurse: 1 Medical Director: 1 Occupational Therapy Assistant: 1 Occupational Therapy Aide: 1

Staff by category

Q4 2025 · Oct 1 – Dec 31 More info This data comes from the CMS Payroll-Based Journal report covering October 1 – December 31, 2025.
Certified Nursing Assistant 21 36 57 10,546 92 100% 10
Licensed Practical Nurse 8 31 39 4,757 92 100% 9.9
Medication Aide/Technician 4 7 11 1,614 79 86% 11.6
Registered Nurse 4 1 5 1,602 90 98% 9.2
Dietitian 2 0 2 578 60 65% 8.4
RN Director of Nursing 1 0 1 523 62 67% 8.4
Nurse Practitioner 1 0 1 488 61 66% 8
Mental Health Service Worker 1 0 1 464 58 63% 8
Clinical Nurse Specialist 2 0 2 408 51 55% 8
Administrator 1 0 1 384 48 52% 8
Physical Therapy Aide 0 2 2 263 37 40% 6.8
Qualified Social Worker 0 4 4 260 37 40% 6.2
Speech Language Pathologist 0 2 2 246 37 40% 6.3
Respiratory Therapy Technician 0 2 2 242 36 39% 6.7
Physical Therapy Assistant 0 2 2 226 37 40% 6.1
Occupational Therapy Aide 0 1 1 53 9 10% 5.9
Occupational Therapy Assistant 0 1 1 18 3 3% 6
Medical Director 0 1 1 6 3 3% 2
57 Certified Nursing Assistant
% of Days 100%
39 Licensed Practical Nurse
% of Days 100%
11 Medication Aide/Technician
% of Days 86%
5 Registered Nurse
% of Days 98%
2 Dietitian
% of Days 65%
1 RN Director of Nursing
% of Days 67%
1 Nurse Practitioner
% of Days 66%
1 Mental Health Service Worker
% of Days 63%
2 Clinical Nurse Specialist
% of Days 55%
1 Administrator
% of Days 52%
2 Physical Therapy Aide
% of Days 40%
4 Qualified Social Worker
% of Days 40%
2 Speech Language Pathologist
% of Days 40%
2 Respiratory Therapy Technician
% of Days 39%
2 Physical Therapy Assistant
% of Days 40%
1 Occupational Therapy Aide
% of Days 10%
1 Occupational Therapy Assistant
% of Days 3%
1 Medical Director
% of Days 3%

Penalties and fines

Federal penalties imposed by CMS for regulatory violations, including civil money penalties (fines) and denials of payment for new Medicare/Medicaid admissions.

Source: CMS Penalties Database

No penalties in the past 3 years

No civil money penalties or payment denials were reported in the last 3 years.

Quality of care over time

These measures show how residents usually do over time at this home, based on health outcomes and preventive care.

High-risk clinical events score Info A composite score based on pressure ulcers, falls with injury, weight loss, walking ability decline, and activities of daily living decline. 6.5
25% better than Texas average

Texas average: 8.6

Functional decline score Info A composite score based on activities of daily living decline, walking ability decline, and incontinence. 5.3
67% better than Texas average

Texas average: 16.0

Long-stay resident measures
Need for Help with Daily Activities Increased Info Percent of long-stay residents whose need for help with daily activities has increased 5.0%
69% better than Texas average

Texas average: 16.2%

Low Risk Residents with Bowel/Bladder Incontinence Info Percent of low risk long-stay residents who lose control of their bowels or bladder 5.6%
64% better than Texas average

Texas average: 15.7%

Falls with Major Injury Info Percent of long-stay residents experiencing one or more falls with major injury 9.3%
189% worse than Texas average

Texas average: 3.2%

High Risk Residents with Pressure Ulcers Info Percent of long-stay high risk residents with pressure ulcers 4.9%
11% worse than Texas average

Texas average: 4.4%

Urinary Tract Infection Info Percent of long-stay residents with a urinary tract infection 0.0%
100% better than Texas average

Texas average: 0.8%

Lost Too Much Weight Info Percent of long-stay residents who lose too much weight 6.8%
95% worse than Texas average

Texas average: 3.5%

Depressive Symptoms Info Percent of long-stay residents who have depressive symptoms 0.0%
100% better than Texas average

Texas average: 2.9%

Antipsychotic Use Info Percent of long-stay residents who received an antipsychotic medication 11.3%
43% worse than Texas average

Texas average: 7.9%

Pneumococcal Vaccine Info Percent of long-stay residents assessed and appropriately given the pneumococcal vaccine 100.0%
In line with Texas average

Texas average: 97.3%

Influenza Vaccine Info Percent of long-stay residents assessed and appropriately given the seasonal influenza vaccine 100.0%
In line with Texas average

Texas average: 97.9%

Short-stay resident measures
Pneumococcal Vaccine Info Percent of short-stay residents assessed and appropriately given the pneumococcal vaccine 99.8%
10% better than Texas average

Texas average: 90.4%

Antipsychotic medication increase Info Percent of short-stay residents who newly received an antipsychotic medication 1.2%
17% better than Texas average

Texas average: 1.4%

Influenza Vaccine Info Percent of short-stay residents assessed and appropriately given the seasonal influenza vaccine 99.2%
13% better than Texas average

Texas average: 88.0%

Breakdown by payment type

Medicare

45% of new residents, usually for short-term rehab.

Typical stay 1 - 2 months

Private pay

55% of new residents, often for short stays.

Typical stay 20 days

Facility Characteristics

Source: CMS Long-Term Care Facility Characteristics (Data as of Jan 2026)

Total residents 31
Medicare
31
100% of residents
Programs & Services
Residents Group

Residents meet regularly to discuss policies, care quality, and activities

CCRC

Part of a Continuing Care Retirement Community offering multiple care levels

Active Resident Council

Organized group of residents that meets regularly to discuss facility policies, quality of life, and activities.

Finances and operations

Based on CMS SNF Cost Report for fiscal year ending in 12/2023.

Governmental community
Net patient revenue Info Net patient revenue — what the home actually collects for resident care, after contractual allowances, bad debt and discounts are subtracted from its gross charges (CMS cost report, Worksheet G-3). It covers resident care only; money the home earns from other sources is shown separately as "Other income."
$4.6M
Net patient income Info Net patient income: net patient revenue minus the home's total operating expenses. A positive figure means it earns more from resident care than it spends to deliver it; a negative figure means the opposite. It excludes non-operating "other income."
-$10.0M
Governmental community
Net patient revenue Info Net patient revenue — what the home actually collects for resident care, after contractual allowances, bad debt and discounts are subtracted from its gross charges (CMS cost report, Worksheet G-3). It covers resident care only; money the home earns from other sources is shown separately as "Other income."
$4.6M Rank #111 / 304Revenue — State benchmarkedThis home is ranked 111th out of 304 homes in Texas. Shows this facility's annual revenue compared to the Texas average. Higher revenue generally means more resources for staffing and capital — read alongside Payroll %.Rankings are based only on facilities in Texas that report data for that category. Facilities without available data are excluded from the ranking.Click the rank badge to see the full State ranking.Click here to see the full State ranking.
Net patient income Info Net patient income: net patient revenue minus the home's total operating expenses. A positive figure means it earns more from resident care than it spends to deliver it; a negative figure means the opposite. It excludes non-operating "other income."
-$10.0M
Other income Info Money the home earns outside of resident care — such as investments, grants, rentals and other non-operating sources (CMS cost report, Worksheet G-3). It is tracked separately from net patient revenue: it is not part of that figure, and it is not included in net patient income.
$6.8M
Payroll costs Info Staff salaries plus wage-related costs — benefits such as payroll taxes, health insurance and retirement — from the home's own accounting records (CMS cost report, Worksheet A). Contract or agency labor is counted separately, under other operating costs. Rank #77 / 304Payroll — State benchmarkedThis home is ranked 77th out of 304 homes in Texas. Shows total annual staff payroll benchmarked to the Texas average. Higher payroll investment relative to peers often signals better staffing and less reliance on cheaper contract labor.Rankings are based only on facilities in Texas that report data for that category. Facilities without available data are excluded from the ranking.Click the rank badge to see the full State ranking.Click here to see the full State ranking.
$6.0M 129% of net patient revenue Info Payroll as a share of revenue: staff salaries and wage-related benefits divided by net patient revenue. A higher figure means more of each revenue dollar goes to staff pay. Rank #96 / 304Payroll % — State benchmarkedThis home is ranked 96th out of 304 homes in Texas. Shows payroll as a percentage of revenue versus the Texas average. Well-run Texas facilities typically land around 51–63% — the top third Statewide. Below 25% may signal understaffing or heavy agency use — read with Staffing ratings.Rankings are based only on facilities in Texas that report data for that category. Facilities without available data are excluded from the ranking.Click the rank badge to see the full State ranking.Click here to see the full State ranking.
Other operating costs Info Everything it costs to run the home apart from payroll — food, utilities, supplies, maintenance, contract labor and administration. Calculated as total operating expense minus payroll (staff salaries and wage-related benefits).
$8.7M
Total costs Info The home's total operating expense for the year — all the costs of running it, salaries included (CMS cost report, Worksheet G-3).
$14.7M

What does this home offer?

Housing options icon

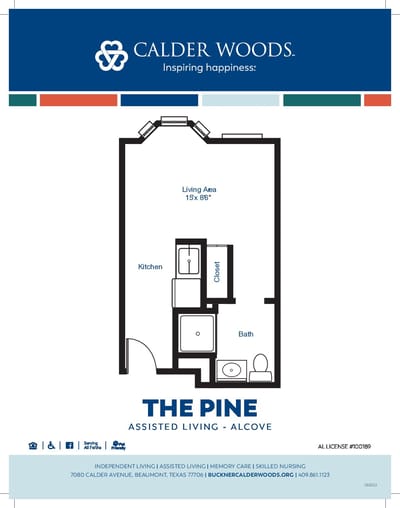
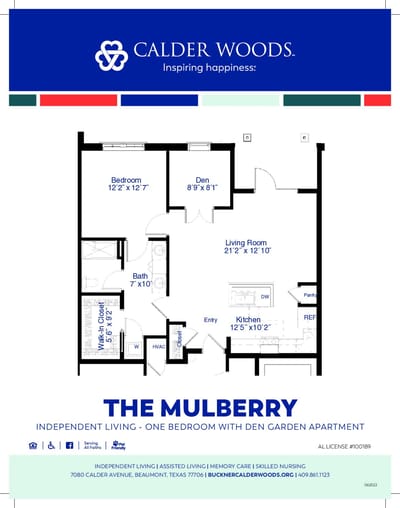
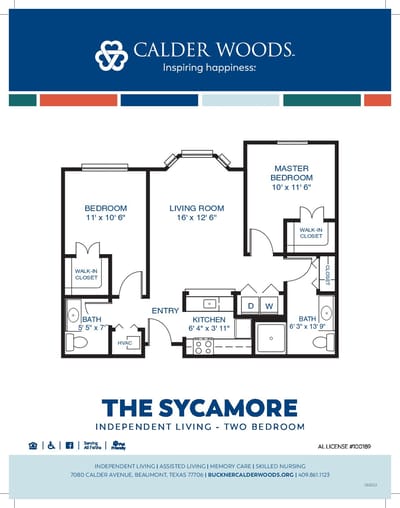
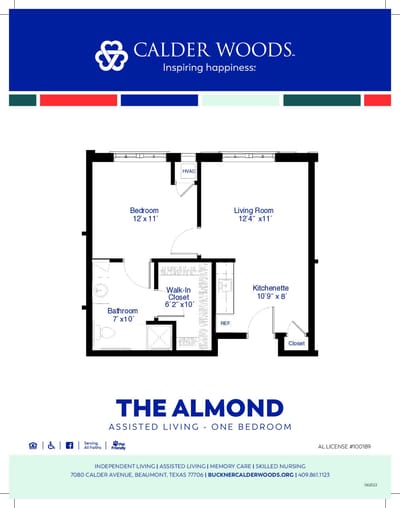
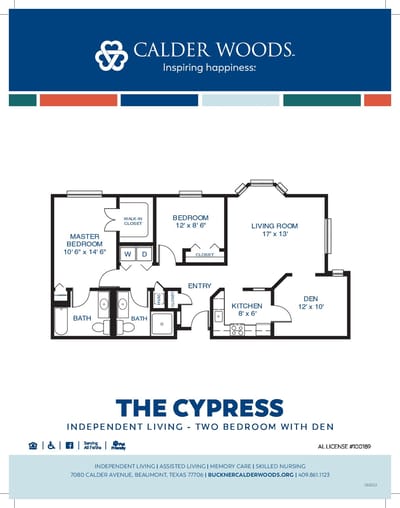
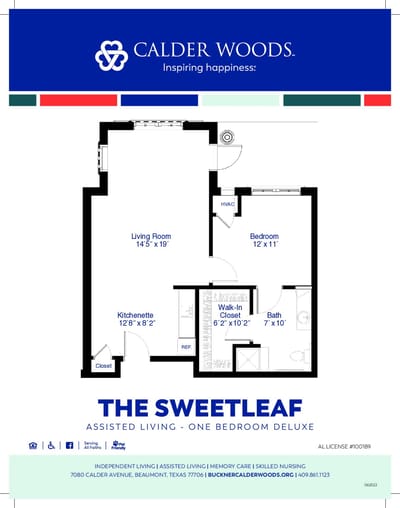
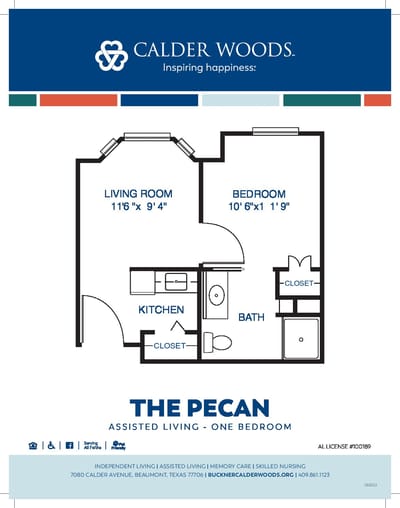
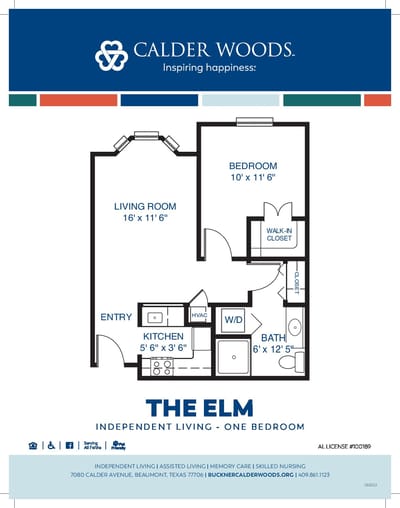
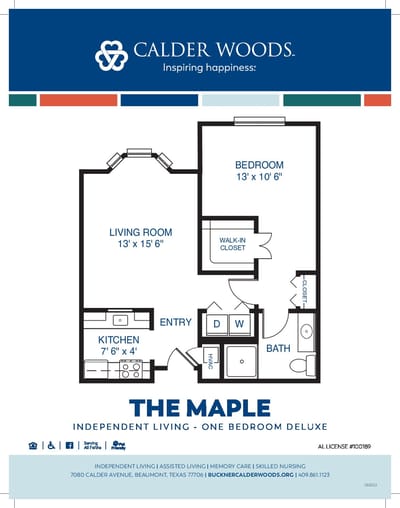
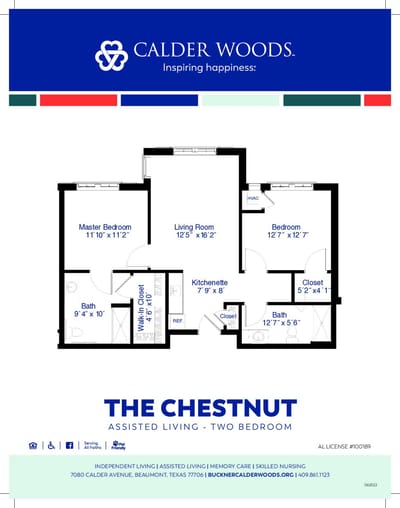
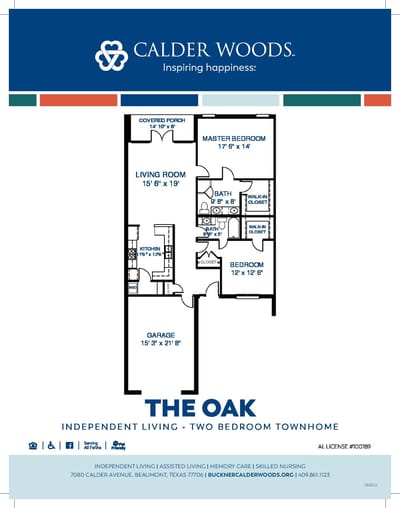
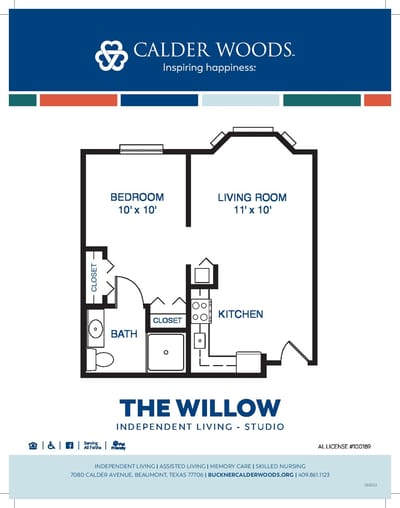
Housing Options: Studio / 1 Bed / 2 Bed

Building type icon
Building type icon

Building Type: 2-story

Type of Rooms Available

Studio
Studio
1
1 Bed
1 Bed
1 / 4
1 Bed
1

Who this home usually serves

TYPE OF STAY

Mix of rehab and long-term care

This home supports both short-term rehab and long-term care, with residents staying for a wide range of durations.

Most new residents arrive under private pay (55% of admissions), and a typical private pay stay runs around 20 days.

Admissions
210 total

Coverage residents most often arrive under.

Medicare 45%
Private pay 55%
Discharges
174 total

Coverage residents most often leave under.

Medicare 48%
Private pay 52%

Managed by Latesha Hunter

Executive Director

Latesha Hunter serves as the Executive Director at Buckner Calder Woods, providing operational leadership and support for residents, families, and staff. Since joining in 2021 as Health Services Administrator, she was promoted in 2024 to oversee all aspects of the community’s success and wellbeing.

Places of interest near Buckner Calder Woods

Address 3.6 miles from city center Info Estimated distance in miles from Beaumont's city center to Buckner Calder Woods's address, calculated via Google Maps.

Calculate Travel Distance to Buckner Calder Woods

Add your location

Address

Compare Assisted Living around Texas

The information below is reported by the Texas Health and Human Services Commission.

Buckner Calder Woods
AL
NH
IL
MC
RC
Beaumont -
46
Facility 46
TX AVG 80
Rank #715 / 988
A+
70
Facility 70
TX AVG 41
Rank #138 / 1391
Studio / 1 Bed / 2 Bed
Parkwood Assisted Living
AL
IL
MC
NH
Bedford -
84
Facility 84
TX AVG 80
Rank #465 / 988
-
34
Facility 34
TX AVG 41
Rank #865 / 1391
Studio / Suite / 1 Bed

Financial Assistance for
Assisted Living in Texas

Buckner Calder Woods is located in Beaumont, Texas.
Here are the financial assistance programs available to residents in Texas.

Get Financial aid guidance

Community Care for the Aged and Disabled (CCAD)

TX Medicaid CCAD

Age 65+ or disabled
General Texas resident, Medicaid-eligible, care need (not always nursing home level).
Income Limits (2025) ~$2,829/month 300% FBR, individual
Asset Limits $2,000 (individual), $3,000 (couple).
TX

Large state; rural access challenges.

Benefits
Personal care (5-7 hours/day) Respite (240 hours/year) Adult day care (~$60/day) Home aides

Texas Community Care Services

TX CCS

Age 60+
General Texas resident, at risk of decline.
Income Limits ~$2,000/month individual, varies
Asset Limits $5,000 individual
TX

Limited funding; high demand in urban areas.

Benefits
In-home care (3-5 hours/week) Respite (up to 10 days/year) Transportation (~5 trips/month)

Area Agency on Aging (AAA) Services

Texas AAA Services

Age 60+
General TX resident; no income/asset limits.
Income Limits (2025) None; donations encouraged.
Asset Limits Not assessed.
TX

28 AAAs; includes Meals on Wheels in some areas.

Benefits
Meals (~$5-$7/meal) Transportation Homemaker services (~4 hours/week) Respite (~5 days/year) Legal aid

Medicare Savings Program (MSP)

Texas Medicare Savings Program

Age 65+ or disabled
General TX resident, Medicare Part A/B.
Income Limits (2025) ~$2,510/month (QMB), ~$3,380/month (SLMB), ~$3,598/month (QI)—individual.
Asset Limits $9,430 (individual), $14,130 (couple).
TX

Includes Extra Help for Part D; no waitlist.

Benefits
Covers Part B premiums ($174.70/month) Deductibles ($240/year) Copays (~20%)

Family Caregiver Support Program (FCSP)

Texas Family Caregiver Support Program

Age
General Caregivers of 60+ needing care or 55+ caregivers of others; TX resident; 2+ ADLs.
Income Limits (2025) No strict cap; prioritizes low-income ~$24,980/year
Asset Limits Not assessed.
TX

High rural demand; includes grandparent caregivers.

Benefits
Respite (4-6 hours/week or 5 days/year) Adult day care ($60/day) Training Supplies (~$500/year)

VA Aid and Attendance (A&A) and Housebound Benefits

Texas VA Aid and Attendance/Housebound

Age 65+ or disabled veteran/spouse
General TX resident, wartime service, ADL help (A&A) or homebound.
Income Limits (2025) Net income < ~$1,984/month (veteran with dependent, A&A); pension offsets income.
Asset Limits ~$155,356 net worth
TX

High veteran population; supports rural/urban needs.

Benefits
Cash (~$1,433-$2,642/month veteran, ~$951-$1,318 spouse) for care costs

Property Tax Exemption for Seniors

Texas Senior Property Tax Exemption

Age 65+
General TX resident, homeowner (homestead).
Income Limits (2025) None; tax-based eligibility.
Asset Limits Not assessed.
TX

$25,000+ exemption; optional freeze in some counties; saves ~$500-$1,000/year.

Benefits
Tax exemption or freeze (~$500-$1,000/year savings)

Senior Farmers’ Market Nutrition Program (SFMNP)

Texas SFMNP

Age 60+
General TX resident, low-income.
Income Limits (2025) ~$2,322/month 185% FPL
Asset Limits Not assessed.
TX

Vouchers (~$50/season); serves ~20,000 via 28 AAAs.

Benefits
Vouchers (~$50/season) for produce at farmers’ markets

Frequently Asked Questions about Buckner Calder Woods

Who is the owner of Buckner Calder Woods?

The legal owner and operator of Buckner Calder Woods is Buckner Retirement Services, Inc..

Is Buckner Calder Woods in a walkable area?

Buckner Calder Woods has a walk score of 70. Very walkable. Most errands can be accomplished on foot, and many essentials are within a short walk.

What is the license number of Buckner Calder Woods?

According to TX state health department records, Buckner Calder Woods's license number is 148866.

When does Buckner Calder Woods's license expire?

According to TX state health department records, Buckner Calder Woods's license expires on February 27, 2026.

What is the occupancy rate at Buckner Calder Woods?

Buckner Calder Woods's occupancy is 35%.

Who is the administrator of Buckner Calder Woods?

Latesha Hunter is the administrator of Buckner Calder Woods.

How many beds does Buckner Calder Woods have?

Buckner Calder Woods has 46 beds.

Guides for Better Senior Living

Care Cost Calculator: See Prices in Your Area

Nursing Home Data Explorer

Don’t Wait Too Long: 7 Red Flag Signs Your Parent Needs Assisted Living Now

The True Cost of Assisted Living in 2025 – And How Families Are Paying For It

Understanding Senior Living Costs: Pricing Models, Discounts & Financial Assistance