Catholic Eldercare
Nursing Home · Minneapolis, MN
CMS overall rating Info The Overall CMS Rating is scored from 1 to 5 stars and combines results from health inspections, staffing levels, and quality measures. Health inspections carry the most weight. Staffing and quality scores can increase or decrease the final rating based on performance compared to state and national standards.

Catholic Eldercare

Nursing Home · Minneapolis, MN
CMS overall rating Info The Overall CMS Rating is scored from 1 to 5 stars and combines results from health inspections, staffing levels, and quality measures. Health inspections carry the most weight. Staffing and quality scores can increase or decrease the final rating based on performance compared to state and national standards.
Calculator: See prices in your area
Catholic Eldercare accepts Medicare, Medicaid, and private pay.

Overview of Catholic Eldercare

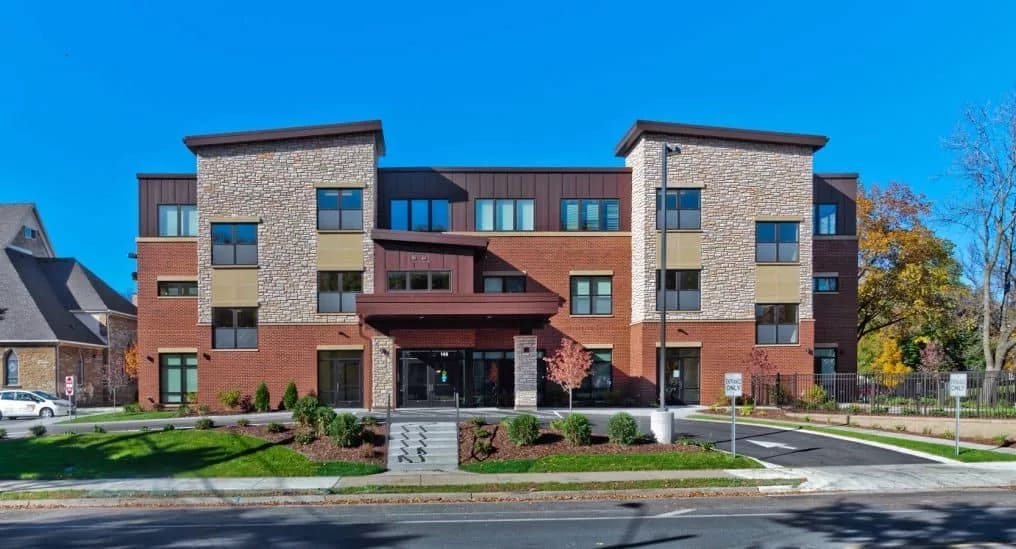
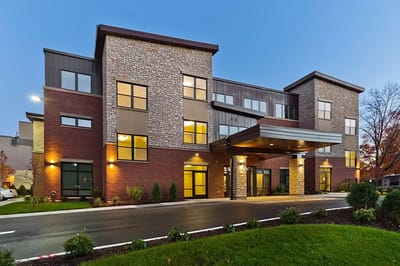
For four decades, Catholic Eldercare has been a haven of tranquility for countless seniors seeking a safe and nurturing abode in Northeast Minneapolis. As a distinguished institution in the world of senior care, this establishment offers an array of comprehensive services, including assisted living, independent living, skilled nursing, memory care, transitional care, adult day services, and pastoral care. The home has been providing exceptional services to people of all faiths, fostering a vibrant community of residents who cherish the spiritual, social, and recreational programs and activities that are available to them. 
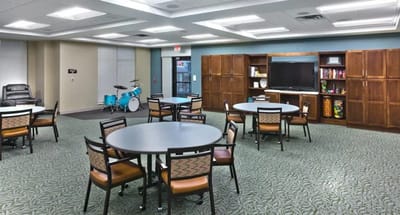
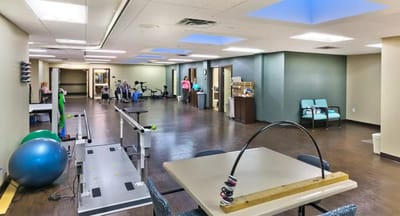
The care center provides a range of practical services to assist with everyday life, including housekeeping, shopping trips, outings, and laundry services, to name but a few. And with a comprehensive emergency call system and daily safety checks, family members can rest easy knowing their loved ones are in good hands. It also has state-of-the-art amenities, including physical, occupational, and speech therapies, daily music therapy sessions, and health monitoring and education to ensure that residents receive the best care possible. Aside from its robust medical and wellness offerings, Catholic Eldercare also caters to the creative and social needs of its residents through a variety of pursuits, including watercolor painting, poetry writing, and concerts.

Quality ratings

Measured by Centers for Medicare & Medicaid Services (CMS)

Overall rating Info The Overall CMS Rating combines results from health inspections, staffing levels and quality measures. Health inspections carry the most weight. Staffing and quality scores can increase or decrease the final rating based on performance compared to state and national standards.
▼ 37.1% Below MN avg. ▼ 37.1% Below MN avg.Click the badge to see the full State ranking.Click here to see the full State ranking.
Health Inspection Info Based on the results of the facility's three most recent standard inspections and any complaint investigations. CMS reviews the number, scope, and severity of deficiencies, with more recent findings weighted more heavily.
▼ 64.4% Below MN avg. ▼ 64.4% Below MN avg.Click the badge to see the full State ranking.Click here to see the full State ranking.
Staffing Info Measures average nursing staff hours per resident per day, including Registered Nurses (RNs) and total nursing staff. Ratings are adjusted based on the level of care residents require and are compared to state and national benchmarks.
▲ 22.1% Above MN avg. ▲ 22.1% Above MN avg.Click the badge to see the full State ranking.Click here to see the full State ranking.
Quality Measures Info Based on clinical and physical health indicators reported to CMS, such as hospital readmissions, falls, pressure ulcers, and improvements in mobility. These measures reflect how well residents' health needs are being managed.
▲ 59.9% Above MN avg. ▲ 59.9% Above MN avg.Click the badge to see the full State ranking.Click here to see the full State ranking.

Staffing hours breakdown

Info Daily nursing hours per resident by staff type, reported to CMS. Higher is generally better — compare this facility to state and national averages to see where staffing stands.

Hours per resident per day — compared to Minnesota state averages

Total nursing care / resident Info This home is ranked 34th out of 85 homes in Minnesota. Total adjusted nursing hours per resident per day, combining RN, LPN, and aide time. CMS adjusts this for case-mix so facilities can be fairly compared.
4h 49m per day
Rank #34 / 85Nurse hours — State benchmarkedThis home is ranked 34th out of 85 homes in Minnesota. Shows adjusted nurse hours per resident per day benchmarked to the Minnesota average, with a ranking across 85 Minnesota SNFs. More hours mean more direct care. The national average is about 3.5 hrs; below 3.0 is a red flag.Click the rank badge to see the full State ranking.Click here to see the full State ranking.
This facility Minnesota avg (4h 46m per day)
vs Minnesota avg
+1%

1 of 5 metrics below state avg

Standout metric Weekend RN is +24% above state avg
Staff typeHours / Day / Residentvs state avg
Registered Nurse (RN) Info RNs hold the highest nursing license and can assess residents, interpret test results, and direct care plans. More RN hours per day often signals stronger clinical oversight and faster response to health changes. 1h 17m per day ▲ 20% State avg: 1h 4m per day · National avg: 41m per day
LPN / LVN Info Licensed Practical Nurses (LPNs) or Licensed Vocational Nurses (LVNs) deliver routine hands-on care — medication administration, wound dressing, and monitoring vital signs. They work under RN supervision and make up a large share of daily bedside care. 24m per day ▼ 35% State avg: 37m per day · National avg: 52m per day
Nurse Aide Info Certified Nurse Aides (CNAs) provide the most direct day-to-day assistance: bathing, dressing, feeding, and mobility. Nurse aide hours are typically the largest staffing category and directly affect residents' quality of life. 2h 44m per day ▲ 7% State avg: 2h 33m per day · National avg: 2h 21m per day
Weekend Total Nursing Info Combined nursing hours (RN + LPN + Nurse Aide) per resident per day on weekends. Staffing often drops on weekends — this figure reveals whether the facility maintains adequate coverage outside of weekday hours. 3h 53m per day ▲ 5% State avg: 3h 41m per day · National avg: 3h 26m per day
Weekend RN Info Registered nurse hours specifically on weekends. Facilities sometimes reduce RN presence on Saturdays and Sundays — a low weekend RN figure compared to weekday hours can indicate reduced clinical oversight when most administrative staff are absent. 51m per day ▲ 24% State avg: 41m per day · National avg: 29m per day

Capacity and availability

This home usually has limited availability

Occupancy between 85% and 95% suggests balanced demand.

Higher occupancy than the Minnesota average: 79.7%
Occupancy rate 88.7% Rank #83 / 328Occupancy rate — State benchmarkedThis home is ranked 83rd out of 328 homes in Minnesota. Shows this facility's occupancy rate versus the Minnesota average, with its Statewide rank out of 328. Higher occupancy signals strong local demand and financial stability.Click the rank badge to see the full State ranking.Click here to see the full State ranking.
Avg. Length of Stay 115 days
Occupancy rate
88.7% Rank #83 / 328Occupancy rate — State benchmarkedThis home is ranked 83rd out of 328 homes in Minnesota. Shows this facility's occupancy rate versus the Minnesota average, with its Statewide rank out of 328. Higher occupancy signals strong local demand and financial stability.Click the rank badge to see the full State ranking.Click here to see the full State ranking.
Avg. Length of Stay
115 days
Walk Score
Walk Score: 82 / 100 Rank #33 / 633Walk Score — State benchmarkedThis home is ranked 33rd out of 633 homes in Minnesota. Shows how walkable this facility's neighborhood is compared to the average Walk Score across Minnesota SNFs. Higher scores benefit residents, families, and staff.Click the rank badge to see the full State ranking.Click here to see the full State ranking.
Very walkable. Most errands can be accomplished on foot, and many essentials are within a short walk.

About this community

Payment & Insurance

1 service
Accept Medicare

Therapy & Rehabilitation

2 services
Rehabilitation Services
Respite Care

Staffing & Medical

1 service
24-Hour Staffing

Additional Services

2 services
Adult Day Services
Transitional Care Services

Contact Catholic Eldercare

Staffing Data

Reporting period: October 1 – December 31, 2025 (Q4 2025). Source: CMS Payroll-Based Journal report.

Total staff 210
Employees 179
Contractors 31
Staff to resident ratio 1.29:1
41% worse than Minnesota average
Minnesota average ratio: 2.19:1 Minnesota average ratio: 2.19:1See full Minnesota ranking
Avg staff/day 93
Average shift 8 hours
7% better than Minnesota average
Minnesota average: 7.5 hours Minnesota average shift: 7.5 hoursSee full Minnesota ranking
Total staff hours (quarter) 68,749

Nursing staff breakdown

Q4 2025 · Oct 1 – Dec 31 More info This data comes from the CMS Payroll-Based Journal report covering October 1 – December 31, 2025.
Registered Nurse

Manages medical care and health needs.

RN Staff 39
Average shift length Info Average shift length. Calculated as total hours divided by days worked and average staff per day. 8.6 hours

No contractors work on this role.

Licensed Practical Nurse

Assists with medical care and medications.

LPN Staff 17
Average shift length Info Average shift length. Calculated as total hours divided by days worked and average staff per day. 8.8 hours

No contractors work on this role.

Certified Nursing Assistant

Helps with daily care and mobility.

CNA Staff 87
Average shift length Info Average shift length. Calculated as total hours divided by days worked and average staff per day. 7.9 hours

No contractors work on this role.

Contractor staffing

Q4 2025 · Oct 1 – Dec 31 More info This data comes from the CMS Payroll-Based Journal report covering October 1 – December 31, 2025.

Total hours from contractors

4.5%

3,116 contractor hours this quarter

Speech Language Pathologist: 8 Physical Therapy Aide: 6 Physical Therapy Assistant: 6 Respiratory Therapy Technician: 4 Occupational Therapy Assistant: 3 Qualified Social Worker: 3 Medical Director: 1

Staff by category

Q4 2025 · Oct 1 – Dec 31 More info This data comes from the CMS Payroll-Based Journal report covering October 1 – December 31, 2025.
Certified Nursing Assistant8708731,43792100%7.9
Registered Nurse3903912,75492100%8.6
Licensed Practical Nurse170175,96492100%8.8
Medication Aide/Technician110115,00992100%8.3
Clinical Nurse Specialist8083,4116975%7.8
Other Dietary Services Staff6062,3518592%7.8
Mental Health Service Worker4041,8566470%7.9
Occupational Therapy Aide3031,3076368%7.9
Speech Language Pathologist0881,0607177%7.2
Physical Therapy Assistant0668117683%6.1
Dietitian2025686368%8
Physical Therapy Aide0665457076%7
Nurse Practitioner1015126470%8
Administrator1014645863%8
Respiratory Therapy Technician0444356672%6.4
Qualified Social Worker0331866368%2.7
Occupational Therapy Assistant033673235%1.9
Medical Director0111233%4
87 Certified Nursing Assistant
% of Days 100%
39 Registered Nurse
% of Days 100%
17 Licensed Practical Nurse
% of Days 100%
11 Medication Aide/Technician
% of Days 100%
8 Clinical Nurse Specialist
% of Days 75%
6 Other Dietary Services Staff
% of Days 92%
4 Mental Health Service Worker
% of Days 70%
3 Occupational Therapy Aide
% of Days 68%
8 Speech Language Pathologist
% of Days 77%
6 Physical Therapy Assistant
% of Days 83%
2 Dietitian
% of Days 68%
6 Physical Therapy Aide
% of Days 76%
1 Nurse Practitioner
% of Days 70%
1 Administrator
% of Days 63%
4 Respiratory Therapy Technician
% of Days 72%
3 Qualified Social Worker
% of Days 68%
3 Occupational Therapy Assistant
% of Days 35%
1 Medical Director
% of Days 3%

Penalties and fines

Includes penalties issued in 2024

Federal penalties imposed by CMS for regulatory violations, including civil money penalties (fines) and denials of payment for new Medicare/Medicaid admissions.

Source: CMS Penalties Database (Data as of Jan 2026)

Total fines amount $47K Rank #70 / 86Federal fines — State benchmarkedThis home is ranked 70th out of 86 homes in Minnesota. Shows this facility's cumulative CMS federal fine dollars versus the Minnesota average among facilities with fines, and where it ranks among 86 skilled nursing facilities in the pool. Lower total dollars mean a better rank.Click the rank badge to see the full State ranking.Click here to see the full State ranking.
6% higher than Minnesota average

Minnesota average: $44K

Number of fines 2
In line with Minnesota average

Minnesota average: 2.0

Payment Denials Info Serious action where Medicare and/or Medicaid temporarily stops payments for new residents until issues are fixed. 0
100% fewer payment denials than Minnesota average

Minnesota average: 0.4

Fines amount comparison
This facility $47K
Minnesota average $44K
Penalty History

Penalties are imposed by CMS for violations of federal nursing home regulations.

1 penalty in the past 3 years

Oct 18, 2024 · $37K

Civil Money Penalty Info Fines imposed for noncompliance, which can be assessed per day or per instance of violation. Oct 18, 2024
$37K

Last updated: Jan 2026

Quality of care over time

These measures show how residents usually do over time at this home, based on health outcomes and preventive care.

High-risk clinical events score Info A composite score based on pressure ulcers, falls with injury, weight loss, walking ability decline, and activities of daily living decline. 10.3
8% better than Minnesota average

Minnesota average: 11.1

Functional decline score Info A composite score based on activities of daily living decline, walking ability decline, and incontinence. 20.5
9% better than Minnesota average

Minnesota average: 22.6

Long-stay resident measures
Below average Minnesota avg: 2.6 Info CMS star rating based on long-stay quality measure performance. 5 stars = significantly above average, 1 star = significantly below average.
Need for Help with Daily Activities Increased Info Percent of long-stay residents whose need for help with daily activities has increased 16.6%
12% better than Minnesota average

Minnesota average: 18.9%

Walking Ability Worsened Info Percent of long-stay residents whose ability to move independently worsened 20.8%
13% better than Minnesota average

Minnesota average: 23.8%

Low Risk Residents with Bowel/Bladder Incontinence Info Percent of low risk long-stay residents who lose control of their bowels or bladder 24.1%
In line with Minnesota average

Minnesota average: 25.0%

Falls with Major Injury Info Percent of long-stay residents experiencing one or more falls with major injury 3.5%
8% better than Minnesota average

Minnesota average: 3.7%

High Risk Residents with Pressure Ulcers Info Percent of long-stay high risk residents with pressure ulcers 3.1%
42% better than Minnesota average

Minnesota average: 5.4%

Urinary Tract Infection Info Percent of long-stay residents with a urinary tract infection 1.8%
33% better than Minnesota average

Minnesota average: 2.7%

Lost Too Much Weight Info Percent of long-stay residents who lose too much weight 7.4%
79% worse than Minnesota average

Minnesota average: 4.1%

Depressive Symptoms Info Percent of long-stay residents who have depressive symptoms 7.7%
77% worse than Minnesota average

Minnesota average: 4.4%

Antipsychotic Use Info Percent of long-stay residents who received an antipsychotic medication 23.1%
34% worse than Minnesota average

Minnesota average: 17.2%

Pneumococcal Vaccine Info Percent of long-stay residents assessed and appropriately given the pneumococcal vaccine 91.8%
6% worse than Minnesota average

Minnesota average: 97.3%

Influenza Vaccine Info Percent of long-stay residents assessed and appropriately given the seasonal influenza vaccine 96.0%
In line with Minnesota average

Minnesota average: 96.0%

Hospitalizations per 1,000 days Info Number of hospitalizations per 1,000 long-stay resident days. 1.75
5% worse than Minnesota average

Minnesota average: 1.67

ED visits per 1,000 days Info Number of outpatient emergency department visits per 1,000 long-stay resident days. 1.41
29% better than Minnesota average

Minnesota average: 1.99

Short-stay resident measures
Significantly above average Minnesota avg: 3.1 Info CMS star rating based on short-stay quality measure performance. 5 stars = much above average, 1 star = much below average.
Pneumococcal Vaccine Info Percent of short-stay residents assessed and appropriately given the pneumococcal vaccine 83.3%
6% worse than Minnesota average

Minnesota average: 88.9%

Antipsychotic medication increase Info Percent of short-stay residents who newly received an antipsychotic medication 1.3%
31% better than Minnesota average

Minnesota average: 1.9%

Influenza Vaccine Info Percent of short-stay residents assessed and appropriately given the seasonal influenza vaccine 76.4%
7% worse than Minnesota average

Minnesota average: 82.6%

Re-hospitalized after SNF stay Info Percentage of short-stay residents who were re-hospitalized after their nursing home admission. 23.5%
In line with Minnesota average

Minnesota average: 23.1%

Emergency department visits Info Percentage of short-stay residents who had an outpatient emergency department visit. 5.4%
61% better than Minnesota average

Minnesota average: 14.0%

Falls with major injury Info Percentage of SNF residents who experience falls with major injury during their stay. 0.0%
100% better than Minnesota average

Minnesota average: 0.8%

Ability to care for self at discharge Info Percentage of residents at or above expected ability to care for themselves at discharge. 57.1%
6% better than Minnesota average

Minnesota average: 53.7%

Successful return to home or community Info Rate of successful return to home or community from a skilled nursing facility. 63.7%
26% better than Minnesota average

Minnesota average: 50.6%

Breakdown by payment type

Medicare

25% of new residents, usually for short-term rehab.

Typical stay 20 days

Private pay

70% of new residents, often for short stays.

Typical stay 3 - 4 months

Medicaid

5% of new residents, often for long-term daily care.

Typical stay 5 years

Facility Characteristics

Source: CMS Long-Term Care Facility Characteristics (Data as of Jan 2026)

Total residents 163
Medicare
11
6.7% of residents
Medicaid
98
60.1% of residents
Private pay or other
54
33.1% of residents
Programs & Services
Residents Group

Residents meet regularly to discuss policies, care quality, and activities

Family Member Group

Family members meet regularly to discuss policies, care quality, and activities

Active Family Council

Organized group of family members that meets regularly to discuss facility policies, resident care, and activities.

Active Resident Council

Organized group of residents that meets regularly to discuss facility policies, quality of life, and activities.

Finances and operations

Voluntary non-profit community
Home revenue
$22.9M
Surplus of revenue
$1.2M
Voluntary non-profit community
Home revenue
$22.9M Rank #18 / 85Revenue — State benchmarkedThis home is ranked 18th out of 85 homes in Minnesota. Shows this facility's annual revenue compared to the Minnesota SNF average. Higher revenue generally means more resources for staffing and capital — read alongside Payroll %.Click the rank badge to see the full State ranking.Click here to see the full State ranking.
Surplus of revenue
$1.2M
Payroll costs Info The portion of the home's budget spent on staff, including nurses, caregivers, and other employees who support care and operations. Rank #8 / 85Payroll — State benchmarkedThis home is ranked 8th out of 85 homes in Minnesota. Shows total annual staff payroll benchmarked to the Minnesota average. Higher payroll investment relative to peers often signals better staffing and less reliance on cheaper contract labor.Click the rank badge to see the full State ranking.Click here to see the full State ranking.
$15.3M
66.7% of revenue Rank #13 / 85Payroll % — State benchmarkedThis home is ranked 13th out of 85 homes in Minnesota. Shows payroll as a percentage of revenue versus the Minnesota average. Well-run Minnesota SNFs typically land around 61–68% — the top third Statewide. Below 25% may signal understaffing or heavy agency use — read with Staffing ratings.Click the rank badge to see the full State ranking.Click here to see the full State ranking.
Other operating costs Info All remaining costs needed to run the home, such as food, utilities, building maintenance, supplies and administrative expenses.
$6.4M
Total costs $21.7M

Who this home usually serves

TYPE OF STAY

Primarily short stays

Residents typically stay for brief periods, with frequent admissions and discharges throughout the year.

Managed by Marie Barta

Campus Administrator

Marie Barta brings three decades of success in the senior care industry, progressing from nursing assistant to campus administrator. She has led organizations to Five Star Status and national quality awards while strengthening operations. Marie is committed to innovative leadership and staff development to deliver excellent care to residents, balancing professional dedication with an active personal life.

Places of interest near Catholic Eldercare

Address 1.3 miles from city center Info Estimated distance in miles from Minneapolis's city center to Catholic Eldercare's address, calculated via Google Maps. — 1.53 miles to nearest hospital (Midwest Podiatry Centers - Downtown Minneapolis)

Calculate Travel Distance to Catholic Eldercare

Add your location

Address

Financial Assistance for
Nursing Home in Minnesota

Catholic Eldercare is located in Minneapolis, Minnesota.
Here are the financial assistance programs available to residents in Minnesota.

Get Financial aid guidance

Elderly Waiver

Minnesota Medicaid EW

Age 65+
General Minnesota resident, Medicaid-eligible, nursing home-level care need.
Income Limits (2025) ~$2,829/month 300% FBR, individual
Asset Limits $3,000 individual, higher than most states
MN

Higher asset limit; rural access focus.

Benefits
Personal care (5-7 hours/day) Respite (240 hours/year) Adult day care (~$70/day) Home aides

Essential Community Supports (ECS)

Minnesota ECS

Age 65+
General Minnesota resident, at risk of decline but not nursing home level.
Income Limits ~$1,732/month individual, varies
Asset Limits $3,000 individual
MN

Bridges gap for those ineligible for waivers.

Benefits
In-home support (2-4 hours/week) Respite (up to 5 days/year) Transportation (~5 trips/month)

Alternative Care (AC) Program

Minnesota Alternative Care Program

Age 65+
General Minnesota resident, NFLOC, not MA-eligible.
Income Limits (2025) ~$1,255-$2,829/month (100%-300% FPL); sliding scale copays.
Asset Limits $3,000 (individual); home equity limit $713,000.
MN

CDCS option; statewide via counties.

Benefits
Personal care (4-6 hours/day) Respite (~5 days/year) Home health Meals Home mods

Minnesota Senior Health Options (MSHO)

Minnesota Senior Health Options

Age 65+
General Minnesota resident, eligible for MA and Medicare Parts A/B.
Income Limits (2025) ~$1,255/month (100% FPL for MA); spenddown allowed.
Asset Limits $3,000 (individual), $6,000 (couple).
MN

7 health plans (e.g., UCare, HealthPartners); care coordinator assigned.

Benefits
Personal care (5-7 hours/day) Medical care Respite Adult day care Home mods $900/year groceries (some plans)

Minnesota Senior Care Plus (MSC+)

Minnesota Senior Care Plus

Age 65+
General Minnesota resident, MA-eligible, not on Medicare.
Income Limits (2025) ~$1,255/month (100% FPL); spenddown allowed.
Asset Limits $3,000 (individual), $6,000 (couple).
MN

Includes EW services; 7 health plans available.

Benefits
Personal care (5-7 hours/day) Respite Adult day care Home mods Limited nursing home care

Consumer Support Grant (CSG)

Minnesota Consumer Support Grant

Age 65+ or disabled
General Minnesota resident, eligible for MA personal care but opts for grant.
Income Limits (2025) ~$1,255/month (MA-eligible); spenddown allowed.
Asset Limits $3,000 individual
MN

Can hire family; statewide via counties.

Benefits
Cash (~$500-$1,500/month) for personal care Respite Home mods Assistive tech

Medicare Savings Program (MSP)

Minnesota Medicare Savings Program

Age 65+ or disabled
General Minnesota resident, Medicare Part A/B.
Income Limits (2025) ~$2,510/month (QMB), ~$3,380/month (SLMB), ~$3,598/month (QI)—individual.
Asset Limits $9,430 (individual), $14,130 (couple).
MN

Three tiers; no waitlist; includes Extra Help for Part D.

Benefits
Covers Part B premiums ($174.70/month) Deductibles ($240/year) Copays (~20%)

VA Aid and Attendance (A&A) and Housebound Benefits

Minnesota VA Aid and Attendance/Housebound

Age 65+ or disabled veteran/spouse
General Minnesota resident, wartime service, need for ADL help (A&A) or homebound.
Income Limits (2025) Net income < ~$1,984/month (veteran with dependent, A&A); pension offsets income.
Asset Limits ~$155,356 net worth limit
MN

High veteran demand in rural/urban areas.

Benefits
Cash (~$1,433-$2,642/month veteran, ~$951-$1,318 spouse) for care costs (e.g., in-home, assisted living)

Compare Nursing Home around Minneapolis

The information below is reported by the Minnesota Department of Health, Health Regulation Division.

5 facilities compared · CMS & MN Dept. of Health data

Filter by care type
Mount Olivet Careview Home
NH

Nursing Home Licensed facility providing 24/7 skilled nursing care for residents with complex, ongoing medical needs. Staffed by RNs, LPNs, and CNAs. Inspected and star-rated annually by CMS. Accepts Medicare (short-term rehab) and Medicaid (long-term care).

AL

Assisted Living A licensed, long-term care setting for seniors or individuals with disabilities who need help with daily activities — like bathing, dressing, and medication management — but not 24-hour skilled nursing. Offers housing, meals, and around-the-clock support while aiming to maximize resident independence.

Minneapolis (Southwest Minneapolis)155 96.6% +21%5.39 +20%+13%$55.0k182.31148A+ 76 Sharon Flack$28.3M$17.8M62.9%245071
Jones-Harrison Senior Living
NH

Nursing Home Licensed facility providing 24/7 skilled nursing care for residents with complex, ongoing medical needs. Staffed by RNs, LPNs, and CNAs. Inspected and star-rated annually by CMS. Accepts Medicare (short-term rehab) and Medicaid (long-term care).

AL

Assisted Living A licensed, long-term care setting for seniors or individuals with disabilities who need help with daily activities — like bathing, dressing, and medication management — but not 24-hour skilled nursing. Offers housing, meals, and around-the-clock support while aiming to maximize resident independence.

IL

Independent Living Lifestyle-focused communities for older adults offering dining, activities, and transportation with minimal personal care. Best for active, independent seniors who want community without medical support.

MC

Memory Care Secured, specialized care for people living with Alzheimer's or dementia. Staff trained in cognitive impairment, with higher staff-to-resident ratios and an environment designed to reduce confusion and wandering risk.

Minneapolis (Calhoun Isles)53 92.5% +16%5.11 +38%+7%$0354.4-49A+ 56 Marcia Diracles$18.9M$12.4M65.9%245460
New Perspective Arden Hills
NH

Nursing Home Licensed facility providing 24/7 skilled nursing care for residents with complex, ongoing medical needs. Staffed by RNs, LPNs, and CNAs. Inspected and star-rated annually by CMS. Accepts Medicare (short-term rehab) and Medicaid (long-term care).

AL

Assisted Living A licensed, long-term care setting for seniors or individuals with disabilities who need help with daily activities — like bathing, dressing, and medication management — but not 24-hour skilled nursing. Offers housing, meals, and around-the-clock support while aiming to maximize resident independence.

IL

Independent Living Lifestyle-focused communities for older adults offering dining, activities, and transportation with minimal personal care. Best for active, independent seniors who want community without medical support.

MC

Memory Care Secured, specialized care for people living with Alzheimer's or dementia. Staff trained in cognitive impairment, with higher staff-to-resident ratios and an environment designed to reduce confusion and wandering risk.

Arden Hills160 61.3% -23%4.92 -26%+3%$0223.7198A+ 33 Justin Birkeli$31.8M$16.5M52%245424
Benedictine Living Community-Minneapolis
NH

Nursing Home Licensed facility providing 24/7 skilled nursing care for residents with complex, ongoing medical needs. Staffed by RNs, LPNs, and CNAs. Inspected and star-rated annually by CMS. Accepts Medicare (short-term rehab) and Medicaid (long-term care).

AL

Assisted Living A licensed, long-term care setting for seniors or individuals with disabilities who need help with daily activities — like bathing, dressing, and medication management — but not 24-hour skilled nursing. Offers housing, meals, and around-the-clock support while aiming to maximize resident independence.

Minneapolis (Central Minneapolis)90 85.8% +8%3.64 +122%-24%$84.8k333.7286- 80 Jeffrey Benson$14.8M$9.5M64%245266
Catholic Eldercare
NH

Nursing Home Licensed facility providing 24/7 skilled nursing care for residents with complex, ongoing medical needs. Staffed by RNs, LPNs, and CNAs. Inspected and star-rated annually by CMS. Accepts Medicare (short-term rehab) and Medicaid (long-term care).

AL

Assisted Living A licensed, long-term care setting for seniors or individuals with disabilities who need help with daily activities — like bathing, dressing, and medication management — but not 24-hour skilled nursing. Offers housing, meals, and around-the-clock support while aiming to maximize resident independence.

Minneapolis (St. Anthony West)174 88.7% +11%4.82 +31%+1%$47.1k294.81153- 82 John Bauer$22.9M$15.3M66.7%245439

Frequently Asked Questions about Catholic Eldercare

What neighborhood is Catholic Eldercare in?

Catholic Eldercare is in the St. Anthony West neighborhood.

Is Catholic Eldercare in a walkable area?

Catholic Eldercare has a walk score of 82. Very walkable. Most errands can be accomplished on foot, and many essentials are within a short walk.

What is the occupancy rate at Catholic Eldercare?

Catholic Eldercare's occupancy is 88.7%.

Are there photos of Catholic Eldercare?

Yes — there are 2 photos of Catholic Eldercare in the photo gallery on this page.

Is Catholic Eldercare Medicare or Medicaid certified?

Yes — Catholic Eldercare is a CMS-certified provider of Medicare and Medicaid.

Guides for Better Senior Living

Care Cost Calculator: See Prices in Your Area

Nursing Home Data Explorer

Don’t Wait Too Long: 7 Red Flag Signs Your Parent Needs Assisted Living Now

The True Cost of Assisted Living in 2025 – And How Families Are Paying For It

Understanding Senior Living Costs: Pricing Models, Discounts & Financial Assistance

Explore Open Rooms
1 Contact details
2 What type of senior care service are you looking for?
3 What budget do you have in mind for senior care?
4 How soon do you need to find care?
5 Additional details

Thank you for your interest!

Our team will be in touch shortly to help with next steps.