Mount Olivet Careview Home
Nursing Home, Assisted Living, Memory Care, Nursing Care & Residential Care · Minneapolis, MN
CMS overall rating Info CMS (the Centers for Medicare & Medicaid Services) is the federal agency that rates nursing home quality. Its Overall Rating runs from 1 to 5 stars, combining health inspections, staffing, and quality measures, with inspections weighted most heavily.

Mount Olivet Careview Home

Nursing Home, Assisted Living, Memory Care, Nursing Care & Residential Care · Minneapolis, MN
CMS overall rating Info CMS (the Centers for Medicare & Medicaid Services) is the federal agency that rates nursing home quality. Its Overall Rating runs from 1 to 5 stars, combining health inspections, staffing, and quality measures, with inspections weighted most heavily.
Calculator: See prices in your area
Mount Olivet Careview Home accepts Medicare, Medicaid, and private pay.

Overview of Mount Olivet Careview Home

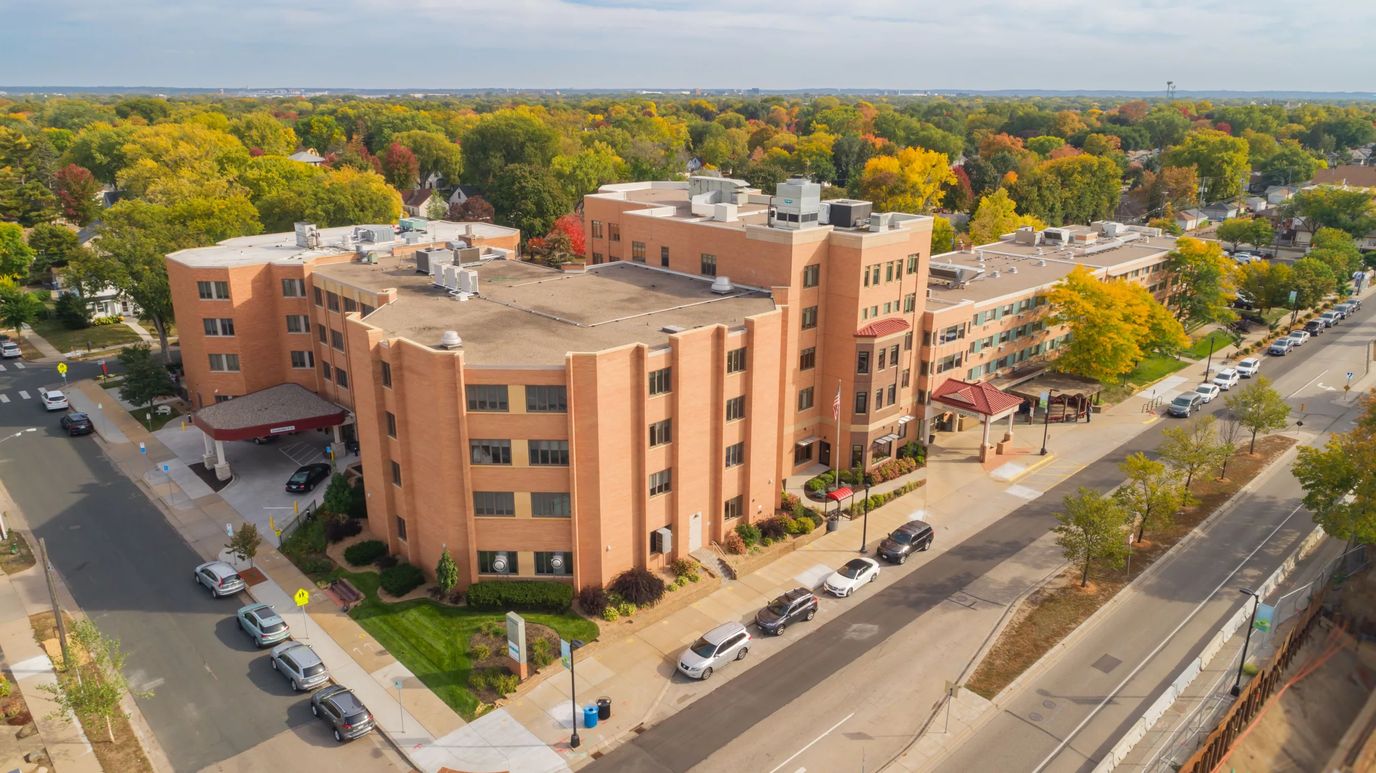
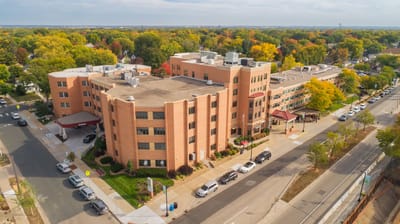
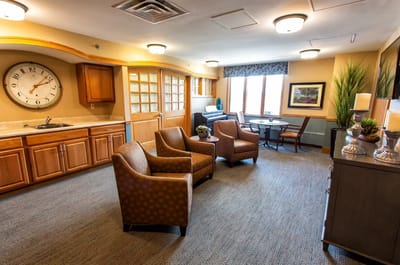
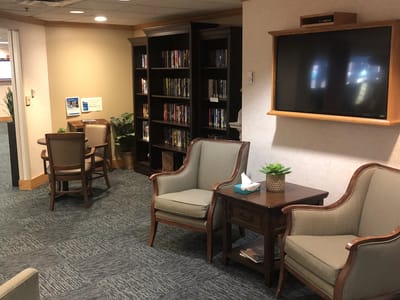
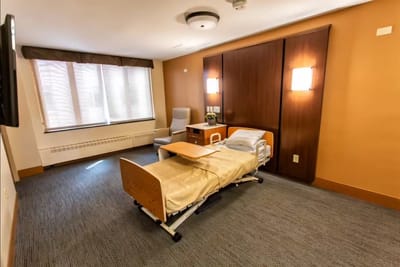
Located in the beautiful southwest Minneapolis neighborhood, you can find this beautiful home called Mount Olivet Careview Home. They offer a continuum of care, including an Adult Day Program, Semi-independent living in Mount Olivet Home, and long term skilled nursing and short term Transitional Care in Mount Olivet Careview Home. Memory Care and Hospice Care is available in both buildings.

Mount Olivet Careview Home is a not-profit care community which has been serving seniors for over 60 years.

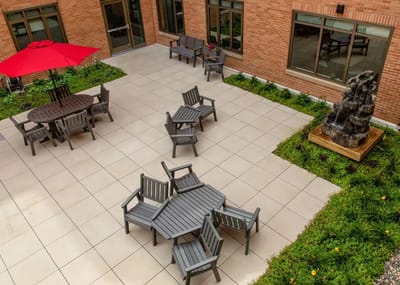
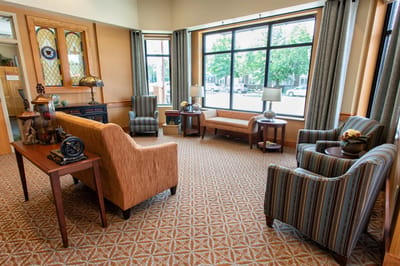
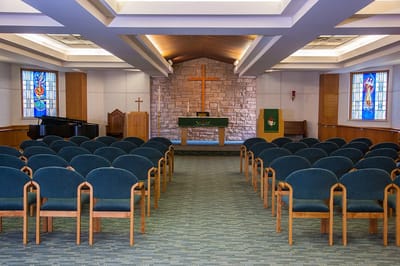
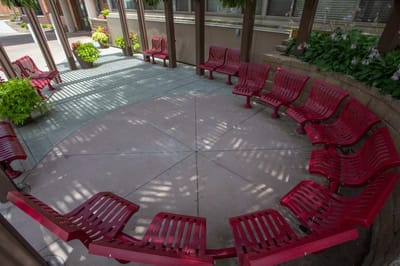
At Mount Olivet Careview Home, they have a dedicated staff that’s compassionate and ready to go above and beyond to provide for the needs of their residents.  Their mission is to give holistic support, ensuring all the aspects of their lives are cared for. They also offer various amenities including daily nutritious meals, laundry and housekeeping services, spiritual support and recreational, social, and educational activities and programs.

Mount Olivet Careview Home is a beacon of hope to families looking for a reliable care home for their loved ones.

Quality ratings

Measured by Centers for Medicare & Medicaid Services (CMS)

Overall rating Info The Overall CMS Rating combines results from health inspections, staffing levels and quality measures. Health inspections carry the most weight. Staffing and quality scores can increase or decrease the final rating based on performance compared to state and national standards.
▲ 25.7% Above MN avg. ▲ 25.7% Above MN avg.MN average: 3.2Click the badge to see the full State ranking.Click here to see the full State ranking.
Health Inspection Info Based on the results of the facility's three most recent standard inspections and any complaint investigations. CMS reviews the number, scope, and severity of deficiencies, with more recent findings weighted more heavily.
▲ 6.8% Above MN avg. ▲ 6.8% Above MN avg.MN average: 2.8Click the badge to see the full State ranking.Click here to see the full State ranking.
Staffing Info Measures average nursing staff hours per resident per day, including Registered Nurses (RNs) and total nursing staff. Ratings are adjusted based on the level of care residents require and are compared to state and national benchmarks.
▲ 22.1% Above MN avg. ▲ 22.1% Above MN avg.MN average: 4.1Click the badge to see the full State ranking.Click here to see the full State ranking.
Quality Measures Info Based on clinical and physical health indicators reported to CMS, such as hospital readmissions, falls, pressure ulcers, and improvements in mobility. These measures reflect how well residents' health needs are being managed.
▲ 27.9% Above MN avg. ▲ 27.9% Above MN avg.MN average: 3.1Click the badge to see the full State ranking.Click here to see the full State ranking.

Staffing hours breakdown

Info Daily nursing hours per resident by staff type, reported to CMS. Higher is generally better — compare this facility to state and national averages to see where staffing stands.

Hours per resident per day — compared to Minnesota state averages

Total nursing care / resident Info This home is ranked 15th out of 89 homes in Minnesota for nurse hours. Total adjusted nursing hours per resident per day, combining RN, LPN, and aide time. CMS adjusts this for case-mix so facilities can be fairly compared.
5h 23m per day
Rank #15 / 89Nurse hours — State benchmarkedThis home is ranked 15th out of 89 homes in Minnesota. Shows adjusted nurse hours per resident per day benchmarked to the Minnesota average, with a ranking across 89 Minnesota facilities. More hours mean more direct care. The national average is about 3.5 hrs; below 3.0 is a red flag.Rankings are based only on facilities in Minnesota that report data for that category. Facilities without available data are excluded from the ranking.Click the rank badge to see the full State ranking.Click here to see the full State ranking.
This facility Minnesota avg (4h 46m per day)
vs Minnesota avg
+13%

1 of 6 metrics below state avg

Standout metric Weekend RN is +46% above state avg
Staff type Hours / Day / Resident vs state avg
Registered Nurse (RN) Info RNs hold the highest nursing license and can assess residents, interpret test results, and direct care plans. More RN hours per day often signals stronger clinical oversight and faster response to health changes. 1h 20m per day ▲ 25% State avg: 1h 4m per day · National avg: 41m per day
LPN / LVN Info Licensed Practical Nurses (LPNs) or Licensed Vocational Nurses (LVNs) deliver routine hands-on care — medication administration, wound dressing, and monitoring vital signs. They work under RN supervision and make up a large share of daily bedside care. 33m per day ▼ 11% State avg: 37m per day · National avg: 52m per day
Nurse Aide Info Certified Nurse Aides (CNAs) provide the most direct day-to-day assistance: bathing, dressing, feeding, and mobility. Nurse aide hours are typically the largest staffing category and directly affect residents' quality of life. 3h 25m per day ▲ 34% State avg: 2h 33m per day · National avg: 2h 20m per day
Weekend Total Nursing Info Combined nursing hours (RN + LPN + Nurse Aide) per resident per day on weekends. Staffing often drops on weekends — this figure reveals whether the facility maintains adequate coverage outside of weekday hours. 4h 56m per day ▲ 34% State avg: 3h 41m per day · National avg: 3h 26m per day
Physical Therapist Info Hours per resident per day provided by licensed Physical Therapists (PTs) or PT Assistants. PT services help residents recover mobility after injury or illness and are especially important for post-acute (short-stay) rehabilitation. 4m per day ▲ 11% State avg: 4m per day · National avg: 4m per day
Weekend RN Info Registered nurse hours specifically on weekends. Facilities sometimes reduce RN presence on Saturdays and Sundays — a low weekend RN figure compared to weekday hours can indicate reduced clinical oversight when most administrative staff are absent. 1h 0m per day ▲ 46% State avg: 41m per day · National avg: 28m per day

Capacity and availability

Avg. Length of Stay
132 days
Bed community size
155-bed community Rank #33 / 532Bed count — State benchmarkedThis home is ranked 33rd out of 532 homes in Minnesota. Shows this facility's certified or reported bed count compared to other Minnesota facilities. Larger communities may offer more amenities, programs, and on-site services for residents and families.Rankings are based only on facilities in Minnesota that report data for that category. Facilities without available data are excluded from the ranking.Click the rank badge to see the full State ranking.Click here to see the full State ranking.
A large-scale community that may provide a wide range of amenities, services, and structured programs.
Walk Score
Walk Score: 76 / 100 Rank #71 / 632Walk Score — State benchmarkedThis home is ranked 71st out of 632 homes in Minnesota. Shows how walkable this facility's neighborhood is compared to the average Walk Score across Minnesota facilities. Higher scores benefit residents, families, and staff.Rankings are based only on facilities in Minnesota that report data for that category. Facilities without available data are excluded from the ranking.Click the rank badge to see the full State ranking.Click here to see the full State ranking.
Very walkable. Most errands can be accomplished on foot, and many essentials are within a short walk.

About this community

License Details

CMS Certification Number245071

Staffing

Key information about the people who lead and staff this community.

Leadership

ContactTom Litecky, Marketing

Therapy & Rehabilitation

1 service
Rehabilitation Services

Amenities & Lifestyle

Specific ProgramsBoard and Care, Transitional Care, Mount Olivet Day Services, On-Site Health Services, Family Hub, Caregiver Support Group

Contact Mount Olivet Careview Home

Inspection History

In Minnesota, the Department of Health, Health Regulation Division is the primary authority for conducting onsite inspections and reporting on the quality of care in residential facilities.

Since 2022 · 4 years of data 20 deficiencies 10 inspections

Inspection Scorecard Info This scorecard compares key inspection, deficiency, and complaint metrics at this facility against the Minnesota state average. Metrics rated ≥15% worse than average are highlighted in red; those ≥15% better are highlighted in green.

Since 2022 vs. Minnesota state average
Overall vs. MN average 3 Worse Metrics worse than Minnesota average:
• Total deficiencies (100% above)
• Deficiencies per year (100% above)
• Total inspections (900% above)
1 Better Metrics better than Minnesota average:
• Deficiencies per inspection (80% below)
Latest Inspection November 18, 2025 Complaint Investigation

Deficiencies Info Deficiencies are formal regulatory issues recorded during state inspections.

This Facility MN Average vs. MN Avg
Total deficiencies Info Formal regulatory issues recorded by inspectors across all inspection types. 20 10 This facility has 100% more total deficiencies than a typical Minnesota nursing home (20 vs. MN avg 10).↑ 100% worse
Deficiencies per year Info Average deficiencies per year since 2022. 5 2.5 This facility has 100% more deficiencies per year than a typical Minnesota nursing home (5 vs. MN avg 2.5).↑ 100% worse
Deficiencies per inspection Info Average deficiencies per inspection. 2 10 This facility has 80% fewer deficiencies per inspection than a typical Minnesota nursing home (2 vs. MN avg 10).↓ 80% better

Inspections Info State inspections evaluate whether the facility meets health and safety standards.

This Facility MN Average vs. MN Avg
Total inspections Info Combined count of all routine and focused inspections. Excludes complaint investigations. 10 1 This facility has 900% more total inspections than a typical Minnesota nursing home (10 vs. MN avg 1).↑ 900% worse

Health Inspection History

Inspections since 2022
Total health inspections 8

Minnesota average 6


Last Health inspection on Jan 2025

Total health citations
18 Rank #28 / 90Health citations — State benchmarkedThis home is ranked 28th out of 90 homes in Minnesota. Shows this facility's total health deficiency citations benchmarked to the Minnesota State average, with a ranking across all 90 MN facilities. Lower citation counts earn a better rank.Rankings are based only on facilities in Minnesota that report data for that category. Facilities without available data are excluded from the ranking.Click the rank badge to see the full State ranking.Click here to see the full State ranking.

Minnesota average 23.2

Citations per inspection
2.25 Rank #13 / 90Citations per inspection — State benchmarkedThis home is ranked 13th out of 90 homes in Minnesota. Shows average deficiency citations per CMS inspection for this facility versus the Minnesota mean across 90 facilities with citation data. Lower is better.Rankings are based only on facilities in Minnesota that report data for that category. Facilities without available data are excluded from the ranking.Click the rank badge to see the full State ranking.Click here to see the full State ranking.

Minnesota average 3.76


Health citations are formal notices following inspections when they fail to comply with safety and care standards.

10 of 18 citations resulted from standard inspections; and 8 of 18 resulted from complaint investigations.

Breakdown of citation severity (last 4 years)
Critical health citations
1
43% worse than Minnesota average

Minnesota average: 0.7


Serious health citations
0
100% better than Minnesota average

Minnesota average: 0.5

1 critical citation Minnesota average: 0.7

0 serious citations Minnesota average: 0.5

17 moderate citations Minnesota average: 21.2

0 minor citations Minnesota average: 0.8
Citations history (last 4 years)
Infection Control moderate citation Jan 16, 2025
Corrected

Nutrition moderate citation Jan 16, 2025
Corrected

Quality of Care moderate citation Jan 16, 2025
Corrected

Quality of Care moderate citation Jan 16, 2025
Corrected

Staffing Data

Reporting period: October 1 – December 31, 2025 (Q4 2025). Source: CMS Payroll-Based Journal report.

Total staff 311
Employees 281
Contractors 30
Staff to resident ratio 2.10 : 1
0% compared with Minnesota average
Minnesota average ratio: 2.19 : 1 Minnesota average ratio: 2.19 : 1See full Minnesota ranking
Avg staff/day 121
Average shift 7.3 hours
0% compared with Minnesota average
Minnesota average: 7.5 hours Minnesota average shift: 7.5 hoursSee full Minnesota ranking
Total staff hours (quarter) 80,785

Nursing staff breakdown

Q4 2025 · Oct 1 – Dec 31 More info This data comes from the CMS Payroll-Based Journal report covering October 1 – December 31, 2025.
Registered Nurse

Manages medical care and health needs.

RN Staff Info All 53 RN Staff are full-time employees. No contractors work on this role. 53
Average shift length Info Average shift length. Calculated as total hours divided by days worked and average staff per day. 7.8 hours
Licensed Practical Nurse

Assists with medical care and medications.

LPN Staff Info All 25 LPN Staff are full-time employees. No contractors work on this role. 25
Average shift length Info Average shift length. Calculated as total hours divided by days worked and average staff per day. 7.9 hours
Certified Nursing Assistant

Helps with daily care and mobility.

CNA Staff Info All 147 CNA Staff are full-time employees. No contractors work on this role. 147
Average shift length Info Average shift length. Calculated as total hours divided by days worked and average staff per day. 7.4 hours

Contractor staffing

Q4 2025 · Oct 1 – Dec 31 More info This data comes from the CMS Payroll-Based Journal report covering October 1 – December 31, 2025.

Total hours from contractors

5.5%

4,431 contractor hours this quarter

Respiratory Therapy Technician: 12 Speech Language Pathologist: 6 Physical Therapy Assistant: 5 Qualified Social Worker: 3 Physical Therapy Aide: 3 Clinical Nurse Specialist: 1

Staff by category

Q4 2025 · Oct 1 – Dec 31 More info This data comes from the CMS Payroll-Based Journal report covering October 1 – December 31, 2025.
Certified Nursing Assistant 147 0 147 40,544 92 100% 7.4
Registered Nurse 53 0 53 15,192 92 100% 7.8
Licensed Practical Nurse 25 0 25 7,324 92 100% 7.9
Medication Aide/Technician 28 0 28 5,191 92 100% 7.6
Other Dietary Services Staff 9 0 9 3,467 90 98% 8
Clinical Nurse Specialist 10 1 11 2,549 64 70% 5.1
Mental Health Service Worker 4 0 4 1,267 62 67% 5.7
Physical Therapy Assistant 0 5 5 1,201 69 75% 7.1
Speech Language Pathologist 0 6 6 1,174 79 86% 6.9
Respiratory Therapy Technician 0 12 12 997 80 87% 6.7
Physical Therapy Aide 0 3 3 451 59 64% 6.4
Administrator 2 0 2 428 64 70% 3.9
Qualified Social Worker 0 3 3 400 62 67% 6.1
Nurse Practitioner 1 0 1 216 55 60% 3.9
Dietitian 1 0 1 211 55 60% 3.8
Dental Services Staff 1 0 1 173 57 62% 3
147 Certified Nursing Assistant
% of Days 100%
53 Registered Nurse
% of Days 100%
25 Licensed Practical Nurse
% of Days 100%
28 Medication Aide/Technician
% of Days 100%
9 Other Dietary Services Staff
% of Days 98%
11 Clinical Nurse Specialist
% of Days 70%
4 Mental Health Service Worker
% of Days 67%
5 Physical Therapy Assistant
% of Days 75%
6 Speech Language Pathologist
% of Days 86%
12 Respiratory Therapy Technician
% of Days 87%
3 Physical Therapy Aide
% of Days 64%
2 Administrator
% of Days 70%
3 Qualified Social Worker
% of Days 67%
1 Nurse Practitioner
% of Days 60%
1 Dietitian
% of Days 60%
1 Dental Services Staff
% of Days 62%

Penalties and fines

Includes penalties issued in 2024

Federal penalties imposed by CMS for regulatory violations, including civil money penalties (fines) and denials of payment for new Medicare/Medicaid admissions.

Source: CMS Penalties Database (Data as of Jan 2026)

Total fines amount $55K Rank #75 / 90Federal fines — State benchmarkedThis home is ranked 75th out of 90 homes in Minnesota. Shows this facility's cumulative CMS federal fine dollars versus the Minnesota average among facilities with fines, and where it ranks among 90 facilities in the pool. Lower total dollars mean a better rank.Rankings are based only on facilities in Minnesota that report data for that category. Facilities without available data are excluded from the ranking.Click the rank badge to see the full State ranking.Click here to see the full State ranking.
24% higher than Minnesota average

Minnesota average: $44K

Number of fines 1
50% fewer fines than Minnesota average

Minnesota average: 2.0

Payment Denials Info Serious action where Medicare and/or Medicaid temporarily stops payments for new residents until issues are fixed. 0
100% fewer payment denials than Minnesota average

Minnesota average: 0.4

Fines amount comparison
This facility $55K
Minnesota average $44K
Penalty History

Penalties are imposed by CMS for violations of federal nursing home regulations.

1 penalty in the past 3 years

Jun 4, 2024 · $55K

Civil Money Penalty Info Fines imposed for noncompliance, which can be assessed per day or per instance of violation. Jun 4, 2024
$55K

Last updated: Jan 2026

Quality of care over time

These measures show how residents usually do over time at this home, based on health outcomes and preventive care.

High-risk clinical events score Info A composite score based on pressure ulcers, falls with injury, weight loss, walking ability decline, and activities of daily living decline. 13.4
21% worse than Minnesota average

Minnesota average: 11.1

Functional decline score Info A composite score based on activities of daily living decline, walking ability decline, and incontinence. 24.9
10% worse than Minnesota average

Minnesota average: 22.6

Long-stay resident measures
Average Minnesota avg: 2.6 Info CMS star rating based on long-stay quality measure performance. 5 stars = significantly above average, 1 star = significantly below average.
Need for Help with Daily Activities Increased Info Percent of long-stay residents whose need for help with daily activities has increased 20.4%
8% worse than Minnesota average

Minnesota average: 18.9%

Walking Ability Worsened Info Percent of long-stay residents whose ability to move independently worsened 35.7%
50% worse than Minnesota average

Minnesota average: 23.8%

Low Risk Residents with Bowel/Bladder Incontinence Info Percent of low risk long-stay residents who lose control of their bowels or bladder 18.6%
26% better than Minnesota average

Minnesota average: 25.0%

Falls with Major Injury Info Percent of long-stay residents experiencing one or more falls with major injury 3.2%
14% better than Minnesota average

Minnesota average: 3.7%

High Risk Residents with Pressure Ulcers Info Percent of long-stay high risk residents with pressure ulcers 5.7%
5% worse than Minnesota average

Minnesota average: 5.4%

Urinary Tract Infection Info Percent of long-stay residents with a urinary tract infection 1.6%
40% better than Minnesota average

Minnesota average: 2.7%

Lost Too Much Weight Info Percent of long-stay residents who lose too much weight 2.0%
53% better than Minnesota average

Minnesota average: 4.1%

Depressive Symptoms Info Percent of long-stay residents who have depressive symptoms 2.7%
38% better than Minnesota average

Minnesota average: 4.4%

Antipsychotic Use Info Percent of long-stay residents who received an antipsychotic medication 21.1%
22% worse than Minnesota average

Minnesota average: 17.2%

Pneumococcal Vaccine Info Percent of long-stay residents assessed and appropriately given the pneumococcal vaccine 100.0%
In line with Minnesota average

Minnesota average: 97.3%

Influenza Vaccine Info Percent of long-stay residents assessed and appropriately given the seasonal influenza vaccine 99.3%
In line with Minnesota average

Minnesota average: 96.0%

Hospitalizations per 1,000 days Info Number of hospitalizations per 1,000 long-stay resident days. 1.49
11% better than Minnesota average

Minnesota average: 1.67

ED visits per 1,000 days Info Number of outpatient emergency department visits per 1,000 long-stay resident days. 0.40
80% better than Minnesota average

Minnesota average: 1.99

Short-stay resident measures
Above average Minnesota avg: 3.1 Info CMS star rating based on short-stay quality measure performance. 5 stars = much above average, 1 star = much below average.
Pneumococcal Vaccine Info Percent of short-stay residents assessed and appropriately given the pneumococcal vaccine 90.8%
In line with Minnesota average

Minnesota average: 88.9%

Antipsychotic medication increase Info Percent of short-stay residents who newly received an antipsychotic medication 0.2%
91% better than Minnesota average

Minnesota average: 1.9%

Influenza Vaccine Info Percent of short-stay residents assessed and appropriately given the seasonal influenza vaccine 86.1%
In line with Minnesota average

Minnesota average: 82.6%

Re-hospitalized after SNF stay Info Percentage of short-stay residents who were re-hospitalized after their nursing home admission. 21.8%
6% better than Minnesota average

Minnesota average: 23.1%

Emergency department visits Info Percentage of short-stay residents who had an outpatient emergency department visit. 9.6%
31% better than Minnesota average

Minnesota average: 14.0%

Falls with major injury Info Percentage of SNF residents who experience falls with major injury during their stay. 0.6%
19% better than Minnesota average

Minnesota average: 0.8%

Ability to care for self at discharge Info Percentage of residents at or above expected ability to care for themselves at discharge. 53.0%
In line with Minnesota average

Minnesota average: 53.7%

Successful return to home or community Info Rate of successful return to home or community from a skilled nursing facility. 59.6%
18% better than Minnesota average

Minnesota average: 50.6%

Breakdown by payment type

Medicare

37% of new residents, usually for short-term rehab.

Typical stay 22 days

Private pay

54% of new residents, often for short stays.

Typical stay 3 - 4 months

Medicaid

9% of new residents, often for long-term daily care.

Typical stay 2 - 3 years

Facility Characteristics

Source: CMS Long-Term Care Facility Characteristics (Data as of Jan 2026)

Total residents 148
Medicare
26
17.6% of residents
Medicaid
91
61.5% of residents
Private pay or other
31
20.9% of residents
Programs & Services
Residents Group

Residents meet regularly to discuss policies, care quality, and activities

Family Member Group

Family members meet regularly to discuss policies, care quality, and activities

Active Family Council

Organized group of family members that meets regularly to discuss facility policies, resident care, and activities.

Active Resident Council

Organized group of residents that meets regularly to discuss facility policies, quality of life, and activities.

Finances and operations

Based on CMS SNF Cost Report for fiscal year ending in 12/2023.

Nonprofit
Nonprofit Corporation
Net patient revenue Info Net patient revenue — what the home actually collects for resident care, after contractual allowances, bad debt and discounts are subtracted from its gross charges (CMS cost report, Worksheet G-3). It covers resident care only; money the home earns from other sources is shown separately as "Other income."
$25.6M
Net patient income Info Net patient income: net patient revenue minus the home's total operating expenses. A positive figure means it earns more from resident care than it spends to deliver it; a negative figure means the opposite. It excludes non-operating "other income."
-$1.1M
Nonprofit Nonprofit Corporation
Net patient revenue Info Net patient revenue — what the home actually collects for resident care, after contractual allowances, bad debt and discounts are subtracted from its gross charges (CMS cost report, Worksheet G-3). It covers resident care only; money the home earns from other sources is shown separately as "Other income."
$25.6M Rank #8 / 89Revenue — State benchmarkedThis home is ranked 8th out of 89 homes in Minnesota. Shows this facility's annual revenue compared to the Minnesota average. Higher revenue generally means more resources for staffing and capital — read alongside Payroll %.Rankings are based only on facilities in Minnesota that report data for that category. Facilities without available data are excluded from the ranking.Click the rank badge to see the full State ranking.Click here to see the full State ranking.
Net patient income Info Net patient income: net patient revenue minus the home's total operating expenses. A positive figure means it earns more from resident care than it spends to deliver it; a negative figure means the opposite. It excludes non-operating "other income."
-$1.1M
Other income Info Money the home earns outside of resident care — such as investments, grants, rentals and other non-operating sources (CMS cost report, Worksheet G-3). It is tracked separately from net patient revenue: it is not part of that figure, and it is not included in net patient income.
$1.1M
Payroll costs Info Staff salaries plus wage-related costs — benefits such as payroll taxes, health insurance and retirement — from the home's own accounting records (CMS cost report, Worksheet A). Contract or agency labor is counted separately, under other operating costs. Rank #4 / 89Payroll — State benchmarkedThis home is ranked 4th out of 89 homes in Minnesota. Shows total annual staff payroll benchmarked to the Minnesota average. Higher payroll investment relative to peers often signals better staffing and less reliance on cheaper contract labor.Rankings are based only on facilities in Minnesota that report data for that category. Facilities without available data are excluded from the ranking.Click the rank badge to see the full State ranking.Click here to see the full State ranking.
$16.5M 64.3% of net patient revenue Info Payroll as a share of revenue: staff salaries and wage-related benefits divided by net patient revenue. A higher figure means more of each revenue dollar goes to staff pay. Rank #23 / 89Payroll % — State benchmarkedThis home is ranked 23rd out of 89 homes in Minnesota. Shows payroll as a percentage of revenue versus the Minnesota average. Well-run Minnesota facilities typically land around 61–68% — the top third Statewide. Below 25% may signal understaffing or heavy agency use — read with Staffing ratings.Rankings are based only on facilities in Minnesota that report data for that category. Facilities without available data are excluded from the ranking.Click the rank badge to see the full State ranking.Click here to see the full State ranking.
Other operating costs Info Everything it costs to run the home apart from payroll — food, utilities, supplies, maintenance, contract labor and administration. Calculated as total operating expense minus payroll (staff salaries and wage-related benefits).
$10.2M
Total costs Info The home's total operating expense for the year — all the costs of running it, salaries included (CMS cost report, Worksheet G-3).
$26.7M

Who this home usually serves

TYPE OF STAY

Mix of rehab and long-term care

This home supports both short-term rehab and long-term care, with residents staying for a wide range of durations.

Most new residents arrive under private pay (54% of admissions), and a typical private pay stay runs around 3 - 4 months.

Admissions
410 total

Coverage residents most often arrive under.

Medicare 37%
Private pay 54%
Medicaid 9%
Discharges
413 total

Coverage residents most often leave under.

Medicare 38%
Private pay 52%
Medicaid 10%

Managed by Tim Hokanson

Executive Director

Mount Olivet Careview Home

Joanne
Very expensive for asst living with low care needs What do you like most about living here? Answer: Not much Are there enough caregivers to handle the residents' needs, especially during emergencies? Answer: No Are the common areas pleasant and comfortable for socializing or relaxing? Answer: No How would you rate the quality and variety of the meals? (1-5) Answer: 1 Are special diets handled well? Answer: Yes Is the dining schedule flexible enough to meet your preferences? Answer: Yes How do you feel about the level of social interaction available with other residents? Answer: Ok How was the units offered in this community? Answer: No Do you feel safe living in this community? Answer: Yes How well do you think the community handles emergencies or unexpected events? Answer: Unknown Are there any hidden fees or unexpected charges? Answer: Yes Would you recommend this community to others looking for senior living options? Answer: No Is there anything you wish you knew before moving in? Answer: No
George A Kraus
The treatment my Mom received still haunts me. I made numerous complaints regarding the neglect and the mistreatment she received. The facility did nothing to help her. As her legal guardian they did everything to shut me up to the point where they began legal action to terminate my guardianship. And once that was accomplished I was going to be barred from the building permanently. The hearing was scheduled for May 22nd 2022 and my mom died May 20th 2022. She died a very hard and miserable death and and there was very little I could do at that point and I'll always forget that What do you like most about living here? Answer: The decision to make that my mom's home for the last 2 years of her life is a decision I will always tremendously regret Are there enough caregivers to handle the residents' needs, especially during emergencies? Answer: No Are the common areas pleasant and comfortable for socializing or relaxing? Answer: No How would you rate the quality and variety of the meals? (1-5) Answer: 1 Are special diets handled well? Answer: No Is the dining schedule flexible enough to meet your preferences? Answer: No How do you feel about the level of social interaction available with other residents? Answer: Not at all! They did everything they could to keep my mom shut off from everybody else How was the units offered in this community? Answer: Unknown Do you feel safe living in this community? Answer: No How well do you think the community handles emergencies or unexpected events? Answer: In my own opinion, they failed in every single way they possibly could Are there any hidden fees or unexpected charges? Answer: Would you recommend this community to others looking for senior living options? Answer: Never! Is there anything you wish you knew before moving in? Answer: I wish I would have known how unethical the administrator was and how little I could trust him

Places of interest near Mount Olivet Careview Home

Address 5.3 miles from city center Info Estimated distance in miles from Minneapolis's city center to Mount Olivet Careview Home's address, calculated via Google Maps.

Calculate Travel Distance to Mount Olivet Careview Home

Add your location

Address

Compare Nursing Homes around Minneapolis

The information below is reported by the Minnesota Department of Health, Health Regulation Division.

5 facilities compared · CMS & MN Dept. of Health data

Redeemer Health Care Center
NH
HC
PC
RC
Minneapolis (Powderhorn)
119
Facility 119
MN AVG 61
Rank #78 / 532
93.9%
Facility 93.9%
MN AVG 79.7%
Rank #47 / 331
+18%
5.23
Facility 5.23
MN AVG 4.77
Rank #20 / 89
-28% +10%
$0
Facility $0
MN AVG $47.9k
Rank #1 / 90
25
Facility 25
MN AVG 23.2
Rank #45 / 90
5.0
Facility 5.0
MN AVG 3.8
Rank #67 / 90
- 112 -
95
Facility 95
MN AVG 43
Rank #3 / 632
Danny Colgan
$15.5M
Facility $15.5M
MN AVG $9.9M
Rank #31 / 89
$9.9M
Facility $9.9M
MN AVG $4.9M
Rank #21 / 89
63.5%
Facility 63.5%
MN AVG 50.7%
Rank #29 / 89
245520
Mount Olivet Careview Home
NH
AL
MC
NC
RC
Minneapolis (Southwest Minneapolis)
155
Facility 155
MN AVG 61
Rank #33 / 532
- -
5.39
Facility 5.39
MN AVG 4.77
Rank #15 / 89
+20% +13%
$55.0k
Facility $55.0k
MN AVG $47.9k
Rank #75 / 90
18
Facility 18
MN AVG 23.2
Rank #28 / 90
2.3
Facility 2.3
MN AVG 3.8
Rank #13 / 90
1 14 -
76
Facility 76
MN AVG 43
Rank #71 / 632
Sharon Flack
$25.6M
Facility $25.6M
MN AVG $9.9M
Rank #8 / 89
$16.5M
Facility $16.5M
MN AVG $4.9M
Rank #4 / 89
64.3%
Facility 64.3%
MN AVG 50.7%
Rank #23 / 89
245071
Jones-Harrison Senior Living
NH
AL
MC
NC
Minneapolis (Calhoun Isles)
53
Facility 53
MN AVG 61
Rank #249 / 532
92.5%
Facility 92.5%
MN AVG 79.7%
Rank #59 / 331
+16%
5.11
Facility 5.11
MN AVG 4.77
Rank #26 / 89
+38% +7%
$0
Facility $0
MN AVG $47.9k
Rank #1 / 90
35
Facility 35
MN AVG 23.2
Rank #65 / 90
4.4
Facility 4.4
MN AVG 3.8
Rank #58 / 90
- 49 -
56
Facility 56
MN AVG 43
Rank #212 / 632
Marcia Diracles
$13.5M
Facility $13.5M
MN AVG $9.9M
Rank #26 / 89
$12.2M
Facility $12.2M
MN AVG $4.9M
Rank #15 / 89
90.4%
Facility 90.4%
MN AVG 50.7%
Rank #14 / 89
245460
The Villas at Bryn Mawr
NH
AL
Minneapolis (Harrison)
105
Facility 105
MN AVG 61
Rank #112 / 532
75.0%
Facility 75.0%
MN AVG 79.7%
Rank #188 / 331
-6%
3.73
Facility 3.73
MN AVG 4.77
Rank #81 / 89
-68% -22%
$35.3k
Facility $35.3k
MN AVG $47.9k
Rank #66 / 90
58
Facility 58
MN AVG 23.2
Rank #85 / 90
5.3
Facility 5.3
MN AVG 3.8
Rank #71 / 90
4 99 -
55
Facility 55
MN AVG 43
Rank #217 / 632
-
$9.0M
Facility $9.0M
MN AVG $9.9M
Rank #59 / 89
$4.8M
Facility $4.8M
MN AVG $4.9M
Rank #52 / 89
53.8%
Facility 53.8%
MN AVG 50.7%
Rank #38 / 89
245203
Lakehouse Healthcare and Rehabilitation Center
NH
HC
MC
RC
Minneapolis (Southwest Minneapolis)
260
Facility 260
MN AVG 61
Rank #6 / 532
80.9%
Facility 80.9%
MN AVG 79.7%
Rank #139 / 331
+2%
3.91
Facility 3.91
MN AVG 4.77
Rank #69 / 89
-24% -18%
$0
Facility $0
MN AVG $47.9k
Rank #1 / 90
76
Facility 76
MN AVG 23.2
Rank #88 / 90
5.1
Facility 5.1
MN AVG 3.8
Rank #70 / 90
1 224 -
81
Facility 81
MN AVG 43
Rank #36 / 632
Lake Harriet Operator Holdings LLC
$20.0M
Facility $20.0M
MN AVG $9.9M
Rank #20 / 89
$10.7M
Facility $10.7M
MN AVG $4.9M
Rank #19 / 89
53.6%
Facility 53.6%
MN AVG 50.7%
Rank #62 / 89
245055

Financial Assistance for
Nursing Home in Minnesota

Mount Olivet Careview Home is located in Minneapolis, Minnesota.
Here are the financial assistance programs available to residents in Minnesota.

Get Financial aid guidance

Elderly Waiver

Minnesota Medicaid EW

Age 65+
General Minnesota resident, Medicaid-eligible, nursing home-level care need.
Income Limits (2025) ~$2,829/month 300% FBR, individual
Asset Limits $3,000 individual, higher than most states
MN

Higher asset limit; rural access focus.

Benefits
Personal care (5-7 hours/day) Respite (240 hours/year) Adult day care (~$70/day) Home aides

Essential Community Supports (ECS)

Minnesota ECS

Age 65+
General Minnesota resident, at risk of decline but not nursing home level.
Income Limits ~$1,732/month individual, varies
Asset Limits $3,000 individual
MN

Bridges gap for those ineligible for waivers.

Benefits
In-home support (2-4 hours/week) Respite (up to 5 days/year) Transportation (~5 trips/month)

Alternative Care (AC) Program

Minnesota Alternative Care Program

Age 65+
General Minnesota resident, NFLOC, not MA-eligible.
Income Limits (2025) ~$1,255-$2,829/month (100%-300% FPL); sliding scale copays.
Asset Limits $3,000 (individual); home equity limit $713,000.
MN

CDCS option; statewide via counties.

Benefits
Personal care (4-6 hours/day) Respite (~5 days/year) Home health Meals Home mods

Minnesota Senior Health Options (MSHO)

Minnesota Senior Health Options

Age 65+
General Minnesota resident, eligible for MA and Medicare Parts A/B.
Income Limits (2025) ~$1,255/month (100% FPL for MA); spenddown allowed.
Asset Limits $3,000 (individual), $6,000 (couple).
MN

7 health plans (e.g., UCare, HealthPartners); care coordinator assigned.

Benefits
Personal care (5-7 hours/day) Medical care Respite Adult day care Home mods $900/year groceries (some plans)

Minnesota Senior Care Plus (MSC+)

Minnesota Senior Care Plus

Age 65+
General Minnesota resident, MA-eligible, not on Medicare.
Income Limits (2025) ~$1,255/month (100% FPL); spenddown allowed.
Asset Limits $3,000 (individual), $6,000 (couple).
MN

Includes EW services; 7 health plans available.

Benefits
Personal care (5-7 hours/day) Respite Adult day care Home mods Limited nursing home care

Consumer Support Grant (CSG)

Minnesota Consumer Support Grant

Age 65+ or disabled
General Minnesota resident, eligible for MA personal care but opts for grant.
Income Limits (2025) ~$1,255/month (MA-eligible); spenddown allowed.
Asset Limits $3,000 individual
MN

Can hire family; statewide via counties.

Benefits
Cash (~$500-$1,500/month) for personal care Respite Home mods Assistive tech

Medicare Savings Program (MSP)

Minnesota Medicare Savings Program

Age 65+ or disabled
General Minnesota resident, Medicare Part A/B.
Income Limits (2025) ~$2,510/month (QMB), ~$3,380/month (SLMB), ~$3,598/month (QI)—individual.
Asset Limits $9,430 (individual), $14,130 (couple).
MN

Three tiers; no waitlist; includes Extra Help for Part D.

Benefits
Covers Part B premiums ($174.70/month) Deductibles ($240/year) Copays (~20%)

VA Aid and Attendance (A&A) and Housebound Benefits

Minnesota VA Aid and Attendance/Housebound

Age 65+ or disabled veteran/spouse
General Minnesota resident, wartime service, need for ADL help (A&A) or homebound.
Income Limits (2025) Net income < ~$1,984/month (veteran with dependent, A&A); pension offsets income.
Asset Limits ~$155,356 net worth limit
MN

High veteran demand in rural/urban areas.

Benefits
Cash (~$1,433-$2,642/month veteran, ~$951-$1,318 spouse) for care costs (e.g., in-home, assisted living)

Frequently Asked Questions about Mount Olivet Careview Home

What neighborhood is Mount Olivet Careview Home in?

Mount Olivet Careview Home is in the Southwest Minneapolis neighborhood of Minneapolis.

Is Mount Olivet Careview Home in a walkable area?

Mount Olivet Careview Home has a walk score of 76. Very walkable. Most errands can be accomplished on foot, and many essentials are within a short walk.

What is the occupancy rate at Mount Olivet Careview Home?

Mount Olivet Careview Home's occupancy is 96.6%.

Does Mount Olivet Careview Home operate as a for-profit or non-profit?

Mount Olivet Careview Home is registered as a non-profit in MN.

Are there photos of Mount Olivet Careview Home?

Yes — there are 19 photos of Mount Olivet Careview Home in the photo gallery on this page.

What is the address of Mount Olivet Careview Home?

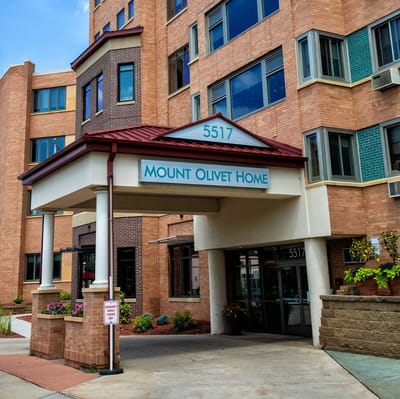
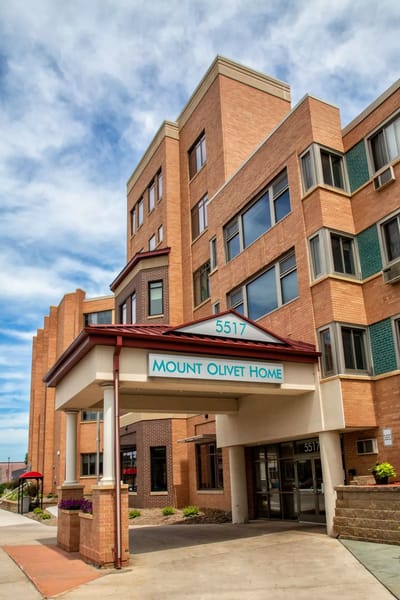
Mount Olivet Careview Home is located at 5517 Lyndale Ave S, Minneapolis, MN 55419.

What is the phone number of Mount Olivet Careview Home?

(612) 827-5677 will put you in contact with the team at Mount Olivet Careview Home.

Guides for Better Senior Living

Care Cost Calculator: See Prices in Your Area

Nursing Home Data Explorer

Don’t Wait Too Long: 7 Red Flag Signs Your Parent Needs Assisted Living Now

The True Cost of Assisted Living in 2025 – And How Families Are Paying For It

Understanding Senior Living Costs: Pricing Models, Discounts & Financial Assistance