Clover Meadows Healthcare And Rehabilitation Cente
Nursing Home & Assisted Living · Lawrenceville, NJ
CMS overall rating Info CMS (the Centers for Medicare & Medicaid Services) is the federal agency that rates nursing home quality. Its Overall Rating runs from 1 to 5 stars, combining health inspections, staffing, and quality measures, with inspections weighted most heavily.

Clover Meadows Healthcare And Rehabilitation Cente

Nursing Home & Assisted Living · Lawrenceville, NJ
CMS overall rating Info CMS (the Centers for Medicare & Medicaid Services) is the federal agency that rates nursing home quality. Its Overall Rating runs from 1 to 5 stars, combining health inspections, staffing, and quality measures, with inspections weighted most heavily.
Calculator: See prices in your area
Clover Meadows Healthcare And Rehabilitation Cente accepts Medicare, Medicaid, and private pay.

Overview of Clover Meadows Healthcare and Rehabilitation Cente

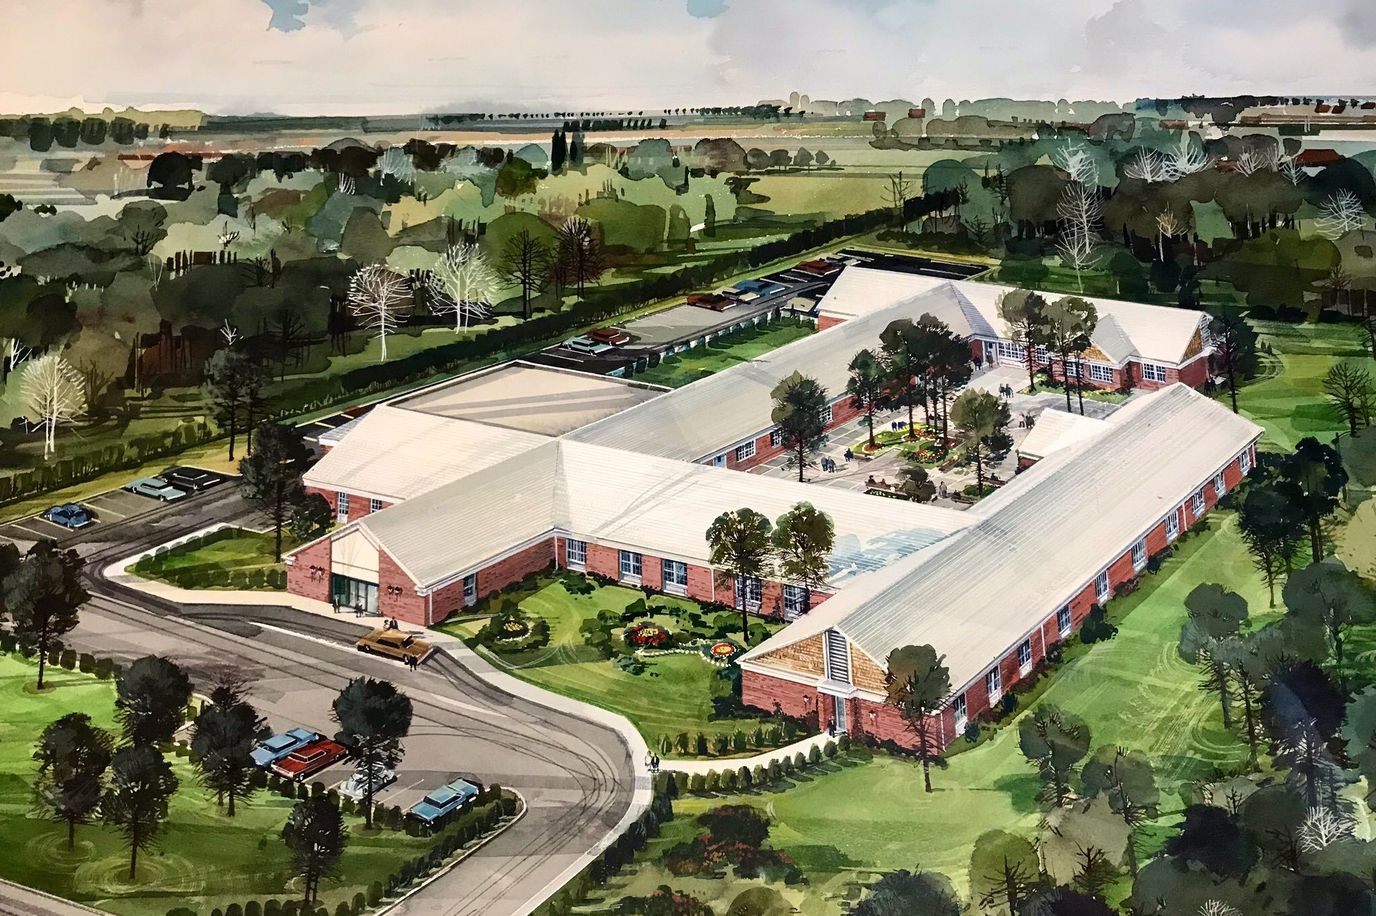
Clover Meadows Healthcare and Rehabilitation Center occupies a 100-bed facility in Lawrenceville, just outside Princeton in Middlesex County, New Jersey. It operates as a nursing home focused on skilled rehabilitation and acute care. Residents spend 93 days on average recovering from surgery, managing post-hospitalization needs, or navigating complex medical episodes. The 86% occupancy rate suggests consistent demand within its market.

The staffing model deserves specific attention. Total nursing coverage runs 3 hours 36 minutes per resident per day, with nurses making up the smaller portion and nursing aides providing the bulk of hands-on care time. That ratio reflects the facility’s classification as a rehabilitation center rather than a custodial operation. Residents requiring intensive therapy benefit from this structure; residents seeking overnight supervision in a quieter setting would find it inadequate.

Specialized programming is the core differentiator, and the clinical orientation is clear and specific. Orthopedic and trauma rehabilitation, post-surgical recovery, stroke recovery, and wound management form the clinical backbone. The facility maintains on-site EKG and lab capabilities, which is useful for facilities managing cardiac patients; plus there’s 24-hour staffing across all departments. Respite care and sub-acute services fill capacity gaps.

Inspection history shows substantiated complaints and findings across staffing ratios, resident rights, medication management, infection control, and life safety during the first years of the six-year data window. The most recent survey in November 2025 identified no deficiencies, suggesting that operational corrections have taken hold.

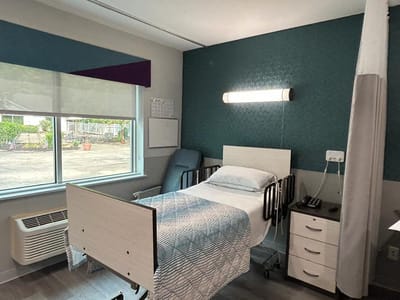
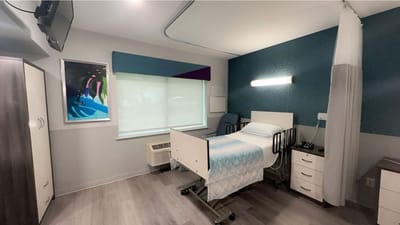
Dining moves toward restaurant service rather than institutional standards, with a chef preparing meals daily. Private and semi-private rooms provide some accommodation choice. The neighborhood scores 54 on walkability; pedestrians can handle some errands, but most visitors will need a car.

Payment accepts Medicare, Medicaid, and private pay pathways. Clover Meadows fits the profile of someone needing intensive rehabilitation with strong nursing ratios and specialized therapy, not long-term custodial care. The facility’s inspections and available data align with that positioning.

Quality ratings

Measured by Centers for Medicare & Medicaid Services (CMS)

Overall rating Info The Overall CMS Rating combines results from health inspections, staffing levels and quality measures. Health inspections carry the most weight. Staffing and quality scores can increase or decrease the final rating based on performance compared to state and national standards.
Health Inspection Info Based on the results of the facility's three most recent standard inspections and any complaint investigations. CMS reviews the number, scope, and severity of deficiencies, with more recent findings weighted more heavily.
Staffing Info Measures average nursing staff hours per resident per day, including Registered Nurses (RNs) and total nursing staff. Ratings are adjusted based on the level of care residents require and are compared to state and national benchmarks.
Quality Measures Info Based on clinical and physical health indicators reported to CMS, such as hospital readmissions, falls, pressure ulcers, and improvements in mobility. These measures reflect how well residents' health needs are being managed.

Staffing hours breakdown

Info Daily nursing hours per resident by staff type, reported to CMS. Higher is generally better — compare this facility to state and national averages to see where staffing stands.

Hours per resident per day — compared to state averages

Total nursing care / resident Info Total adjusted nursing hours per resident per day, combining RN, LPN, and aide time. CMS adjusts this for case-mix so facilities can be fairly compared.
3h 36m per day
Rank #160 / 294Nurse hours — State benchmarkedThis home is ranked 160th out of 294 homes in New Jersey for Nurse Hours. Shows adjusted nurse hours per resident per day benchmarked to the New Jersey average, with a ranking across 294 New Jersey facilities. More hours mean more direct care. The national average is about 3.5 hrs; below 3.0 is a red flag.Facilities with the same value for a metric share the same rank. Rankings are based only on facilities in New Jersey that report data for that category. Facilities without available data are excluded from the ranking.Click the rank badge to see the full State ranking.Click here to see the full State ranking.
vs avg

6 of 6 metrics below state avg

Staff typeHours / Day / Residentvs state avg
Registered Nurse (RN) Info RNs hold the highest nursing license and can assess residents, interpret test results, and direct care plans. More RN hours per day often signals stronger clinical oversight and faster response to health changes. 30m per day ▼ 26% State avg: 41m per day · National avg: 41m per day
LPN / LVN Info Licensed Practical Nurses (LPNs) or Licensed Vocational Nurses (LVNs) deliver routine hands-on care — medication administration, wound dressing, and monitoring vital signs. They work under RN supervision and make up a large share of daily bedside care. 54m per day ▼ 4% State avg: 56m per day · National avg: 52m per day
Nurse Aide Info Certified Nurse Aides (CNAs) provide the most direct day-to-day assistance: bathing, dressing, feeding, and mobility. Nurse aide hours are typically the largest staffing category and directly affect residents' quality of life. 2h 9m per day ▼ 4% State avg: 2h 14m per day · National avg: 2h 20m per day
Weekend Total Nursing Info Combined nursing hours (RN + LPN + Nurse Aide) per resident per day on weekends. Staffing often drops on weekends — this figure reveals whether the facility maintains adequate coverage outside of weekday hours. 2h 59m per day ▼ 13% State avg: 3h 27m per day · National avg: 3h 26m per day
Physical Therapist Info Hours per resident per day provided by licensed Physical Therapists (PTs) or PT Assistants. PT services help residents recover mobility after injury or illness and are especially important for post-acute (short-stay) rehabilitation. 5m per day ▼ 21% State avg: 6m per day · National avg: 4m per day
Weekend RN Info Registered nurse hours specifically on weekends. Facilities sometimes reduce RN presence on Saturdays and Sundays — a low weekend RN figure compared to weekday hours can indicate reduced clinical oversight when most administrative staff are absent. 17m per day ▼ 41% State avg: 29m per day · National avg: 28m per day

Capacity and availability

Avg. Length of Stay Info Average number of days residents stay at this facility, based on CMS cost report data. Shorter stays often reflect post-acute or rehab care; longer stays reflect long-term care.
93 days
Bed community size
100-bed community Rank #367 / 560Bed count — State benchmarkedThis home is ranked 367th out of 560 homes in New Jersey for Bed Count. Shows this facility's certified or reported bed count compared to other New Jersey facilities. Larger communities may offer more amenities, programs, and on-site services for residents and families.Facilities with the same value for a metric share the same rank. Rankings are based only on facilities in New Jersey that report data for that category. Facilities without available data are excluded from the ranking.Click the rank badge to see the full State ranking.Click here to see the full State ranking.
A larger shared setting that may offer more common spaces and organized community services.
Walk Score
Walk Score: 54 / 100 Rank #255 / 638Walk Score — State benchmarkedThis home is ranked 255th out of 638 homes in New Jersey for Walk Score. Shows how walkable this facility's neighborhood is compared to the average Walk Score across New Jersey facilities. Higher scores benefit residents, families, and staff.Facilities with the same value for a metric share the same rank. Rankings are based only on facilities in New Jersey that report data for that category. Facilities without available data are excluded from the ranking.Click the rank badge to see the full State ranking.Click here to see the full State ranking.
Moderately walkable. Some errands can be accomplished on foot, with a mix of nearby amenities.

About this community

Occupancy

Occupancy rate
86%
Rank #159 / 478Occupancy rate — State benchmarkedThis home is ranked 159th out of 478 homes in New Jersey for Occupancy. Shows this facility's occupancy rate versus the New Jersey average, with its Statewide rank out of 478. Higher occupancy signals strong local demand and financial stability.Facilities with the same value for a metric share the same rank. Rankings are based only on facilities in New Jersey that report data for that category. Facilities without available data are excluded from the ranking.Click the rank badge to see the full State ranking.Click here to see the full State ranking.
Higher than the New Jersey average: 77%
Occupied beds
86 / 100
Average occupied beds in New Jersey homes 119 beds

License Details

Facility TypeLong Term Care Facility
StatusActive
ExpirationOctober 31, 2026
License Number61104
CMS Certification Number315113

Ownership & Operating Entity

Clover Meadows Healthcare And Rehabilitation Cente is administered by Yoseph Klein.

Owner NameClover Meadows Healthcare & Rehab Center LLC

Officers

Info Officers are individuals or entities with formal legal or financial responsibility for the organization that owns this facility

Mendy Piller, Moshe Brodt, Yaakov Dorfman

Therapy & Rehabilitation

3 services
Rehabilitation Services
Respite Care
Short-Term Rehab

Staffing & Medical

1 service
24-Hour Staffing

Additional Services

1 service
Sub-Acute Care

Amenities & Lifestyle

Attractive Private And Semi-Private Rooms
Cable Television
Staffing Ratios Above The National Average
Common Areas
Restaurant Style Fine Dining
Recreational And Social Activities
Entertainment Programs
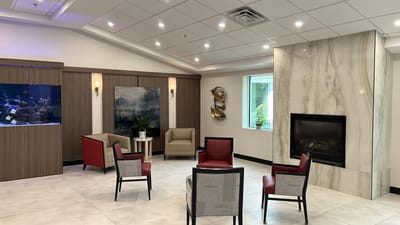
Aquarium
Pet Therapy
Wireless Internet Access
Beauty And Barber Shop
Specific ProgramsIV Therapy, Orthopedic and Trauma Rehabilitation, Pain Management, Stroke Care, Wound Care, Post-Surgical Rehabilitation, On Site EKG’s and Lab services, Cardiac Care Congestive Heart Failure Management
Operating Hours24/7

Contact Clover Meadows Healthcare And Rehabilitation Cente

Inspection History

In New Jersey, the Department of Health, Health Facilities Evaluation and Licensing conducts mandatory unannounced surveys to ensure facilities provide safe and effective resident care.

Since 2020 · 6 years of data 35 deficiencies 12 inspections

Inspection Scorecard Info This scorecard compares key inspection, deficiency, and complaint metrics at this facility against the New Jersey state average. Metrics rated ≥15% worse than average are highlighted in red; those ≥15% better are highlighted in green.

Since 2020 vs. New Jersey state average
Overall vs. NJ average 3 Worse Metrics worse than New Jersey average:
• Total deficiencies (94% above)
• Deficiencies per year (93% above)
• Deficiencies per inspection (45% above)
0 Better No metrics in this bucket.
Latest Inspection November 19, 2025

Deficiencies Info Deficiencies are formal regulatory issues recorded during state inspections.

This FacilityNJ Averagevs. NJ Avg
Total deficiencies Info Formal regulatory issues recorded by inspectors across all inspection types. 3518 This facility has 94% more total deficiencies than a typical New Jersey assisted living residence (35 vs. NJ avg 18).↑ 94% worse
Deficiencies per year Info Average deficiencies per year since 2020. 5.83 This facility has 93% more deficiencies per year than a typical New Jersey assisted living residence (5.8 vs. NJ avg 3).↑ 93% worse
Deficiencies per inspection Info Average deficiencies per inspection. 2.92 This facility has 45% more deficiencies per inspection than a typical New Jersey assisted living residence (2.9 vs. NJ avg 2).↑ 45% worse

Inspections Info State inspections evaluate whether the facility meets health and safety standards.

This FacilityNJ Averagevs. NJ Avg
Total inspections Info Combined count of all routine and focused inspections. Excludes complaint investigations. 129 This facility has had 33% more total inspections than the New Jersey average (12 vs. NJ avg 9). More inspections can mean more regulatory scrutiny rather than worse care.↑ 33% more

Inspection Reports Summary Info An editor-reviewed summary of the themes and findings across this facility's recent inspection reports.

  • The most recent inspection on November 19, 2025, found no deficiencies or complaints related to facility practices or resident care.
  • Staffing shortages were substantiated repeatedly in 2024, with failures to meet minimum CNA ratios on 55 day shifts across multiple complaint investigations.
  • October 31, 2023, routine survey cited 14 deficiencies including failure to investigate resident abuse, medication errors, infection control lapses, and improper handling of resident funds.

Health Inspection History

Inspections since 2021
Total health inspections 3

State average N/A


Last Health inspection on Jan 2025

Total health citations
20 Rank #155 / 296Health citations — State benchmarkedThis home is ranked 155th out of 296 homes in New Jersey for Health Citations. Shows this facility's total health deficiency citations benchmarked to the New Jersey State average, with a ranking across all 296 NJ facilities. Lower citation counts earn a better rank.Facilities with the same value for a metric share the same rank. Rankings are based only on facilities in New Jersey that report data for that category. Facilities without available data are excluded from the ranking.Click the rank badge to see the full State ranking.Click here to see the full State ranking.

State average N/A

Citations per inspection
6.67 Rank #222 / 296Citations per inspection — State benchmarkedThis home is ranked 222nd out of 296 homes in New Jersey for Citations Per Inspection. Shows average deficiency citations per CMS inspection for this facility versus the New Jersey mean across 296 facilities with citation data. Lower is better.Facilities with the same value for a metric share the same rank. Rankings are based only on facilities in New Jersey that report data for that category. Facilities without available data are excluded from the ranking.Click the rank badge to see the full State ranking.Click here to see the full State ranking.

State average N/A


Health citations are formal notices following inspections when they fail to comply with safety and care standards.

16 of 20 citations resulted from standard inspections; and 4 of 20 came from combined inspections (standard and complaint).

Breakdown of citation severity (last 5 years)
Critical health citations
0
In line with State average

State average: N/A


Serious health citations
0
In line with State average

State average: N/A

0 critical citations State average: N/A

0 serious citations State average: N/A

19 moderate citations State average: N/A

1 minor citation State average: N/A
Citations history (last 5 years)
Abuse/Neglect moderate citation Jan 16, 2025
Corrected

Nursing Services minor citation Jan 16, 2025
Corrected

Quality of Care moderate citation Jan 16, 2025
Corrected

Quality of Care moderate citation Jan 16, 2025
Corrected

Staffing Data

Reporting period: October 1 – December 31, 2025 (Q4 2025). Source: CMS Payroll-Based Journal report.

Total staff 197
Employees 110
Contractors 87
Staff to resident ratio 2.07 : 1
0% compared with State average

State average ratio: 0 : 0

Avg staff/day 60
Average shift 7.6 hours
0% compared with State average

State average: 0 hours

Total staff hours (quarter) 42,085

Nursing staff breakdown

Q4 2025 · Oct 1 – Dec 31 More info This data comes from the CMS Payroll-Based Journal report covering October 1 – December 31, 2025.
Registered Nurse

Manages medical care and health needs.

RN Staff Info All 7 RN Staff are full-time employees. No contractors work on this role. 7
Average shift length Info Average shift length. Calculated as total hours divided by days worked and average staff per day. 7.6 hours
Licensed Practical Nurse

Assists with medical care and medications.

LPN Staff Info 52 total: 18 full-time employees and 34 contractors. 52
Average shift length Info Average shift length. Calculated as total hours divided by days worked and average staff per day. 8.1 hours
Certified Nursing Assistant

Helps with daily care and mobility.

CNA Staff Info 94 total: 41 full-time employees and 53 contractors. 94
Average shift length Info Average shift length. Calculated as total hours divided by days worked and average staff per day. 7.8 hours

Contractor staffing

Q4 2025 · Oct 1 – Dec 31 More info This data comes from the CMS Payroll-Based Journal report covering October 1 – December 31, 2025.

Total hours from contractors

4.7%

1,982 contractor hours this quarter

Certified Nursing Assistant: 53 Licensed Practical Nurse: 34

Staff by category

Q4 2025 · Oct 1 – Dec 31 More info This data comes from the CMS Payroll-Based Journal report covering October 1 – December 31, 2025.
Certified Nursing Assistant41539419,01292100%7.8
Licensed Practical Nurse1834527,00792100%8.1
Physical Therapist100103,32992100%6.7
Clinical Nurse Specialist5052,2149199%7.8
Registered Nurse7071,7619098%7.6
Occupational Therapy Aide4041,3958896%7.3
Physical Therapy Assistant4041,2416773%6.9
Other Dietary Services Staff3031,23692100%7
RN Director of Nursing2029166975%7.6
Therapeutic Recreation Specialist4047257582%6.5
Respiratory Therapy Technician3037047480%6.1
Nurse Practitioner1014806065%8
Dietitian1014746166%7.8
Qualified Social Worker2024216267%6.7
Mental Health Service Worker1014206065%7
Physical Therapy Aide3033945257%7.4
Administrator1013575661%6.4
94 Certified Nursing Assistant
% of Days 100%
52 Licensed Practical Nurse
% of Days 100%
10 Physical Therapist
% of Days 100%
5 Clinical Nurse Specialist
% of Days 99%
7 Registered Nurse
% of Days 98%
4 Occupational Therapy Aide
% of Days 96%
4 Physical Therapy Assistant
% of Days 73%
3 Other Dietary Services Staff
% of Days 100%
2 RN Director of Nursing
% of Days 75%
4 Therapeutic Recreation Specialist
% of Days 82%
3 Respiratory Therapy Technician
% of Days 80%
1 Nurse Practitioner
% of Days 65%
1 Dietitian
% of Days 66%
2 Qualified Social Worker
% of Days 67%
1 Mental Health Service Worker
% of Days 65%
3 Physical Therapy Aide
% of Days 57%
1 Administrator
% of Days 61%

Penalties and fines

Federal penalties imposed by CMS for regulatory violations, including civil money penalties (fines) and denials of payment for new Medicare/Medicaid admissions.

Source: CMS Penalties Database

No penalties in the past 3 years

No civil money penalties or payment denials were reported in the last 3 years.

Quality of care over time

These measures show how residents usually do over time at this home, based on health outcomes and preventive care.

High-risk clinical events score Info A composite score based on pressure ulcers, falls with injury, weight loss, walking ability decline, and activities of daily living decline. 5.5
19% better than State average

State average: 6.8

Functional decline score Info A composite score based on activities of daily living decline, walking ability decline, and incontinence. 13.9
12% worse than State average

State average: 12.4

Long-stay resident measures
Significantly above average State avg: 4.5 Info CMS star rating based on long-stay quality measure performance. 5 stars = significantly above average, 1 star = significantly below average.
Need for Help with Daily Activities Increased Info Percent of long-stay residents whose need for help with daily activities has increased 9.3%
8% better than State average

State average: 10.1%

Walking Ability Worsened Info Percent of long-stay residents whose ability to move independently worsened 12.6%
15% worse than State average

State average: 11.0%

Low Risk Residents with Bowel/Bladder Incontinence Info Percent of low risk long-stay residents who lose control of their bowels or bladder 19.8%
24% worse than State average

State average: 16.0%

Falls with Major Injury Info Percent of long-stay residents experiencing one or more falls with major injury 2.2%
8% better than State average

State average: 2.4%

High Risk Residents with Pressure Ulcers Info Percent of long-stay high risk residents with pressure ulcers 1.2%
80% better than State average

State average: 6.1%

Urinary Tract Infection Info Percent of long-stay residents with a urinary tract infection 0.7%
31% better than State average

State average: 1.0%

Lost Too Much Weight Info Percent of long-stay residents who lose too much weight 2.2%
54% better than State average

State average: 4.6%

Depressive Symptoms Info Percent of long-stay residents who have depressive symptoms 14.5%
29% worse than State average

State average: 11.3%

Antipsychotic Use Info Percent of long-stay residents who received an antipsychotic medication 3.5%
68% better than State average

State average: 11.1%

Pneumococcal Vaccine Info Percent of long-stay residents assessed and appropriately given the pneumococcal vaccine 99.7%
7% better than State average

State average: 93.0%

Influenza Vaccine Info Percent of long-stay residents assessed and appropriately given the seasonal influenza vaccine 100.0%
In line with State average

State average: 97.2%

Hospitalizations per 1,000 days Info Number of hospitalizations per 1,000 long-stay resident days. 1.64
21% better than State average

State average: 2.08

ED visits per 1,000 days Info Number of outpatient emergency department visits per 1,000 long-stay resident days. 0.80
29% better than State average

State average: 1.12

Short-stay resident measures
Significantly above average State avg: 3.8 Info CMS star rating based on short-stay quality measure performance. 5 stars = much above average, 1 star = much below average.
Pneumococcal Vaccine Info Percent of short-stay residents assessed and appropriately given the pneumococcal vaccine 98.4%
25% better than State average

State average: 78.9%

Antipsychotic medication increase Info Percent of short-stay residents who newly received an antipsychotic medication 0.5%
60% better than State average

State average: 1.2%

Influenza Vaccine Info Percent of short-stay residents assessed and appropriately given the seasonal influenza vaccine 95.4%
19% better than State average

State average: 80.1%

Re-hospitalized after SNF stay Info Percentage of short-stay residents who were re-hospitalized after their nursing home admission. 21.7%
15% better than State average

State average: 25.4%

Emergency department visits Info Percentage of short-stay residents who had an outpatient emergency department visit. 7.0%
15% better than State average

State average: 8.2%

Falls with major injury Info Percentage of SNF residents who experience falls with major injury during their stay. 0.0%
100% better than State average

State average: 0.8%

Ability to care for self at discharge Info Percentage of residents at or above expected ability to care for themselves at discharge. 50.7%
6% worse than State average

State average: 53.7%

Successful return to home or community Info Rate of successful return to home or community from a skilled nursing facility. 49.5%
In line with State average

State average: 50.6%

Breakdown by payment type

Medicare

39% of new residents, usually for short-term rehab.

Typical stay 1 - 2 months

Private pay

48% of new residents, often for short stays.

Typical stay 1 - 2 months

Medicaid

13% of new residents, often for long-term daily care.

Typical stay 1 years

Facility Characteristics

Source: CMS Long-Term Care Facility Characteristics (Data as of Jan 2026)

Total residents 95
Medicare
16
16.8% of residents
Medicaid
62
65.3% of residents
Private pay or other
17
17.9% of residents
Programs & Services
Residents Group

Residents meet regularly to discuss policies, care quality, and activities

Active Resident Council

Organized group of residents that meets regularly to discuss facility policies, quality of life, and activities.

Finances and operations

Based on CMS SNF Cost Report for fiscal year ending in 12/2023.

For-profit
Operated by a single business entity.
Net patient revenue Info Net patient revenue — what the home actually collects for resident care, after contractual allowances, bad debt and discounts are subtracted from its gross charges (CMS cost report, Worksheet G-3). It covers resident care only; money the home earns from other sources is shown separately as "Other income."
$12.3M
Net patient income Info Net patient income: net patient revenue minus the home's total operating expenses. A positive figure means it earns more from resident care than it spends to deliver it; a negative figure means the opposite. It excludes non-operating "other income."
$248.5K
For-profit Operated by a single business entity.
Net patient revenue Info Net patient revenue — what the home actually collects for resident care, after contractual allowances, bad debt and discounts are subtracted from its gross charges (CMS cost report, Worksheet G-3). It covers resident care only; money the home earns from other sources is shown separately as "Other income."
$12.3M Rank #233 / 292Revenue — State benchmarkedThis home is ranked 233rd out of 292 homes in New Jersey for Revenue. Shows this facility's annual revenue compared to the New Jersey average. Higher revenue generally means more resources for staffing and capital — read alongside Payroll %.Facilities with the same value for a metric share the same rank. Rankings are based only on facilities in New Jersey that report data for that category. Facilities without available data are excluded from the ranking.Click the rank badge to see the full State ranking.Click here to see the full State ranking.
Net patient income Info Net patient income: net patient revenue minus the home's total operating expenses. A positive figure means it earns more from resident care than it spends to deliver it; a negative figure means the opposite. It excludes non-operating "other income."
$248.5K
Other income Info Money the home earns outside of resident care — such as investments, grants, rentals and other non-operating sources (CMS cost report, Worksheet G-3). It is tracked separately from net patient revenue: it is not part of that figure, and it is not included in net patient income.
$12.0K
Payroll costs Info Staff salaries plus wage-related costs — benefits such as payroll taxes, health insurance and retirement — from the home's own accounting records (CMS cost report, Worksheet A). Contract or agency labor is counted separately, under other operating costs. Rank #237 / 292Payroll — State benchmarkedThis home is ranked 237th out of 292 homes in New Jersey for Payroll. Shows total annual staff payroll benchmarked to the New Jersey average. Higher payroll investment relative to peers often signals better staffing and less reliance on cheaper contract labor.Facilities with the same value for a metric share the same rank. Rankings are based only on facilities in New Jersey that report data for that category. Facilities without available data are excluded from the ranking.Click the rank badge to see the full State ranking.Click here to see the full State ranking.
$6.2M 50.4% of net patient revenue Info Payroll as a share of revenue: staff salaries and wage-related benefits divided by net patient revenue. A higher figure means more of each revenue dollar goes to staff pay. Rank #150 / 292Payroll % — State benchmarkedThis home is ranked 150th out of 292 homes in New Jersey for Payroll %. Shows payroll as a percentage of revenue versus the New Jersey average. Well-run New Jersey facilities typically land around 55–66% — the top third Statewide. Below 25% may signal understaffing or heavy agency use — read with Staffing ratings.Facilities with the same value for a metric share the same rank. Rankings are based only on facilities in New Jersey that report data for that category. Facilities without available data are excluded from the ranking.Click the rank badge to see the full State ranking.Click here to see the full State ranking.
Other operating costs Info Everything it costs to run the home apart from payroll — food, utilities, supplies, maintenance, contract labor and administration. Calculated as total operating expense minus payroll (staff salaries and wage-related benefits).
$5.8M
Total costs Info The home's total operating expense for the year — all the costs of running it, salaries included (CMS cost report, Worksheet G-3).
$12.0M

Who this home usually serves

TYPE OF STAY

Mix of rehab and long-term care

This home supports both short-term rehab and long-term care, with residents staying for a wide range of durations.

New residents most often arrive under private pay (48% of admissions), and a typical private pay stay runs around 1 - 2 months.

Admissions
345 total

Coverage residents most often arrive under.

Medicare 39%
Private pay 48%
Medicaid 13%
Discharges
347 total

Coverage residents most often leave under.

Medicare 33%
Private pay 45%
Medicaid 22%

Places of interest near Clover Meadows Healthcare And Rehabilitation Cente

Address 0.0 miles from city center Info Estimated distance in miles from Lawrenceville's city center to Clover Meadows Healthcare And Rehabilitation Cente's address, calculated via Google Maps.

Calculate Travel Distance to Clover Meadows Healthcare And Rehabilitation Cente

Add your location

Address

Compare Nursing Homes around the area

The information below is reported by the New Jersey Department of Health, Health Facilities Evaluation and Licensing.

Job Haines Home
NH
AL
HC
RC
SNF
Bloomfield (Bloomfield Avenue) -40 - 85 Studio / 1 Bed / Private / Semi-Private Rooms
Fellowship Village
NH
AL
HC
HOS
IL
MC
SNF
Basking Ridge -67 - 25 Studio / 1 Bed / 2 Bed
Winchester Gardens
NH
AL
HC
IL
MC
RC
SNF
Maplewood (Newark Heights) -30 - 24 Studio / 1 Bed
Brighton Gardens of Edison
NH
AL
HOS
MC
SNF
Edison (Oak Tree Road) -118 A+ 64 Studio / 1 Bed
Clover Meadows Healthcare And Rehabilitation Cente
NH
AL
Lawrenceville -100 - 54 -

Frequently Asked Questions about Clover Meadows Healthcare And Rehabilitation Cente

Who is the owner of Clover Meadows Healthcare And Rehabilitation Cente?

Clover Meadows Healthcare And Rehabilitation Cente is legally operated by Clover Meadows Healthcare & Rehab Center LLC, and administered by Yoseph Klein.

Is Clover Meadows Healthcare And Rehabilitation Cente in a walkable area?

Clover Meadows Healthcare And Rehabilitation Cente has a walk score of 54. Moderately walkable. Some errands can be accomplished on foot, with a mix of nearby amenities.

What is the license number of Clover Meadows Healthcare And Rehabilitation Cente?

According to NJ state health department records, Clover Meadows Healthcare And Rehabilitation Cente's license number is 61104.

When does Clover Meadows Healthcare And Rehabilitation Cente's license expire?

According to NJ state health department records, Clover Meadows Healthcare And Rehabilitation Cente's license expires on October 31, 2026.

What is the occupancy rate at Clover Meadows Healthcare And Rehabilitation Cente?

Clover Meadows Healthcare And Rehabilitation Cente's occupancy is 86%.

Does Clover Meadows Healthcare And Rehabilitation Cente operate as a for-profit or non-profit?

Clover Meadows Healthcare And Rehabilitation Cente is registered as a for-profit in NJ.

Who is the administrator of Clover Meadows Healthcare And Rehabilitation Cente?

Yoseph Klein is the administrator of Clover Meadows Healthcare And Rehabilitation Cente.

Guides for Better Senior Living

Care Cost Calculator: See Prices in Your Area

Nursing Home Data Explorer

Don’t Wait Too Long: 7 Red Flag Signs Your Parent Needs Assisted Living Now

The True Cost of Assisted Living in 2025 – And How Families Are Paying For It

Understanding Senior Living Costs: Pricing Models, Discounts & Financial Assistance